
Integrate application logs collector with Test Observability
Learn how to push your server-side application error logs and stack traces to Test Observability.
Test Observability offers you a consolidated view of all logs from different systems with a timeline debugging experience wherein you can see the actual test failure and any other failure before the assertion failed.
The consolidated logs view can also include errors and stack traces from your backend staging application that is under test so that you can see the logs generated at the application in the context of a test case.
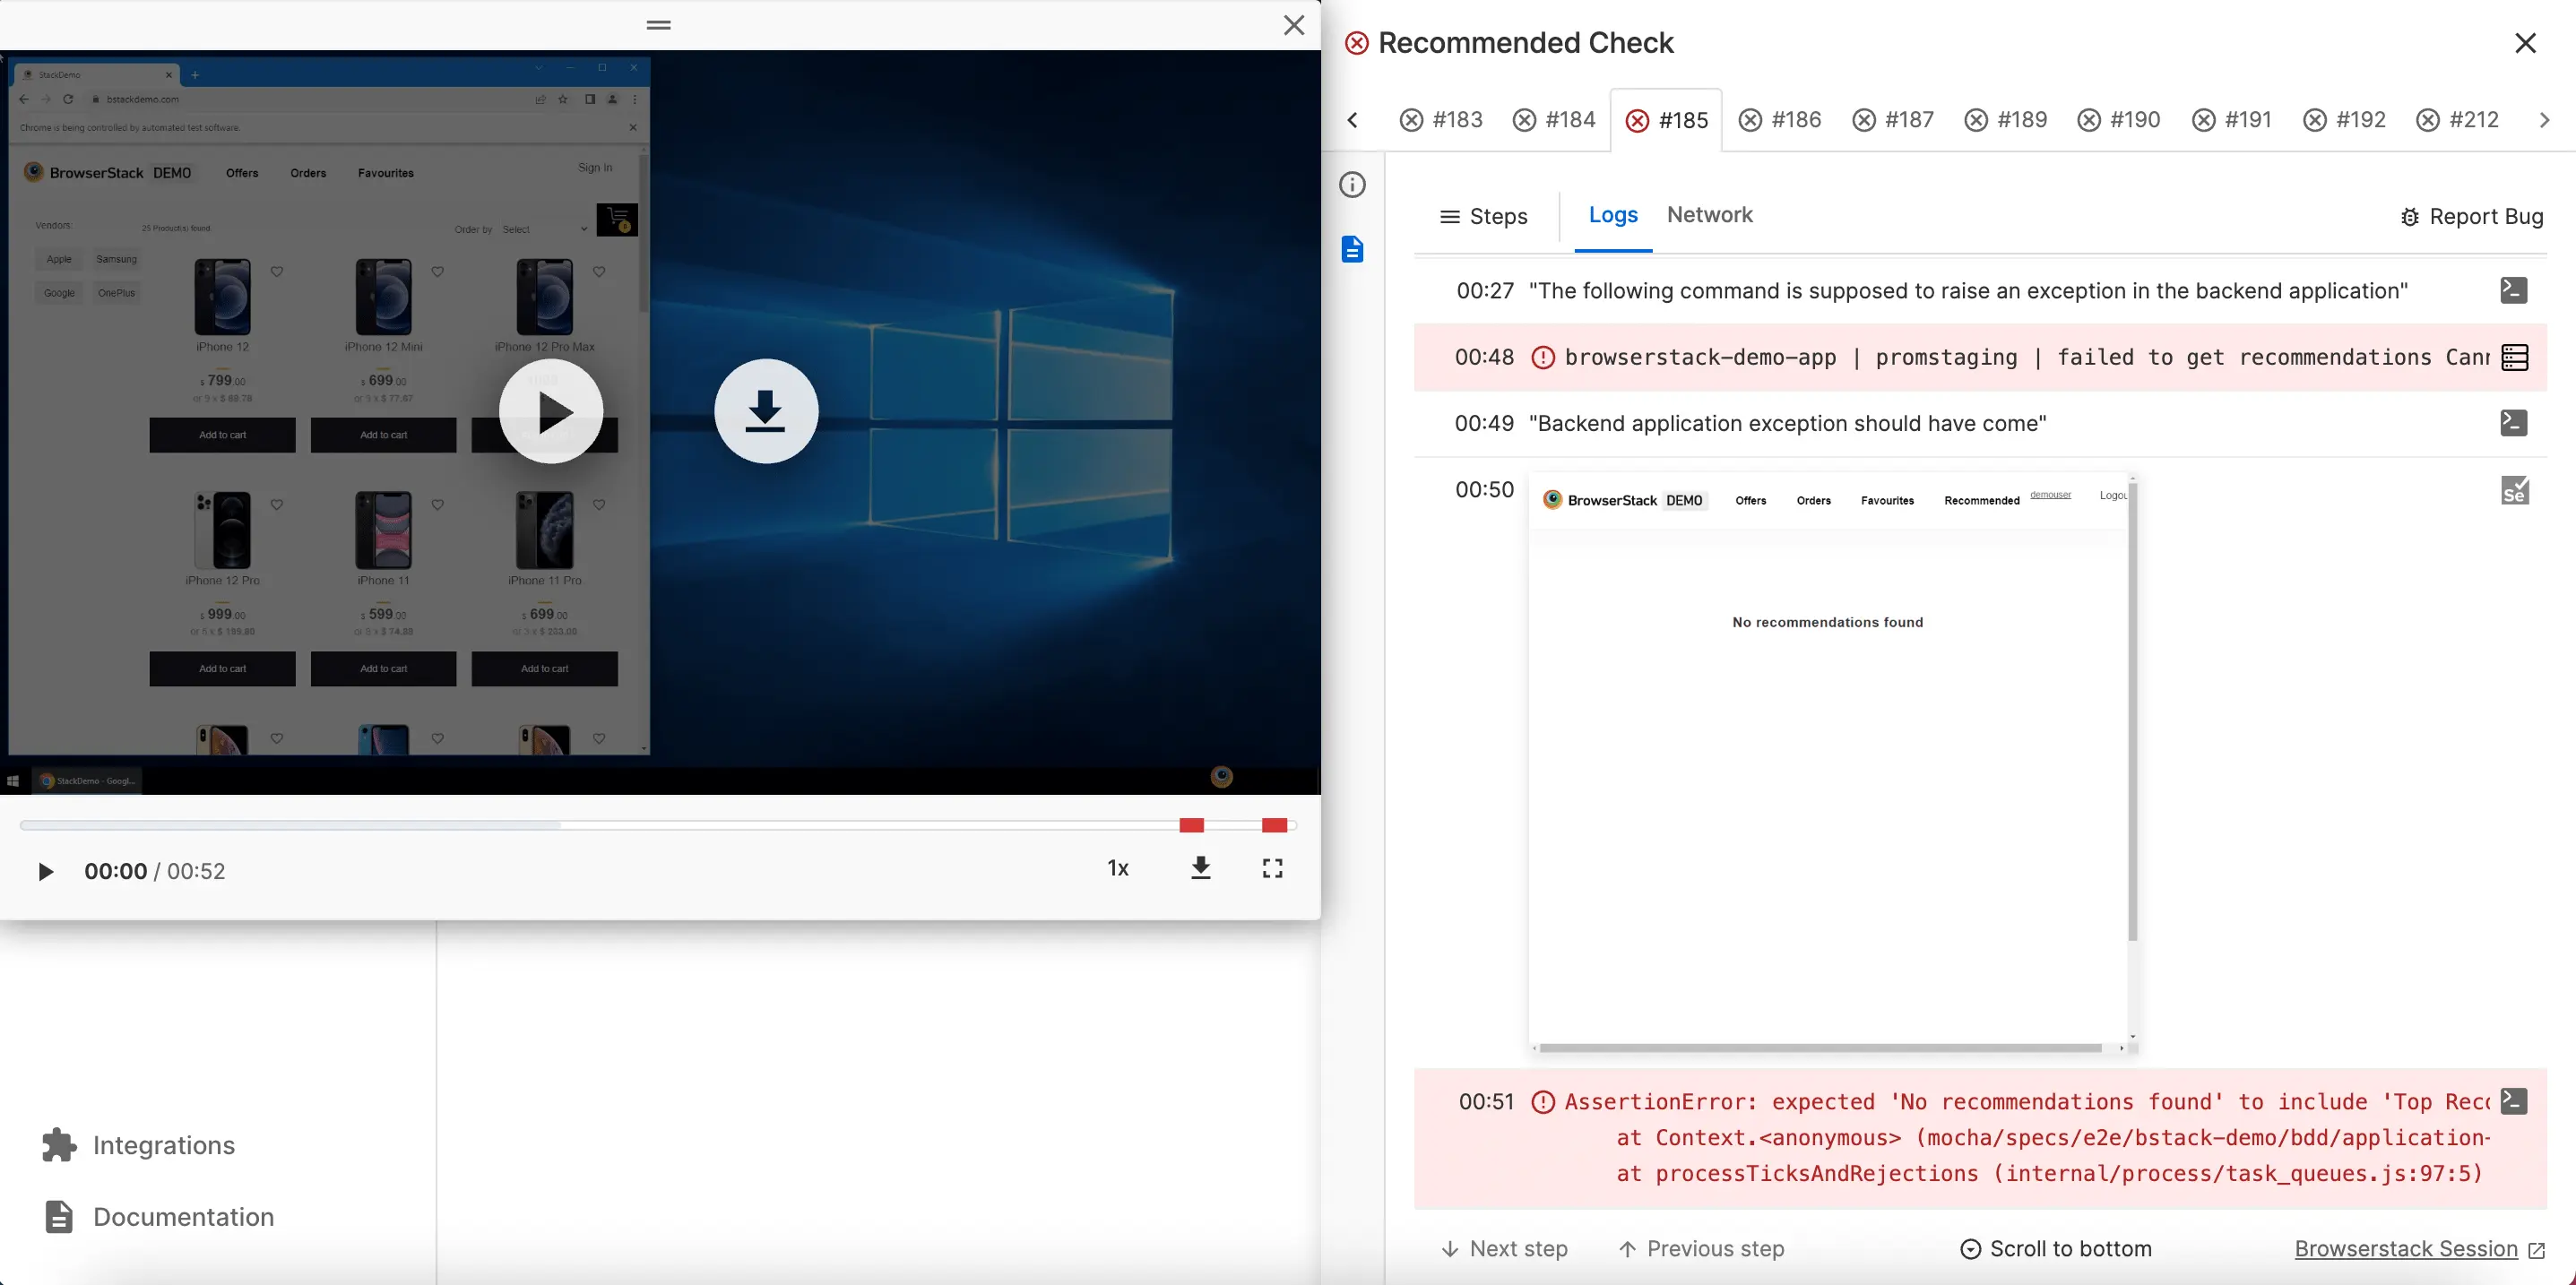
The example screenshot below shows the consolidated logs of a failed test case where the assertion error is visible along with the preceding error stack trace generated at the backend staging application server:
Prerequisites
You should have:
- Logging instrumentation enabled in your staging application server that is under test.
- A
file.logor an equivalent log file for each of the instances/microservices of your application from where you’d want to enable logging during testing.
Supported log collector integrations
We’re documenting the integration guides for the following logging services but you can make it work pretty much with any service that can send log lines to an API in a specific format.
Log upload through Filebeat and Logstash
Follow these steps to upload your log files to Test Observability:
Install Filebeat on your machine and add a files listener
- Install Filebeat (if not already installed) and run on any system/service which generates logs.
- Configure Filebeat as per the following example:
filebeat.inputs:
- type: filestream
  # Unique ID among all inputs, an ID is required.
  id: my-filestream-id
  # Change to true to enable this input configuration.
  enabled: true
  # Paths that should be crawled and fetched. Glob-based paths.
  paths:
    - /path/to/your/file1.log
    - /path/to/your/file2.log
output.logstash:
  # The Logstash hosts
  hosts: ["localhost:5044"]
In this configuration, the logs are sent to a Logstash service running on localhost:5044. You need to configure it to the correct URL where Logstash is running in your case.
On Logstash machine, install Logstash and Loki plugin
- Install Logstash on a machine (if not already done).
- Install the Loki plugin using the following command:
bin/logstash-plugin install logstash-output-lokiConfigure Logstash
You can use the following config file to configure Logstash. Note the usage of output configuration with url for uploading the logs to Test Observability and the usage of username and password which should be the same as you’re using to run Test Observability.
input {
  beats {
    port => 5044 # for listening to Filebeat events
  }
}
filter {
  if [log][file][path] =~ "accounts.log" {
    json {
      source => "message"
    }
    mutate {
      add_field => {
        "app" => "%{[service]}"
        "logmessage" => "%{[message]} stacktrace=%{[stack]}"
        "loglevel" => "%{[level]}"
      }
    }
  } else {
    grok {
      match => { "message" => "%{TIMESTAMP_ISO8601:timestamp} %{LOGLEVEL:loglevel} %{GREEDYDATA:logmessage} service=%{NOTSPACE:app}" }
    }
  }
  mutate {
    add_field => {
      "env" => "staging"  //this is for specifying the env of the application
    }
    replace => { "type" => "stream"}
    remove_field => ["src"]
  }
}
output {
  loki {
    url => "https://logs-observability.browserstack.com/loki/api/v1/push"
    username => "YOUR_USERNAME"
    password => "YOUR_ACCESS_KEY"
    batch_size => 112640
    retries => 5
    min_delay => 3
    max_delay => 500
    message_field => "logmessage"
    include_fields => ["app", "env", "loglevel"]
  }
}
Restart Logstash
Restart your Logstash for changes to take effect.
Log upload through Logstash
Install Logstash and Loki plugin
- Install Logstash on a machine (if not already done).
- Install the Loki plugin using the following command:
bin/logstash-plugin install logstash-output-lokiConfigure Logstash
You can use the following config file to configure Logstash. Note the usage of output configuration with url for uploading the logs to Test Observability and the usage of username and password which should be the same as you’re using to run Test Observability.
input {
  input {
    file {
      path => "/path/to/file.log"
      type => "nginx"
    }
  }
}
filter {
  if [log][file][path] =~ "accounts.log" {
    json {
      source => "message"
    }
    mutate {
      add_field => {
        "app" => "%{[service]}"
        "logmessage" => "%{[message]} stacktrace=%{[stack]}"
        "loglevel" => "%{[level]}"
      }
    }
  } else {
    grok {
      match => { "message" => "%{TIMESTAMP_ISO8601:timestamp} %{LOGLEVEL:loglevel} %{GREEDYDATA:logmessage} service=%{NOTSPACE:app}" }
    }
  }
  mutate {
    add_field => {
      "env" => "staging"  #this is for specifying the env of the application
    }
    replace => { "type" => "stream"}
    remove_field => ["src"]
  }
}
output {
  loki {
    url => "https://logs-observability.browserstack.com/loki/api/v1/push"
    username => "YOUR_USERNAME"
    password => "YOUR_ACCESS_KEY"
    batch_size => 112640
    retries => 5
    min_delay => 3
    max_delay => 500
    message_field => "logmessage"
    include_fields => ["app", "env", "loglevel"]
  }
}
Restart Logstash
Restart your Logstash for changes to take effect.
Log upload through Promtail
Download and Install Promtail
You’d need to download and install Promtail if not already done.
Create Promtail config
You can use the following config file to configure Promtail. You can also learn more about Promtail config files. Note the usage of clients config. The url used is the API endpoint of Test Observability where your logs would be uploaded and the username and password need to be the same as the one used to run Test Observability through the framework/language SDKs.
positions:
  filename: /any/filepath/with/write/access/positions.yaml
clients:
  - url: https://logs-observability.browserstack.com/loki/api/v1/push
    basic_auth:
      username: YOUR_USERNAME
      password: YOUR_ACCESS_KEY
scrape_configs:
  - job_name: applicationLogs
    static_configs:
    - targets:
      - localhost
      labels:
        sel: applog
        __path__: /path/to/your/app.log  # your application's logfile
    pipeline_stages:
    - match:
        selector: '{sel="applog"}'
        stages:
        - regex:
            expression: '(?P<time>[T\d-:.Z]*) (?P<loglevel>[a-zA-Z]+) (?P<logmessage>.+) service=(?P<app>.+)'
        - timestamp:
            source: time
            format: RFC3339
        - labels:
            loglevel:
            app:
        - static_labels:
            env: staging # the application environment that you'd need to pass
        - output:
            source: logmessage
Run Promtail with config
You’d then need to run Promtail using the config as shown below:
./promtail-darwin-amd64 -config.file promtail-config.yamlLog upload through fluentd
Download fluentd agent
You need to download and install the fluentd agent using one of the listed methods.
Install Loki plugin
Follow these steps to install the loki plugin:
fluent-gem install fluent-plugin-grafana-lokiCreate Fluentd config file
You’d then need to create a Fluentd config file as shown below:
<source>
  @type tail
  tag index.log
  path /path/to/application/logfile.log
  <parse>
    @type regexp
    expression /^(?<time>.+Z) (?<loglevel>[^ ]*) (?<message>.+) service=(?<app>.+)$/
  </parse>
</source>
<match index.log>
  @type loki
  url "https://logs-observability.browserstack.com"
  username "YOUR_USERNAME"
  password "YOUR_ACCESS_KEY"
  <label>
    app
    loglevel
  </label>
  extra_labels {"env":"dev11"} // this is the app env
  flush_interval 10s
  flush_at_shutdown true
  buffer_chunk_limit 1m
</match>
Run Fluentd with config
You’d then need to run Fluentd using the config as shown below:
fluentd -c ./fluent/fluent.conf -vv &Limitations of application logs mapping to test cases
- Test Observability captures only the errors in your backend application logs. Info, debug or warning logs won’t be captured by Test Observability yet.
- Test Observability maps errors or stack traces seen in your application logs with test cases based on timestamp mapping since we do not have any request tracing implemented yet. Hence, it might so happen that if multiple tests are running in parallel and an exception occurs in your application, the same would be mapped to all such tests that were running at that point in time.
We're sorry to hear that. Please share your feedback so we can do better
Contact our Support team for immediate help while we work on improving our docs.
We're continuously improving our docs. We'd love to know what you liked
We're sorry to hear that. Please share your feedback so we can do better
Contact our Support team for immediate help while we work on improving our docs.
We're continuously improving our docs. We'd love to know what you liked
Thank you for your valuable feedback!