Build Insights
Discover meaningful insights on your build runs and the tests associated with them.
Build Insights is the one-stop place to analyze and debug your builds. You can view comprehensive information on your builds and investigate more information on your build runs from this interactive console.
Navigate to Build Insights
When you click any build run in Build Runs, Build Insights opens up, with a host of useful information about the build. You can also access Build Insights by clicking a build from the recent builds in Testing Trends.
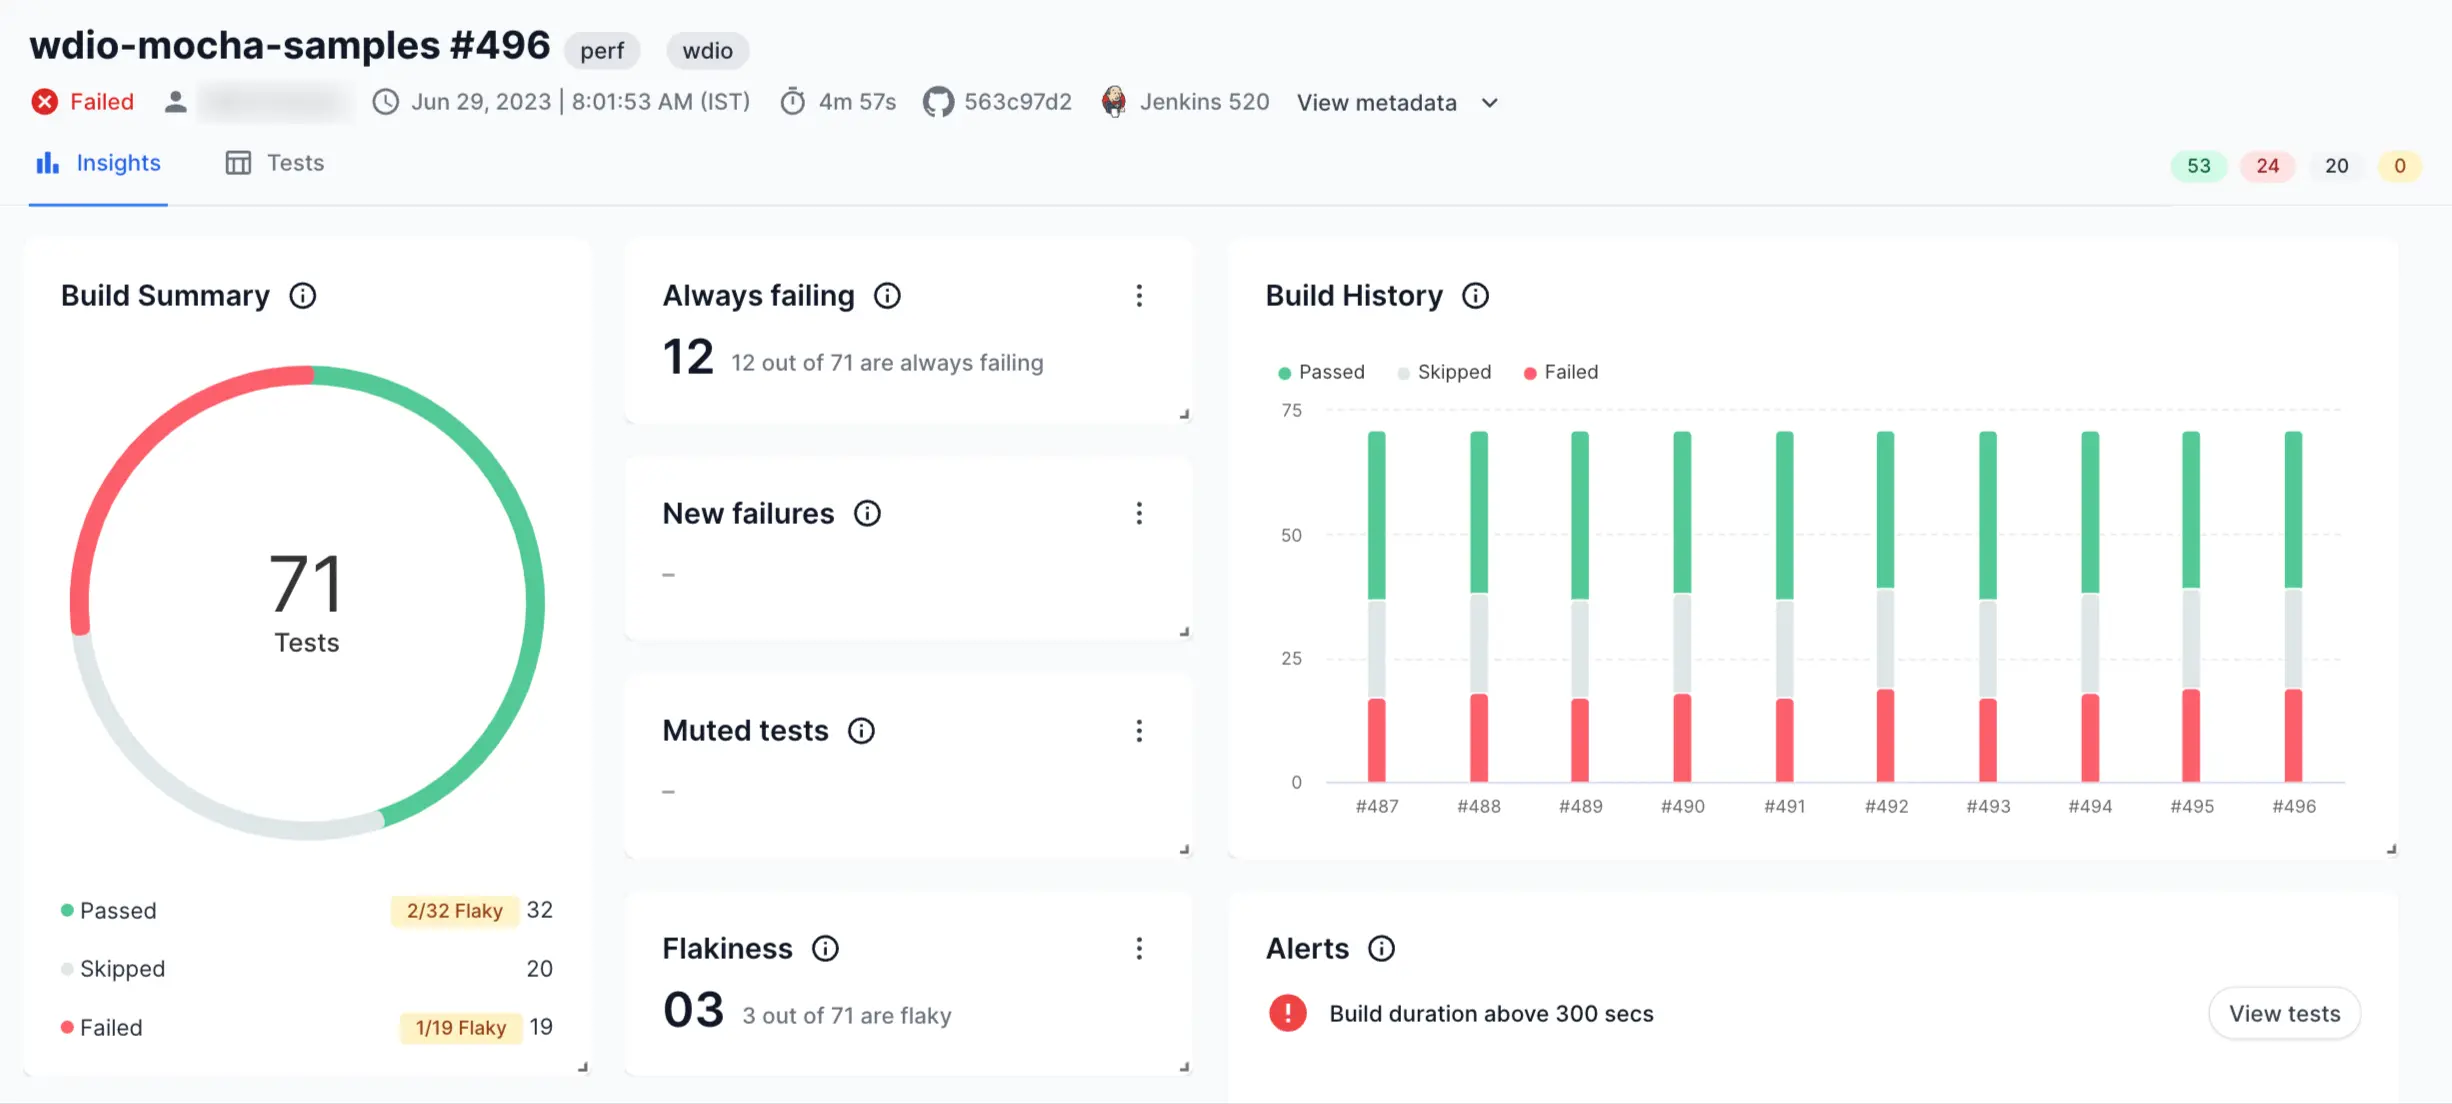
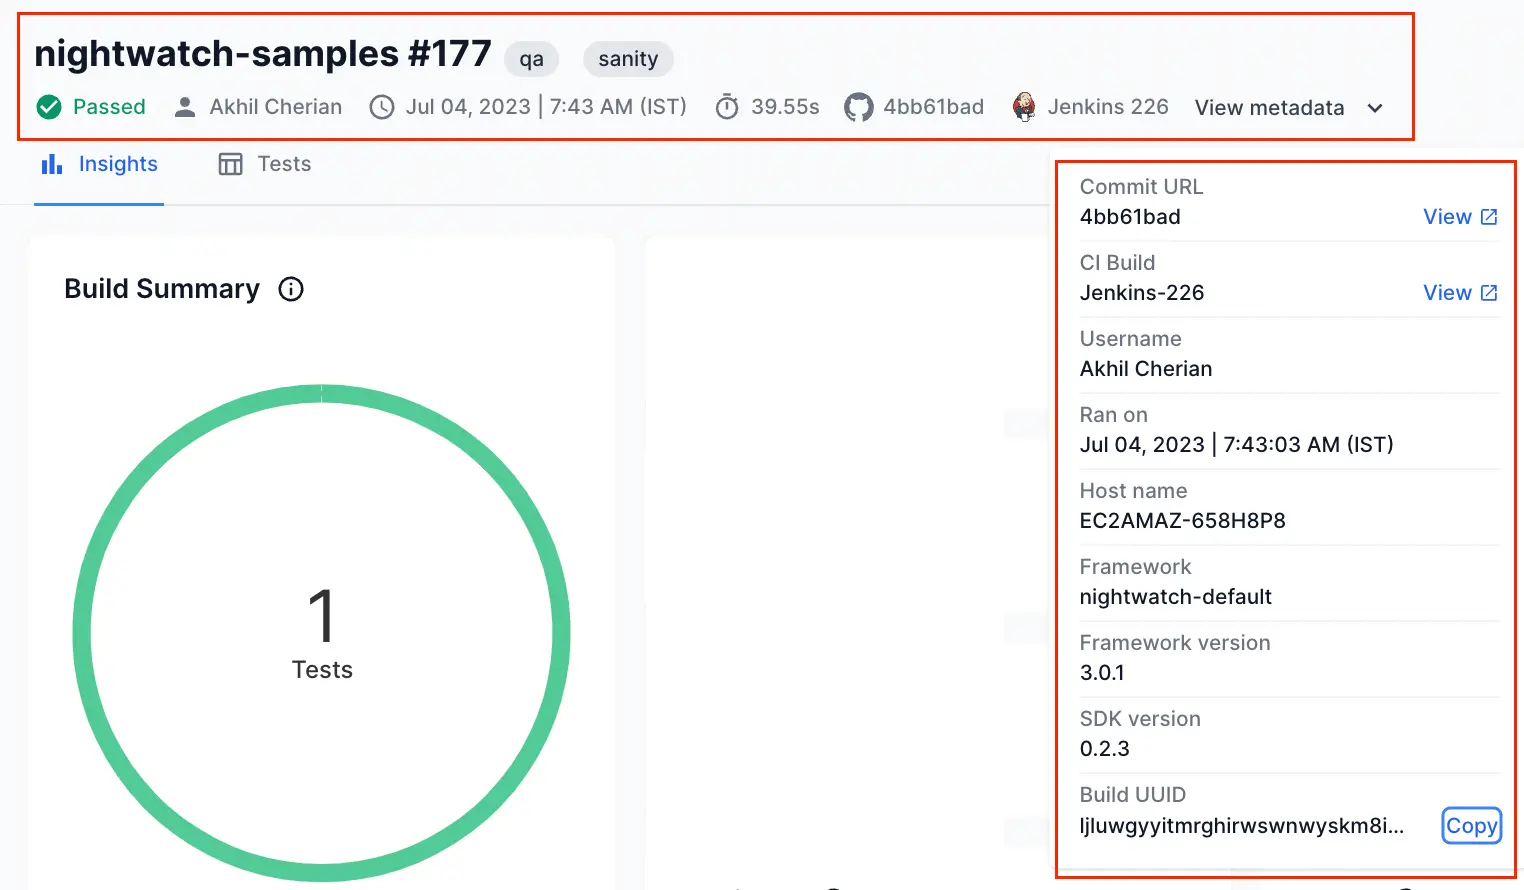
Build Metadata
Build Insights presents the following metadata about the selected build run:
- Build Name: Name of the build.
- Build Number: ID of the specific build run.
- Custom Build Tags: Tags that you can associate with a build.
-
Build Status: The status of the build that denotes whether the build
passed,failed, or wasskipped. - User: Specifies the name of the user who triggered the build.
- Start time: The timestamp at which the build was triggered.
- Duration: The duration for which the build ran.
- Commit ID: The Git commit ID associated with the build. You can click the commit ID to view the commit on supported SCM tools like GitHub and GitLab. Support for more SCMs is coming soon.
- CI Job name: You can click the CI job name to view the job in your CI tool that triggered the build.
- Host name: The host system from which the build was triggered.
- Framework: The test framework of your build.
- Framework Version: The version number of the test framework of your build.
- SDK Version: The BrowserStack SDK version you use in your build.
- Build UUID: The unique ID of the build run.
Insights tab
The Insights tab in Build Insights presents a set of useful charts and data points that provide detailed information about the selected build.
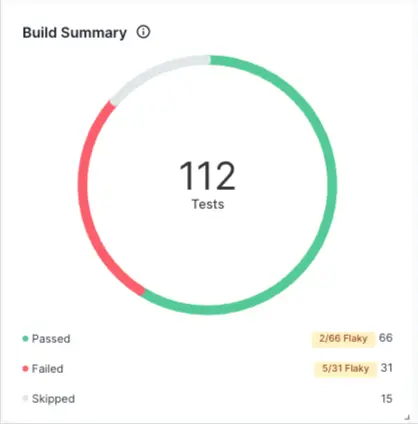
Build summary
The Build Summary donut chart illustrates the number of tests that passed, failed, or were skipped in a build run. This chart also highlights any flaky tests in a build run. You can click various elements on the chart to view a filtered list of tests.
Always failing tests
The Always failing count denotes the number of tests in the selected build that continuously fails, as per the conditions set in the Always Failing Smart Tag.
You can click the kebab menu and select View Trends to view more details in Testing Trends.

New failures
The New failures count denotes the number of tests that started to fail recently, as per the conditions set in the New Failure Smart Tag.
You can click the kebab menu and select View Trends to view more details in Testing Trends.

Flakiness
The Flakiness count denotes the number of flaky tests in the selected build as per the conditions set in the flaky Smart Tag.
You can click the kebab menu and select View Trends to view more details in Testing Trends.

Muted tests
The Muted tests count denotes the number of tests you have muted in your build.
You can click the kebab menu and select View Trends to view more details in Testing Trends.

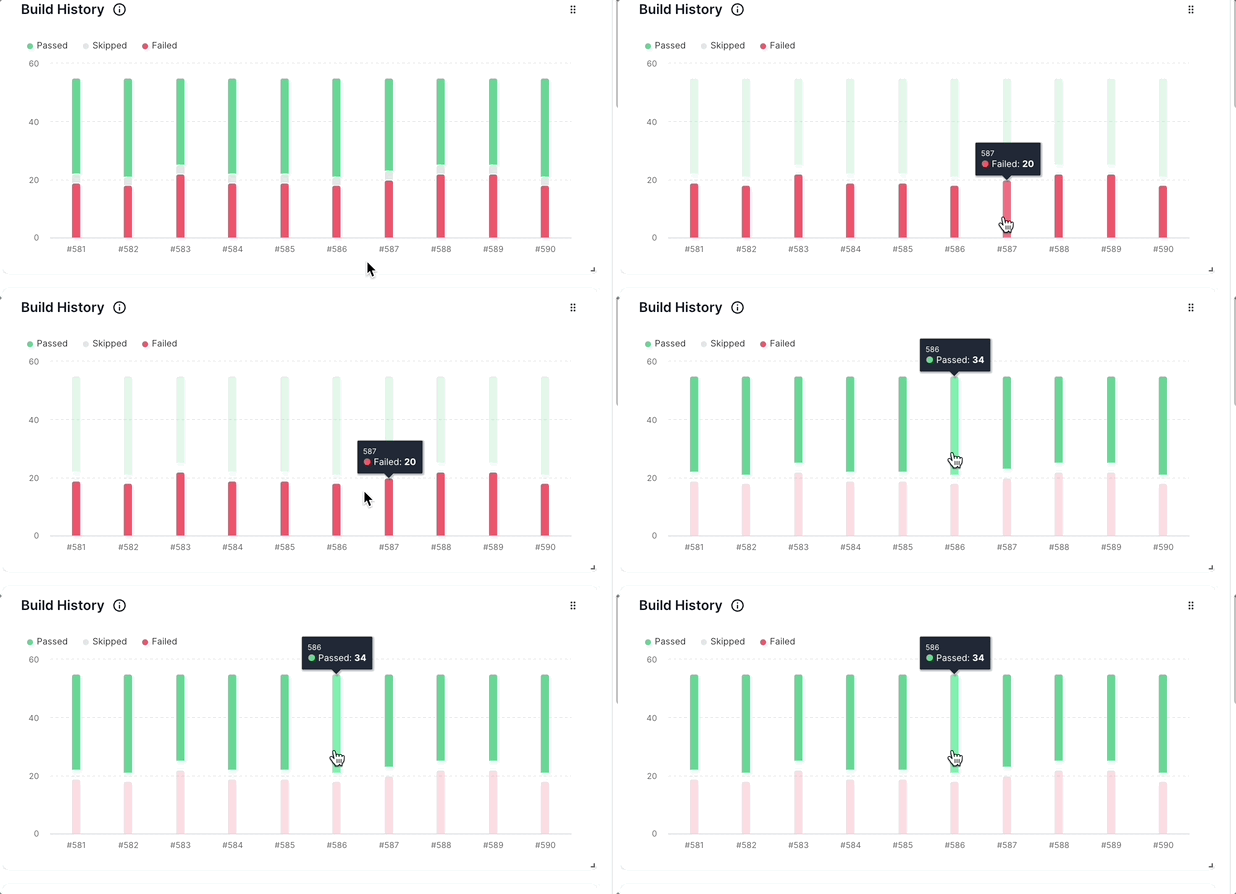
Build History
The Build History chart provides a trend of how the selected build has been performing over time. It illustrates the number of tests that were passed, failed, or skipped in each of the build runs.
You can hover over the chart and click it to view more details about the tests.
Alerts
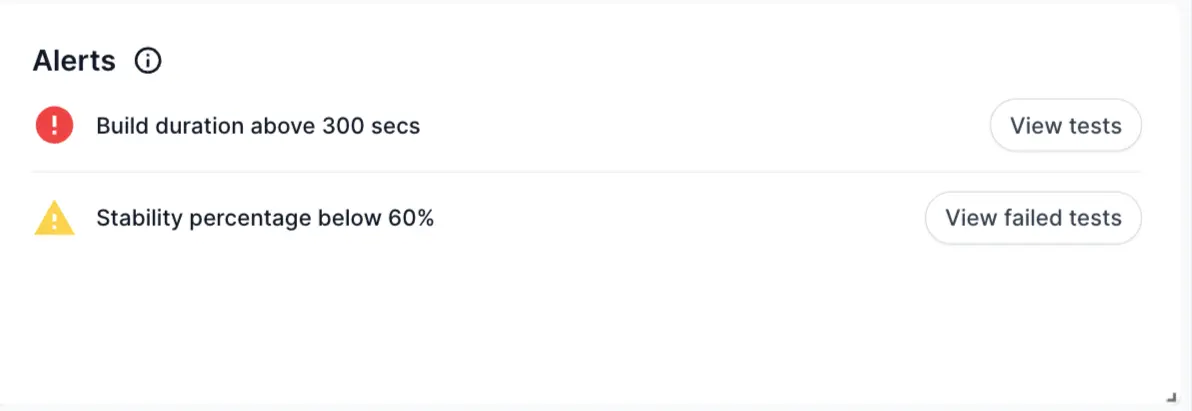
BrowserStack Test Reporting & Analytics allows users to set up custom rules for every build. If these rules are breached, you will see an alert on Build Insights, helping you quickly understand if the build failed any quality standards you might have set. For more information on setting up custom alerts, see Custom Alerts.
You can click the View failed tests button to view the tests that triggered a particular alert.
Unique Errors
The Unique Errors widget illustrates the impact of individual errors in your test suite.
This widget allows you to take a unique yet incredibly effective approach to resolving failures in your build. By fixing one underlying error, you could fix tens of tests impacted by the same error.
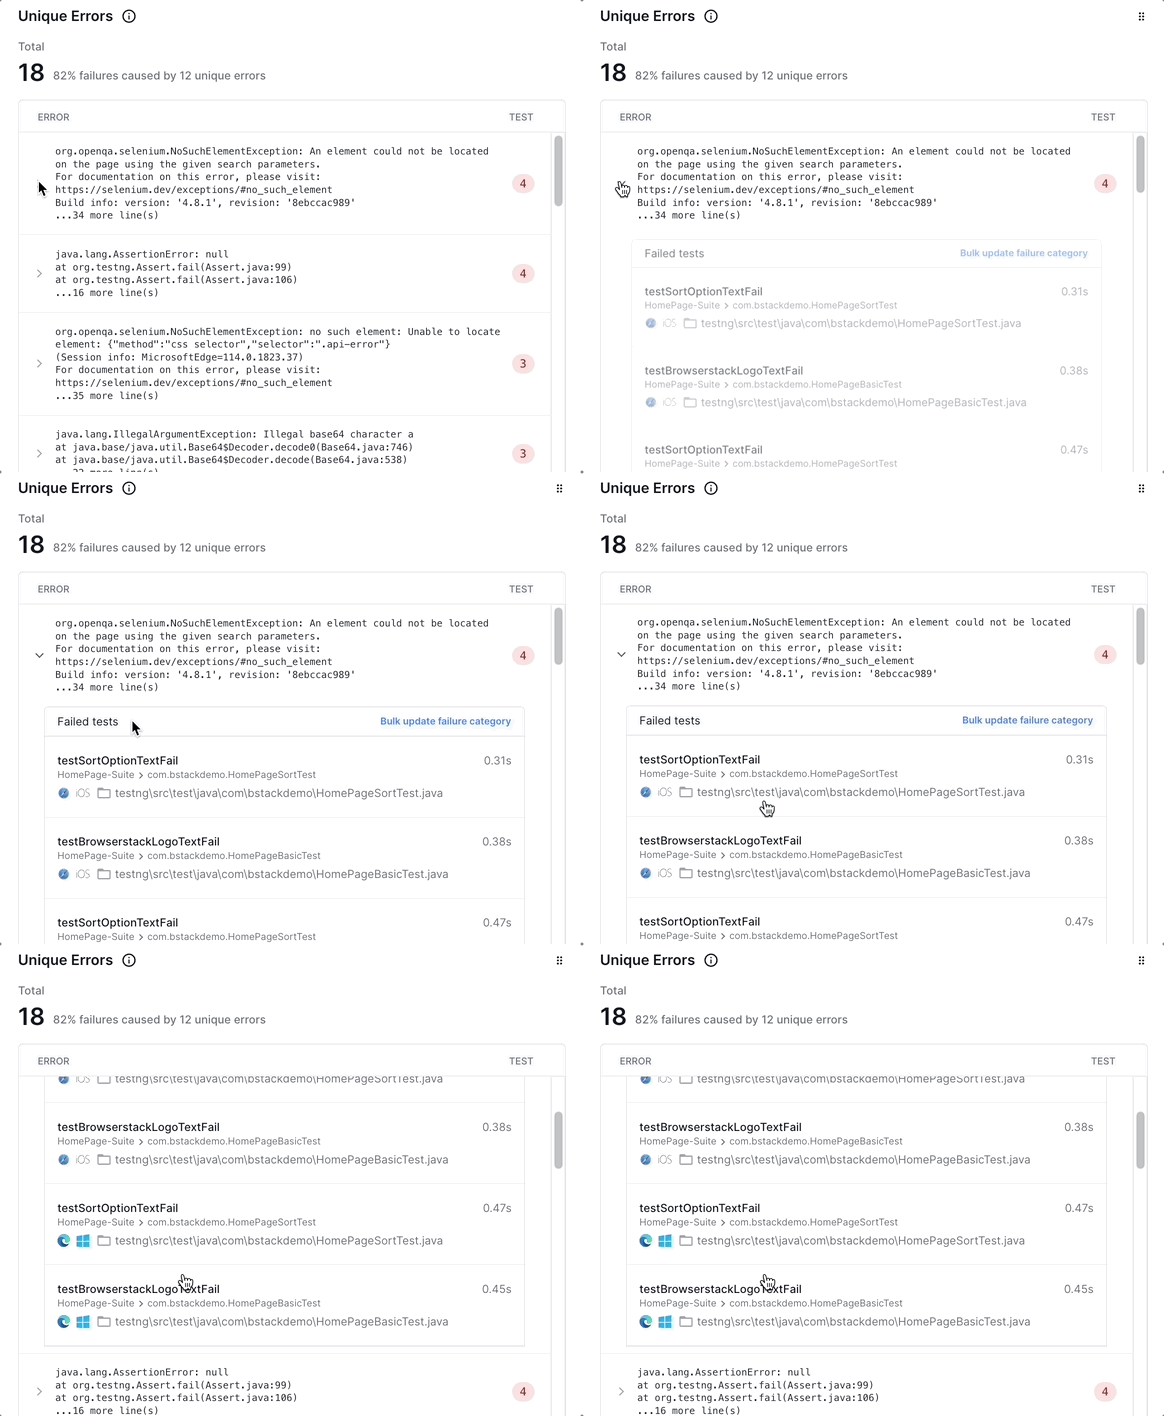
You can further click a test to inspect it using the Timeline Debugging view.
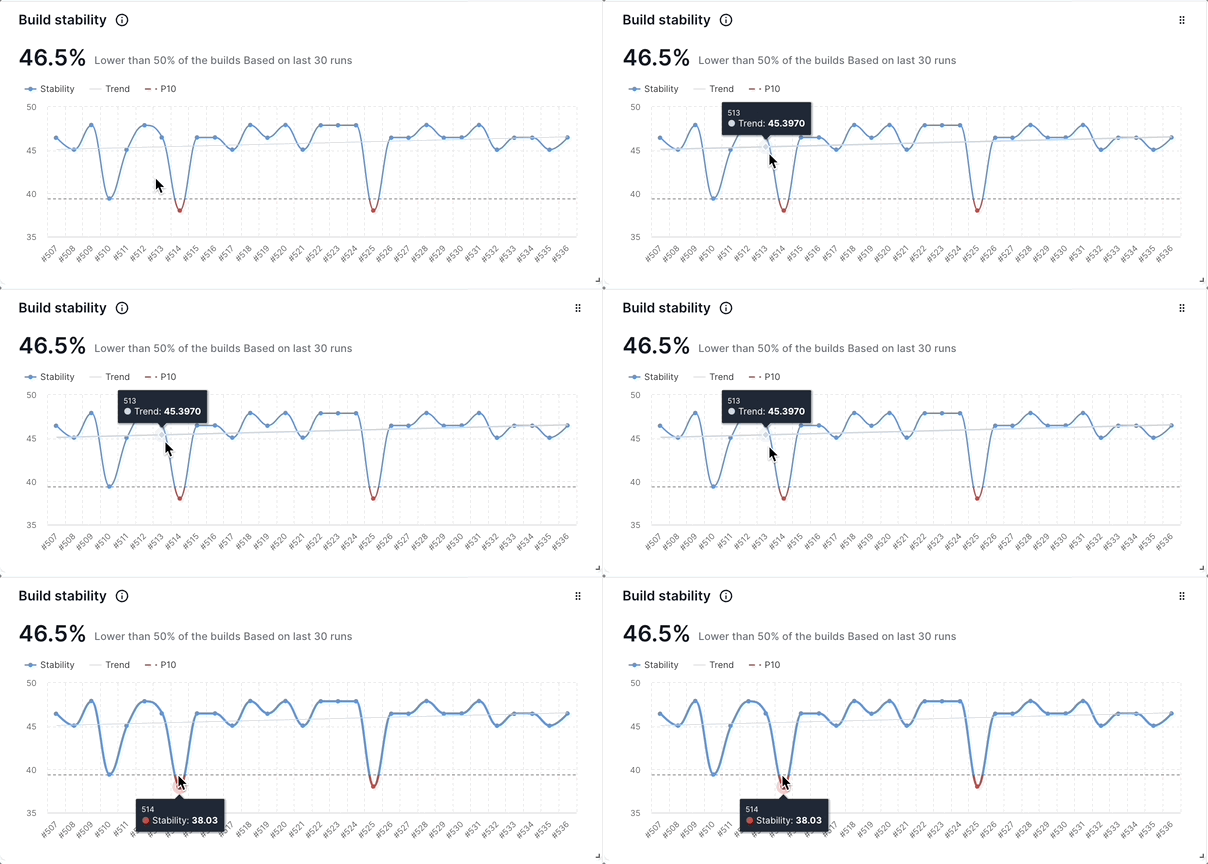
Build stability
The Build stability widget illustrates the change in the percentage of tests in a specific build that passes over time. You can hover over the chart to get more information or click on any point in the chart to view the tests in detail.
Run Summary
The Run Summary widget shows a summary of all the runs clubbed in a specific build. It is a comprehensive widget which consolidates information from multiple runs and re-runs of tests in a build that includes:
- Framework-level reruns specific to your test framework.
- Reruns triggered from CI.
- Reruns of tests which are part of a split run.
For more information on merging multiple runs and creating one single report, see Re-run tests with Test Reporting & Analytics.
The Run Summary widget has two tabs:
- Test Attempts: This tab caters to QAs who prefer to know how tests fared in each rerun, without complicating the information with what type of rerun it was. It lists rerun information agnostic of whether the rerun was framework-level, CI-triggered, or part of a split run. You can view the number of tests in each status, for every rerun in this tab.
This tab is useful for spotting flaky or unstable tests that required multiple runs to pass.
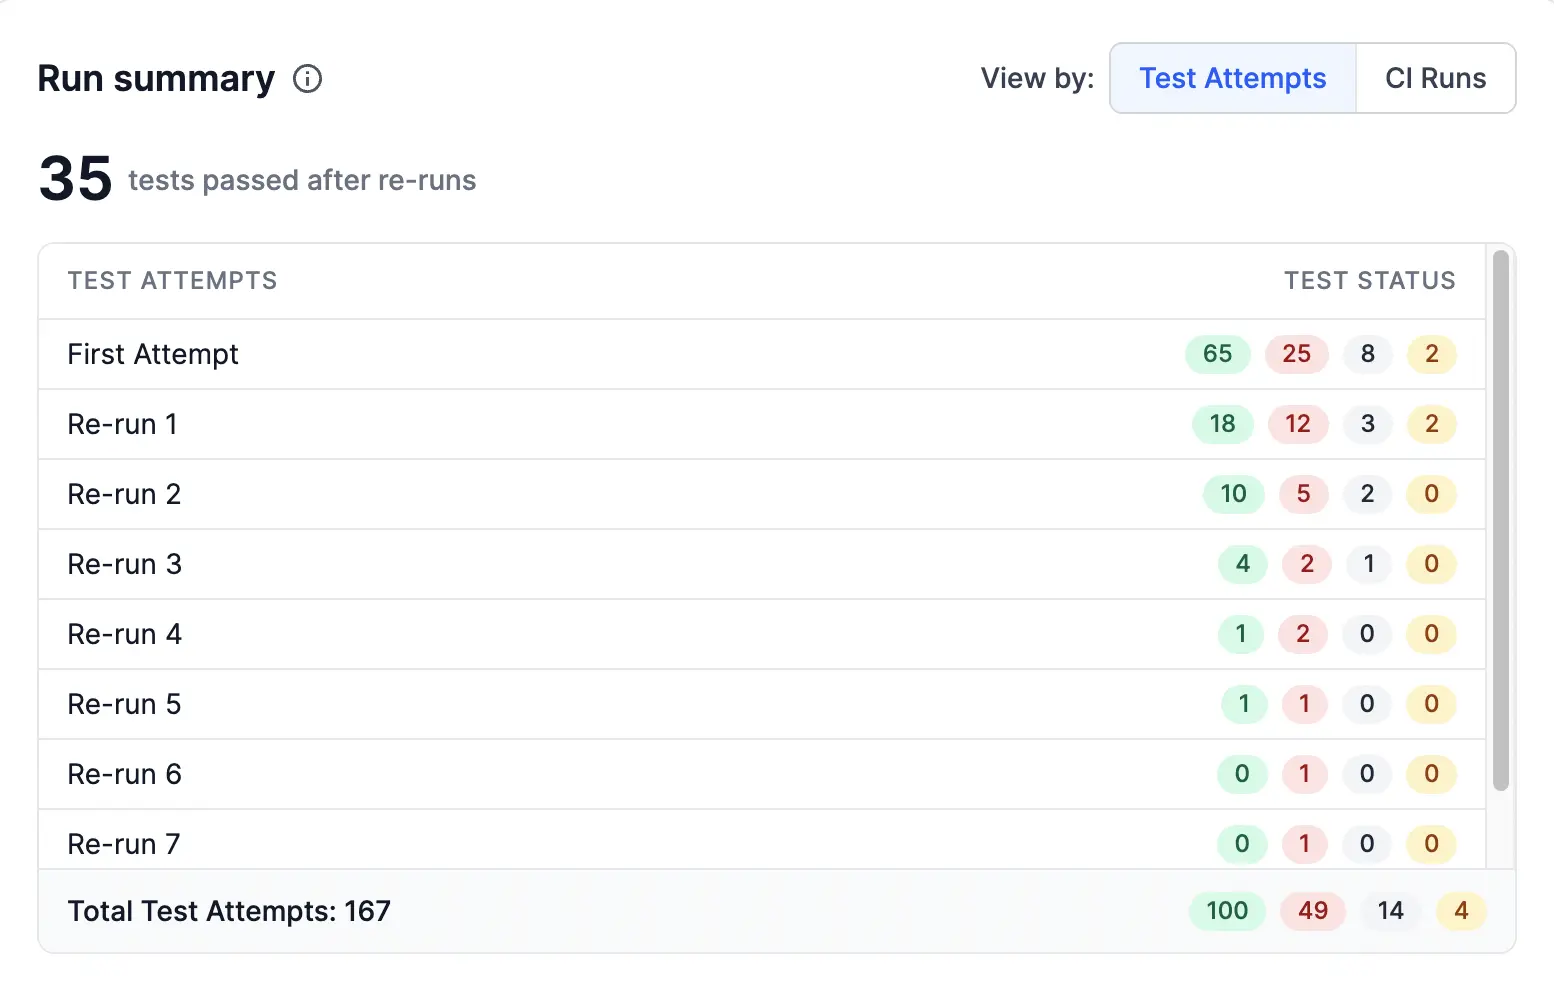
For example, the TEST STATUS column in the screenshot shows that Re-run 2 had 18 tests that passed, 5 tests that failed, and 2 tests that were skipped, and 0 unknown tests.
You can click on a count to view a filtered view.
-
CI-Runs: This tab shows a breakdown of the reruns and split runs in a hierarchical list. Here you can view all reruns one by one, with a break up of any split runs involved.
It also lists:
- The number of tests that are in
passed,failed,skipped, orunknownstatus for each rerun. - The user who triggered the rerun.
- CI tool and ID of the CI job that triggered the rerun.
- The total number of test executions and the number of tests in each status.
- The number of tests that are in
This tab is useful for understanding how your test suite ran across distributed environments or when re-triggering builds.
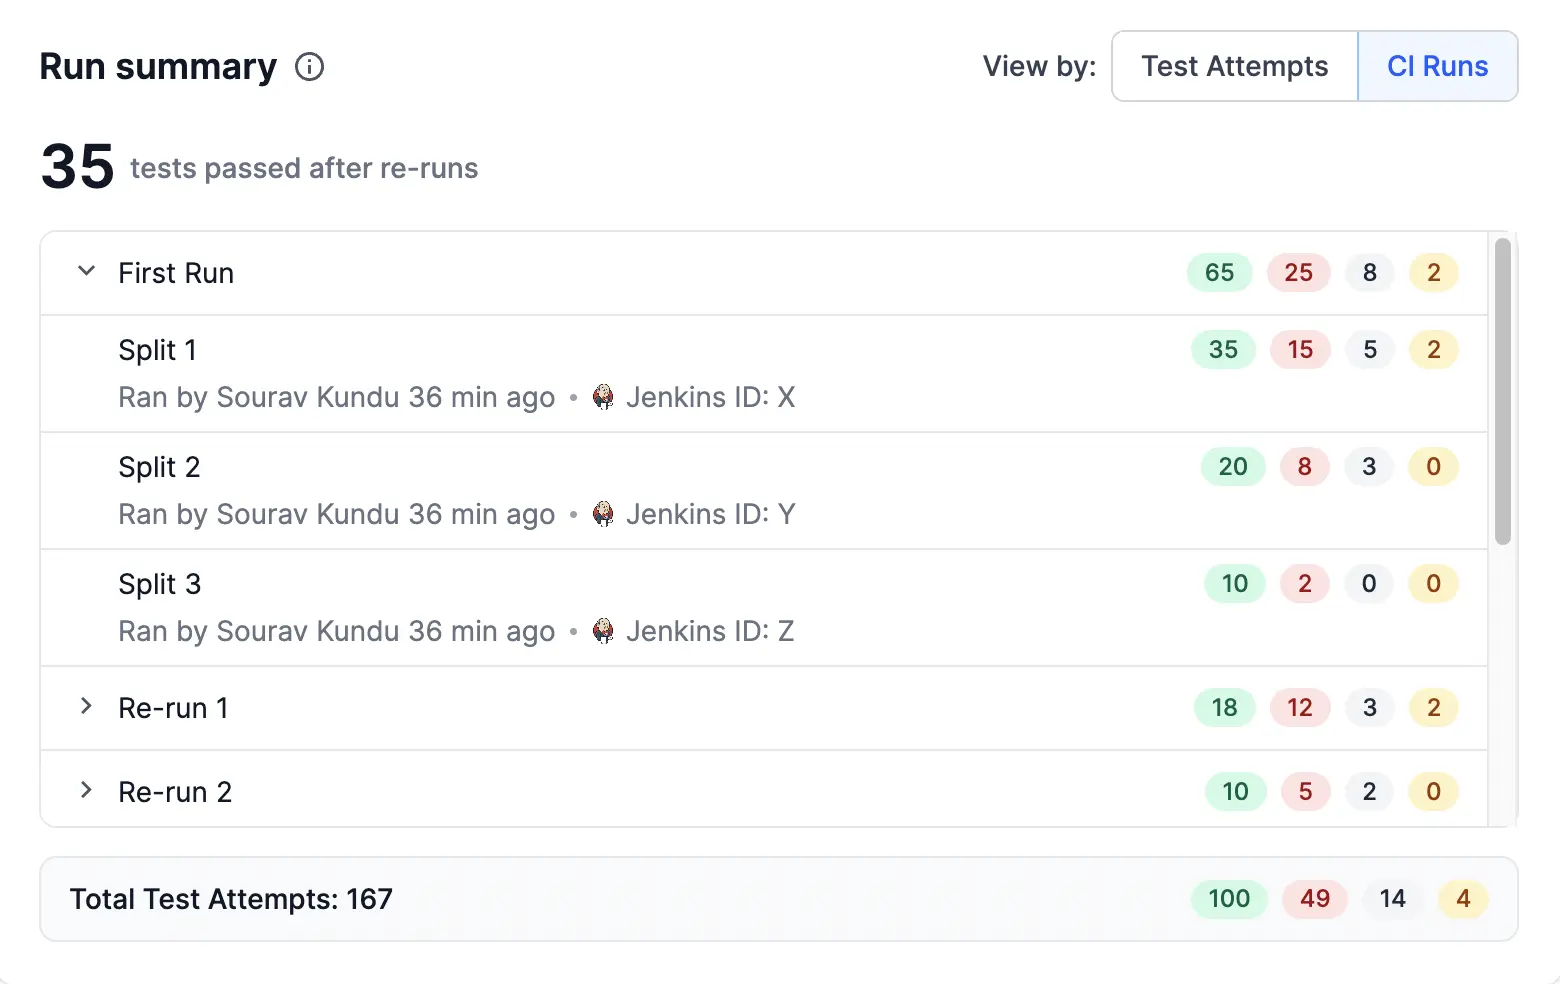
You can further click on a count to see a filtered view.
Failure Categories
The Failure Categories chart displays the result of Automatic Failure Analysis performed by Test Reporting & Analytics. This chart helps you to know which test failures are genuine and which are just noise. Automatic Failure Analysis classifies test failures into different categories like Product bugs, Automation bugs, Environment issue, No Defect, and To be investigated.
You can click the chart or a failure category to view the Test Listing in that particular category.

Failures by Folders
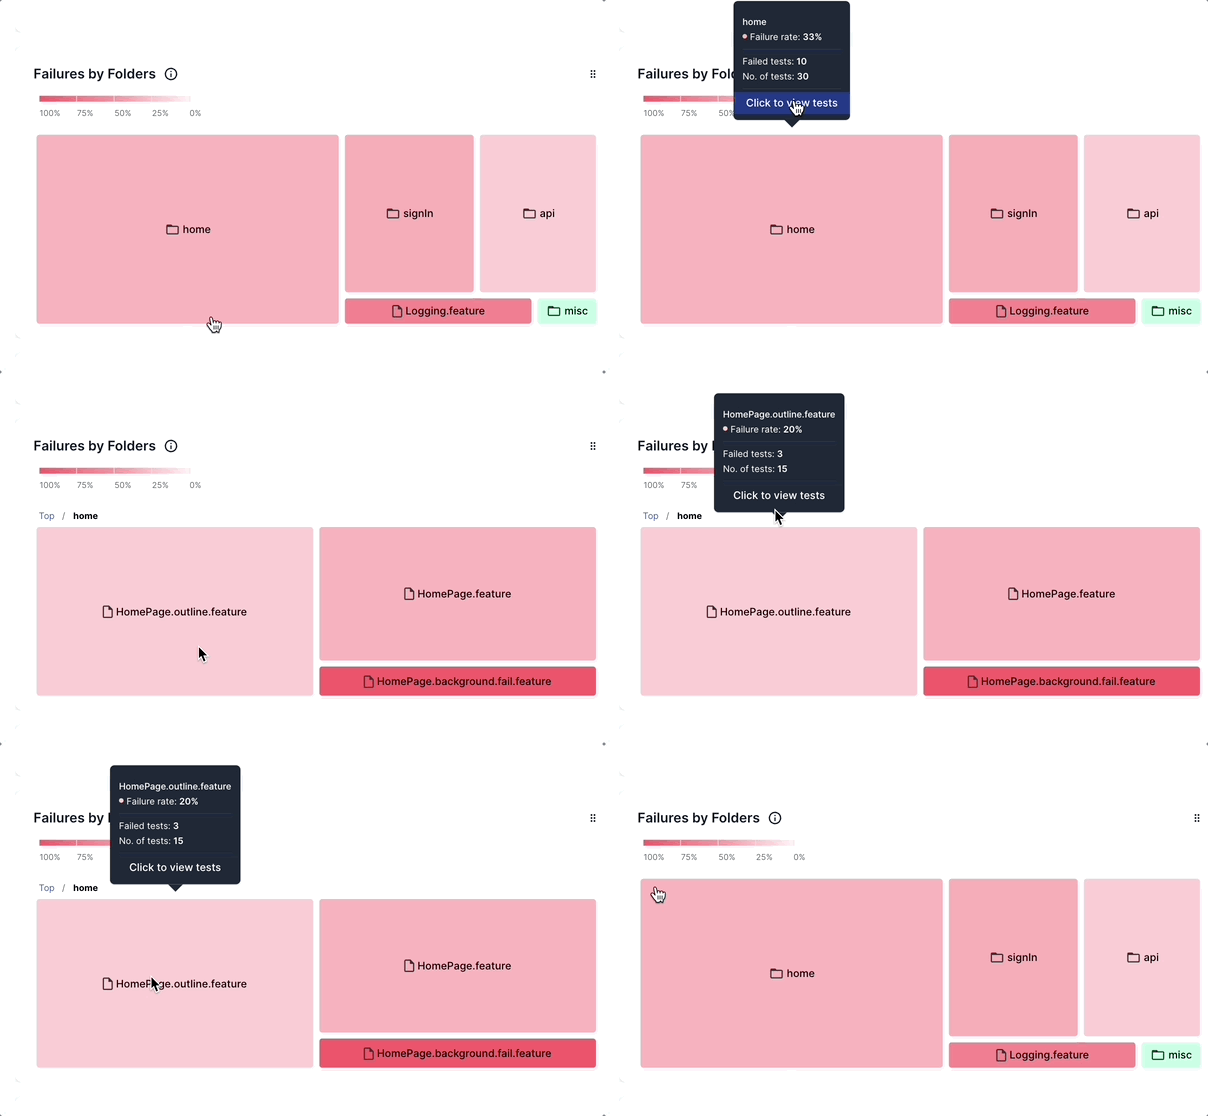
The Failures by Folders heatmap represents the failure rate of different modules in a test suite. You can hover your mouse over a folder to view the test statistics of that particular module. You can further click a folder to open subfolders and inspect a filtered view of those tests.
Apply filters on Build Insights
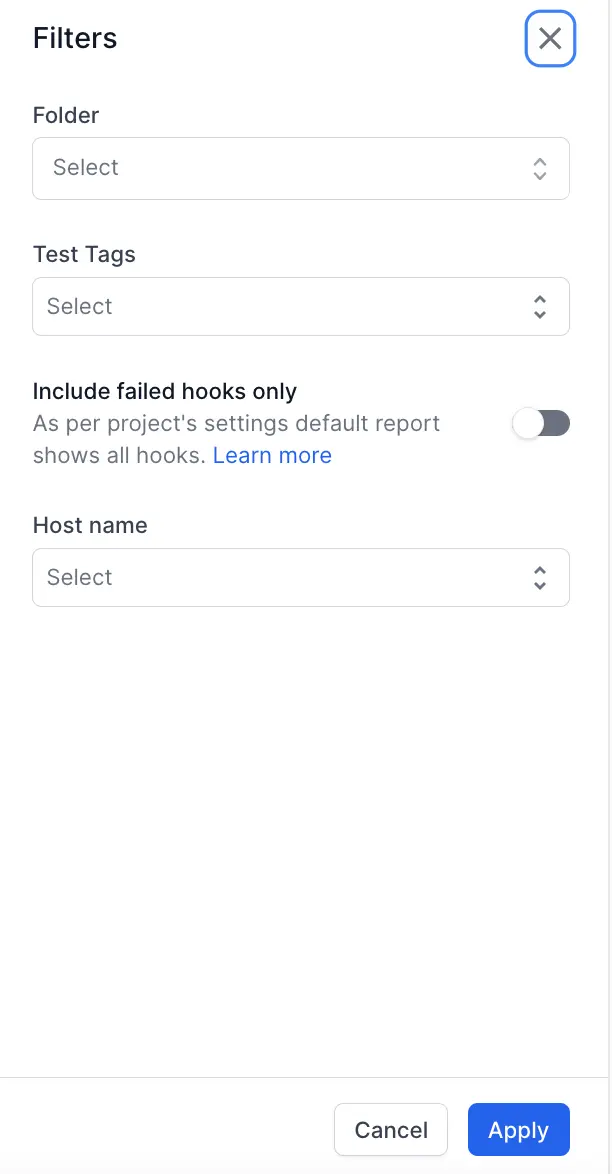
To filter the insights, click Filters in the top-right corner. A sidebar appears where you can select the desired filters.
Build Insights filters do not affect Run summary, Alerts, and Quality Gates widgets.
You can filter build insights using the following fields:
- Folder
- Test Tags
- Include Hooks
- Host name
After selecting the filters, click Apply to filter the insights based on your chosen criteria.
Customize the charts and widgets in Build Insights
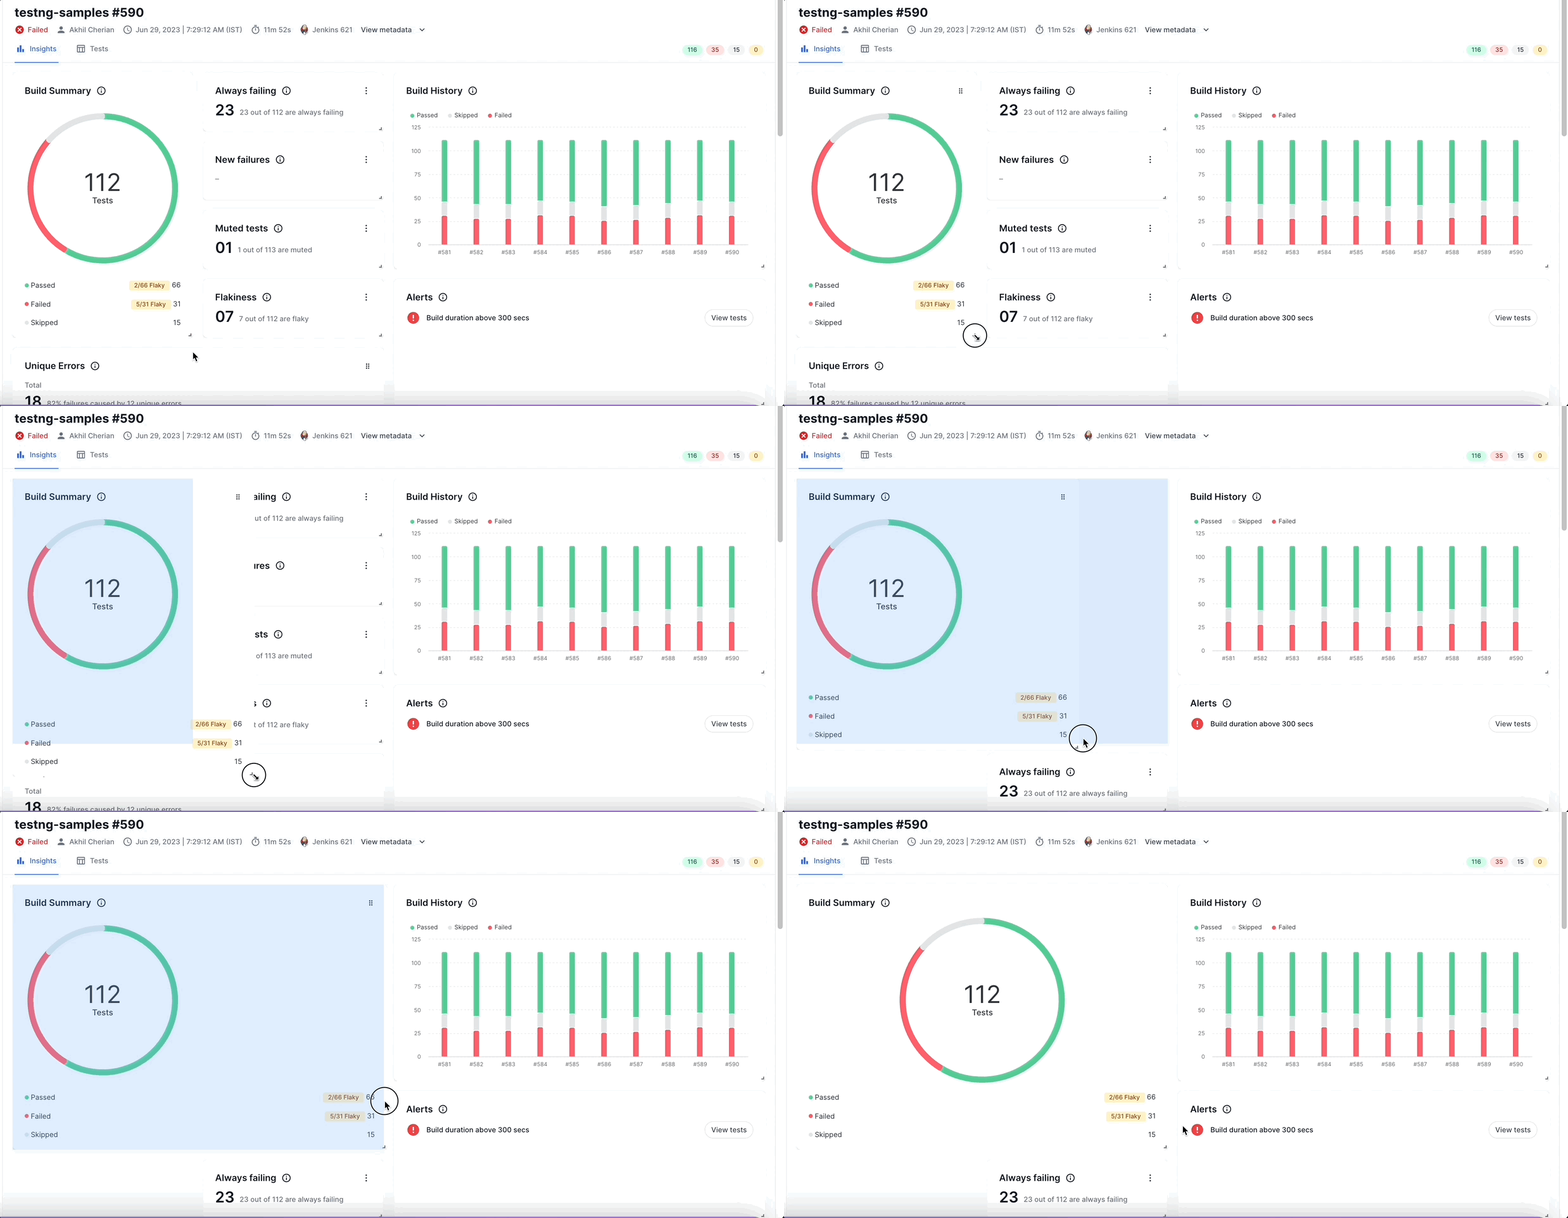
You can customize the charts and widgets in Build Insights by changing their dimensions or display order. These changes you make to the layout are saved in your browser.
Reorder the charts and widgets
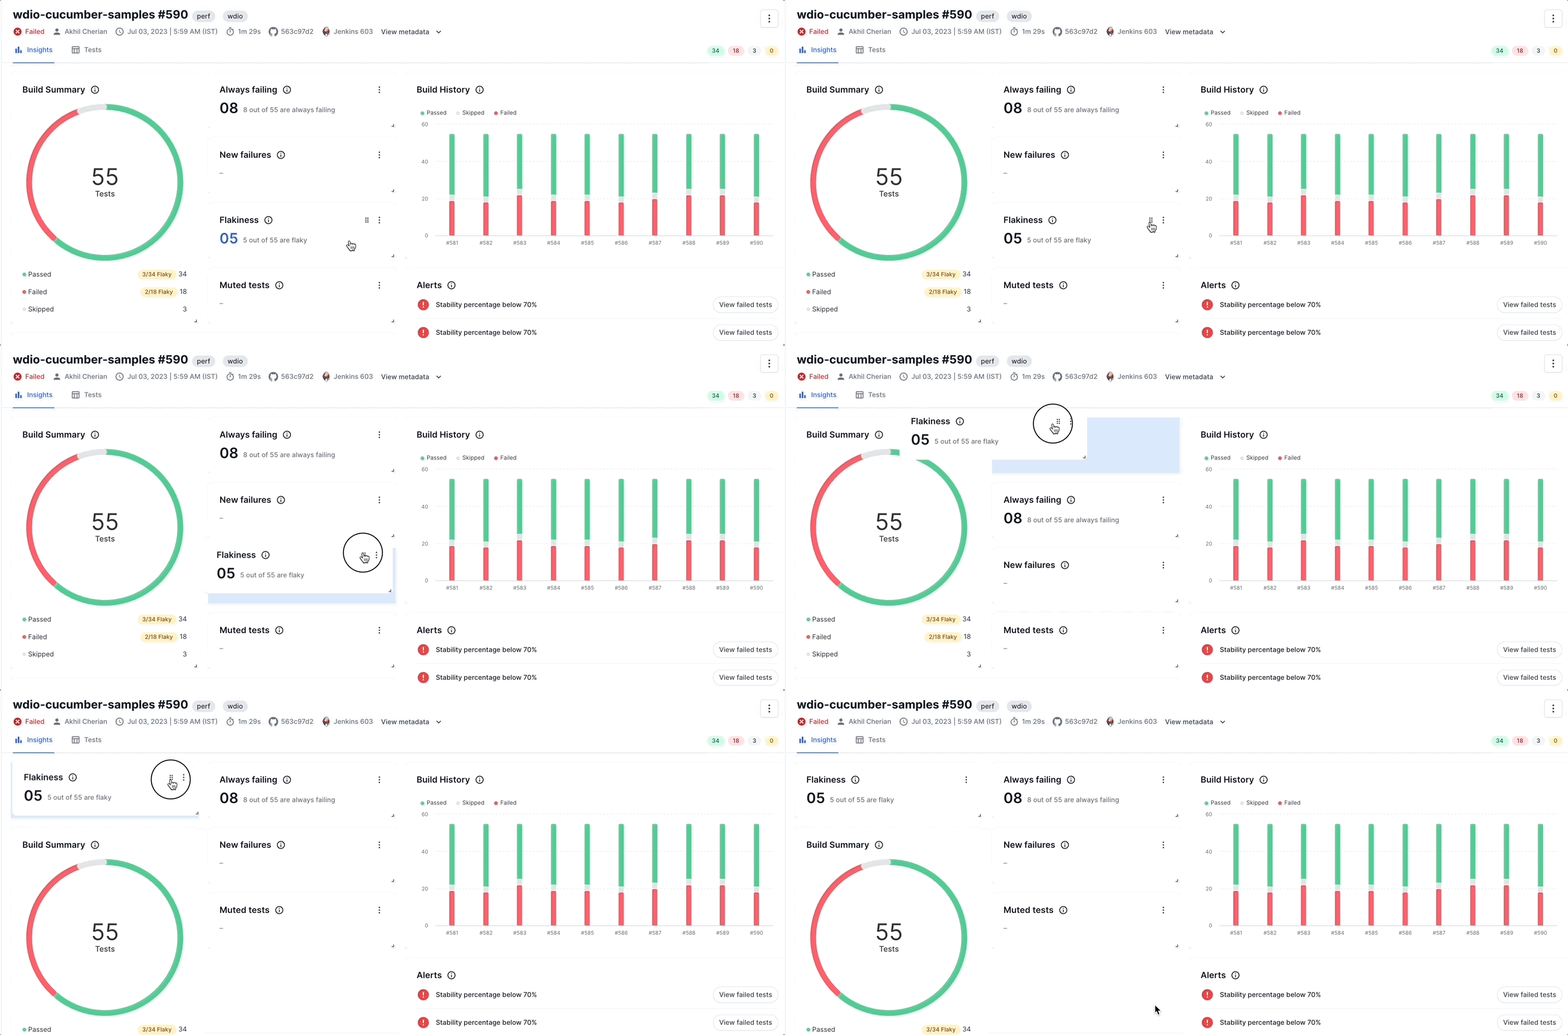
To reorder the charts and widgets,
- Hover your mouse over any chart in Build Insights.
- Click the candy bar menu and drag the chart to a different part of your screen.
Use this feature to reorder the charts based on the priorities of your test suite.
Resize the charts and widgets
To resize the charts and widgets, click the small arrow mark at the corner of a widget and drag it to the size you prefer.
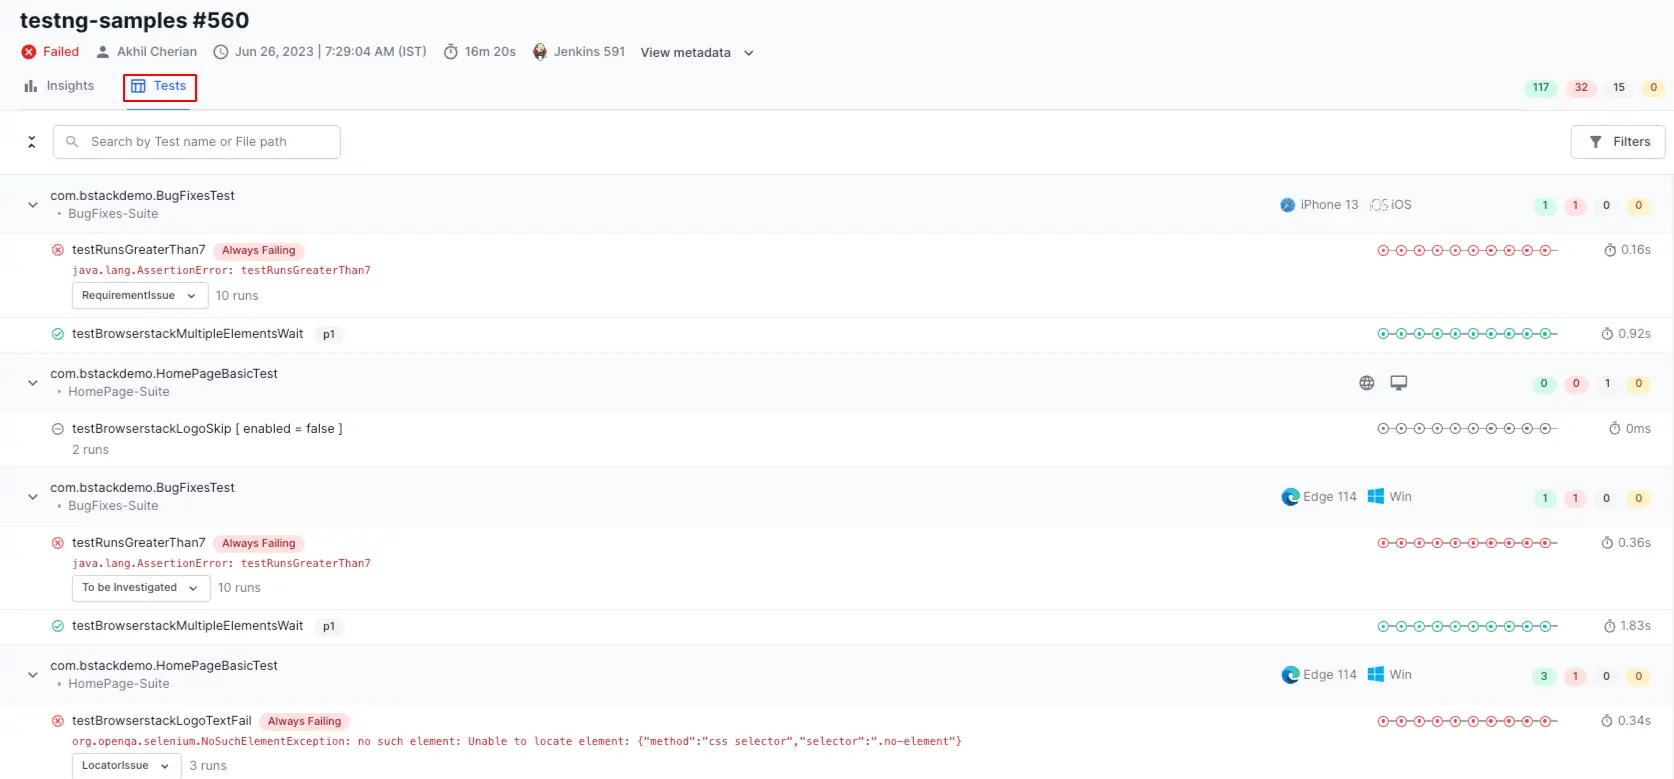
Tests tab
When you click the Tests tab, a Test Listing opens up in which you can view all the tests associated with the build run.
Test listing views
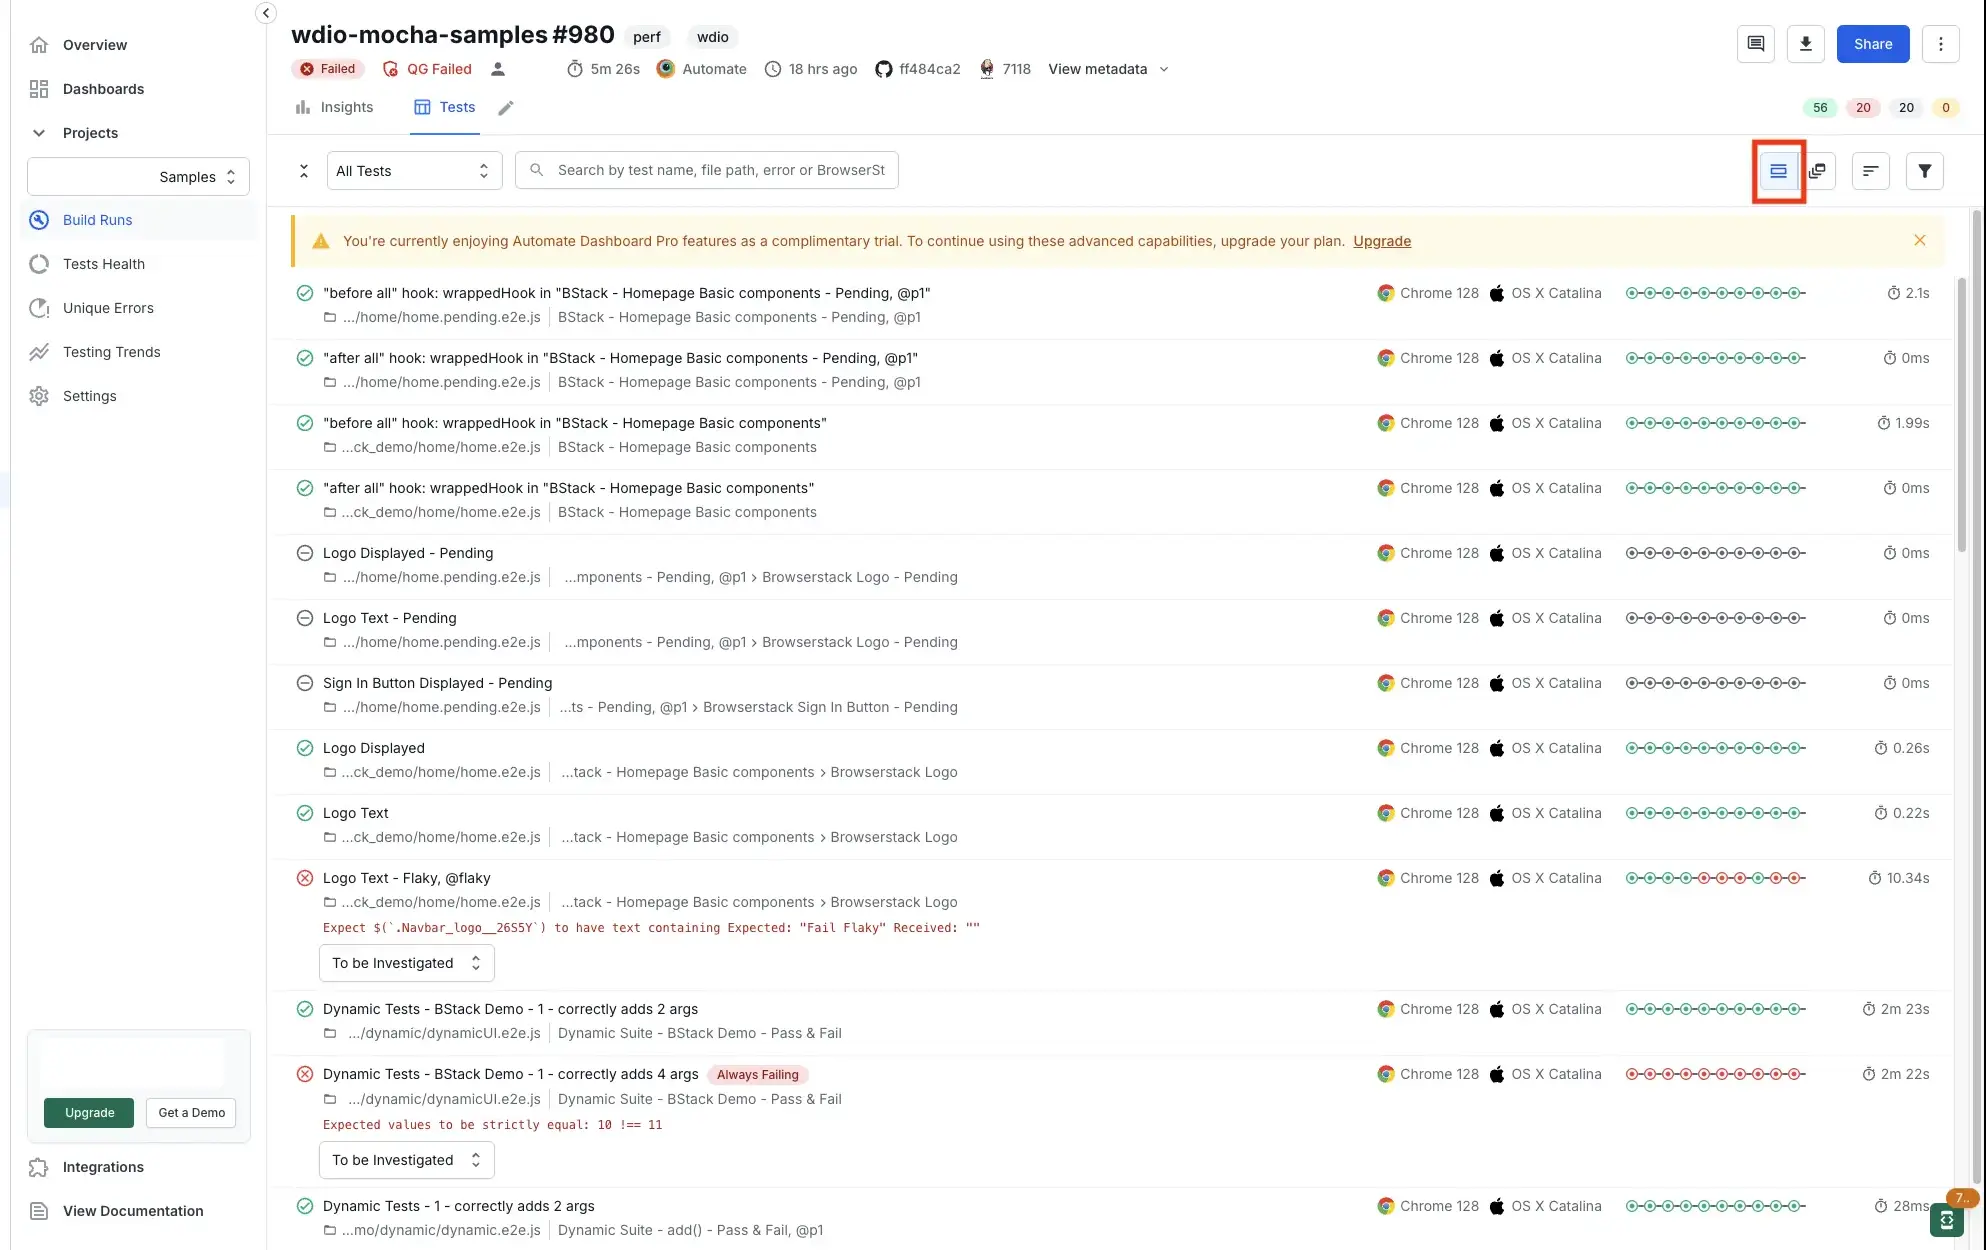
You can toggle the test layouts between two options:
-
List layout: All tests are listed one after another without any logical grouping.
-
Grouped layout: Tests are grouped in the Test Listing in a hierarchical order. This hierarchy depends on your test framework.
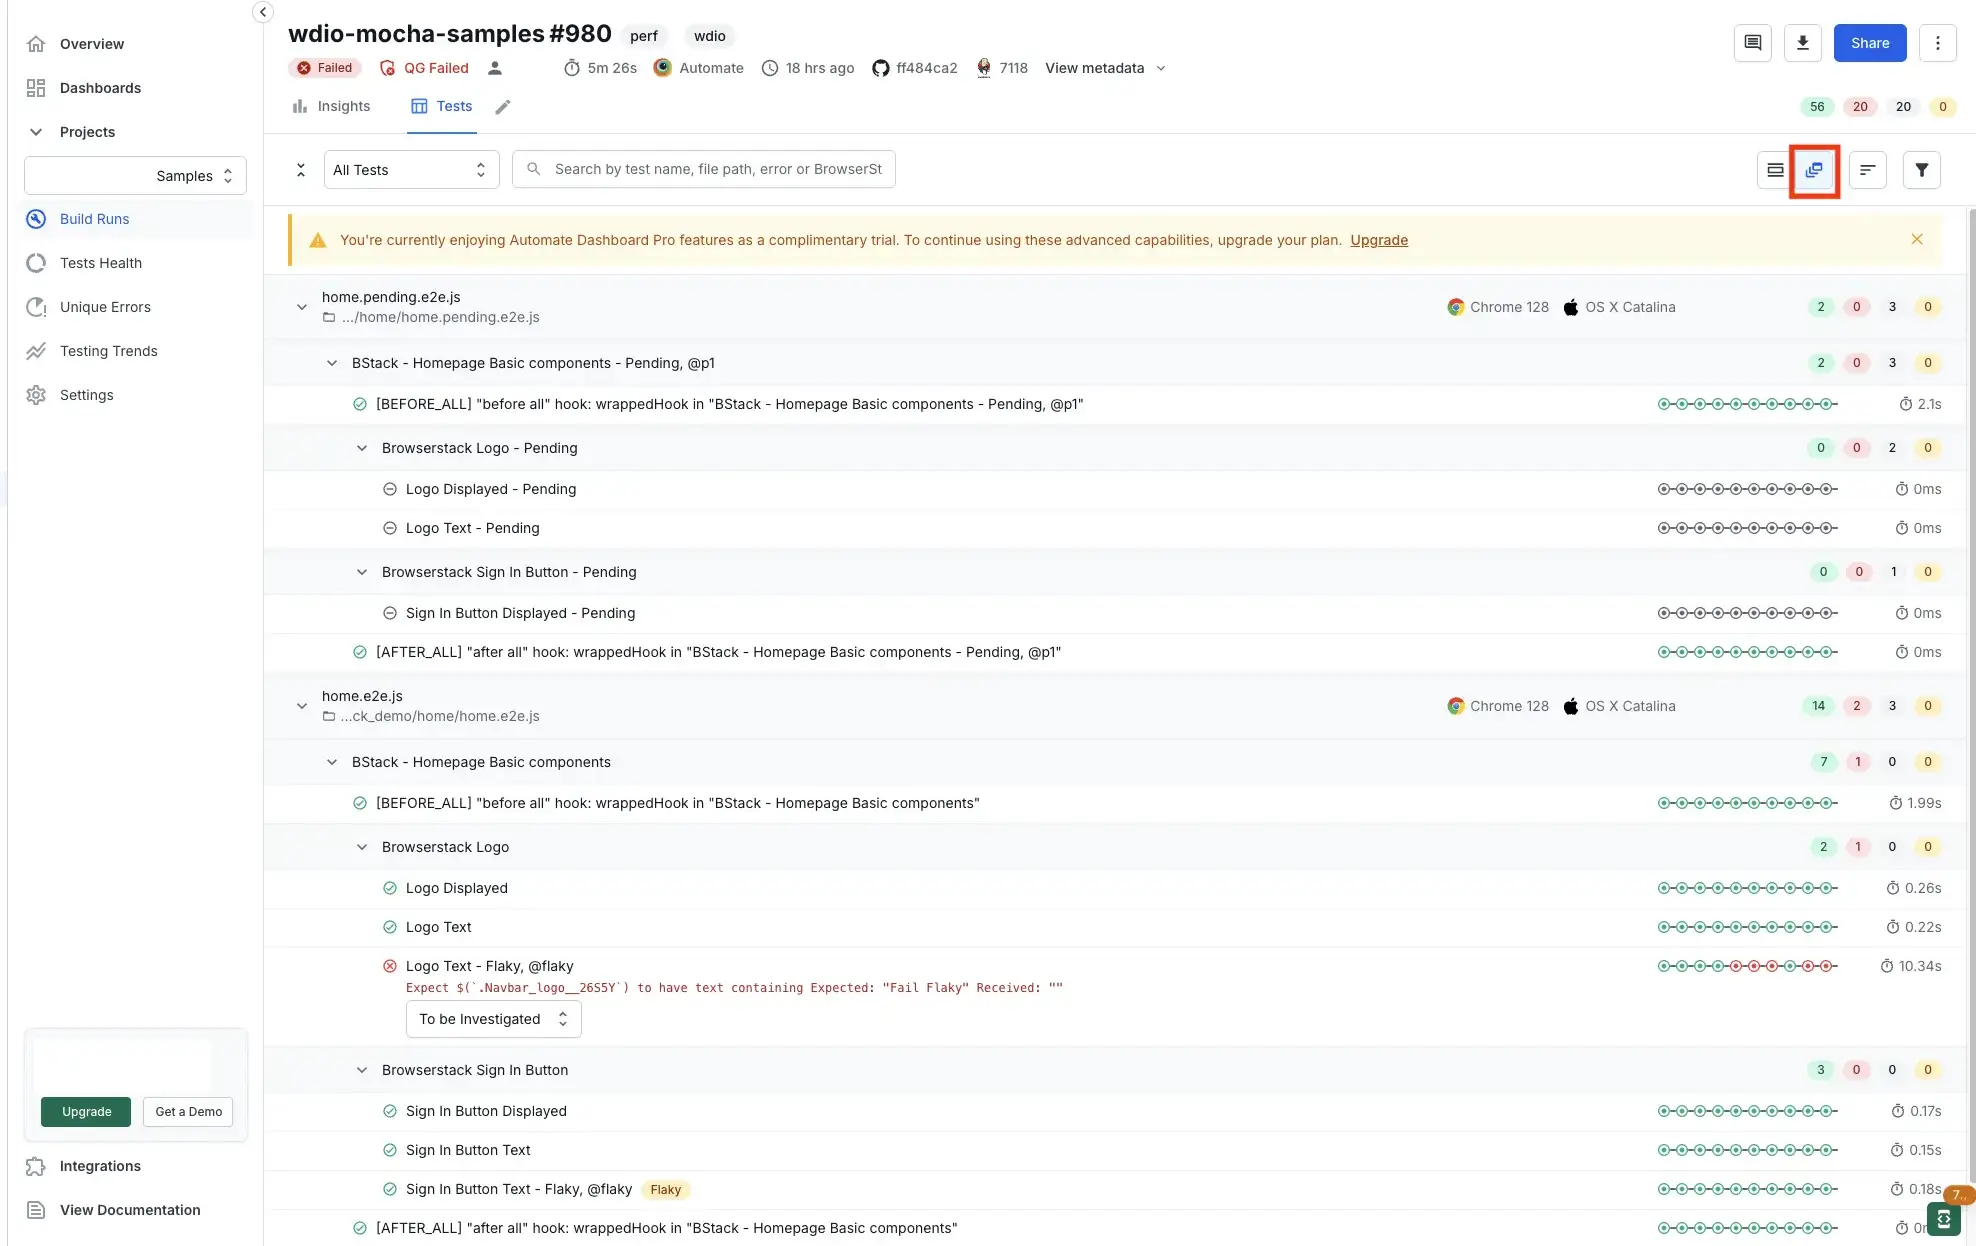
In the Mocha example in the following screenshot, the tests are organized into the following groups:
- File level: Test cases grouped by the browser-device combination.
- Describe level: Test cases for a feature.
- Nested describe level: Test cases for a sub-feature.
- Test case level: Individual test cases.
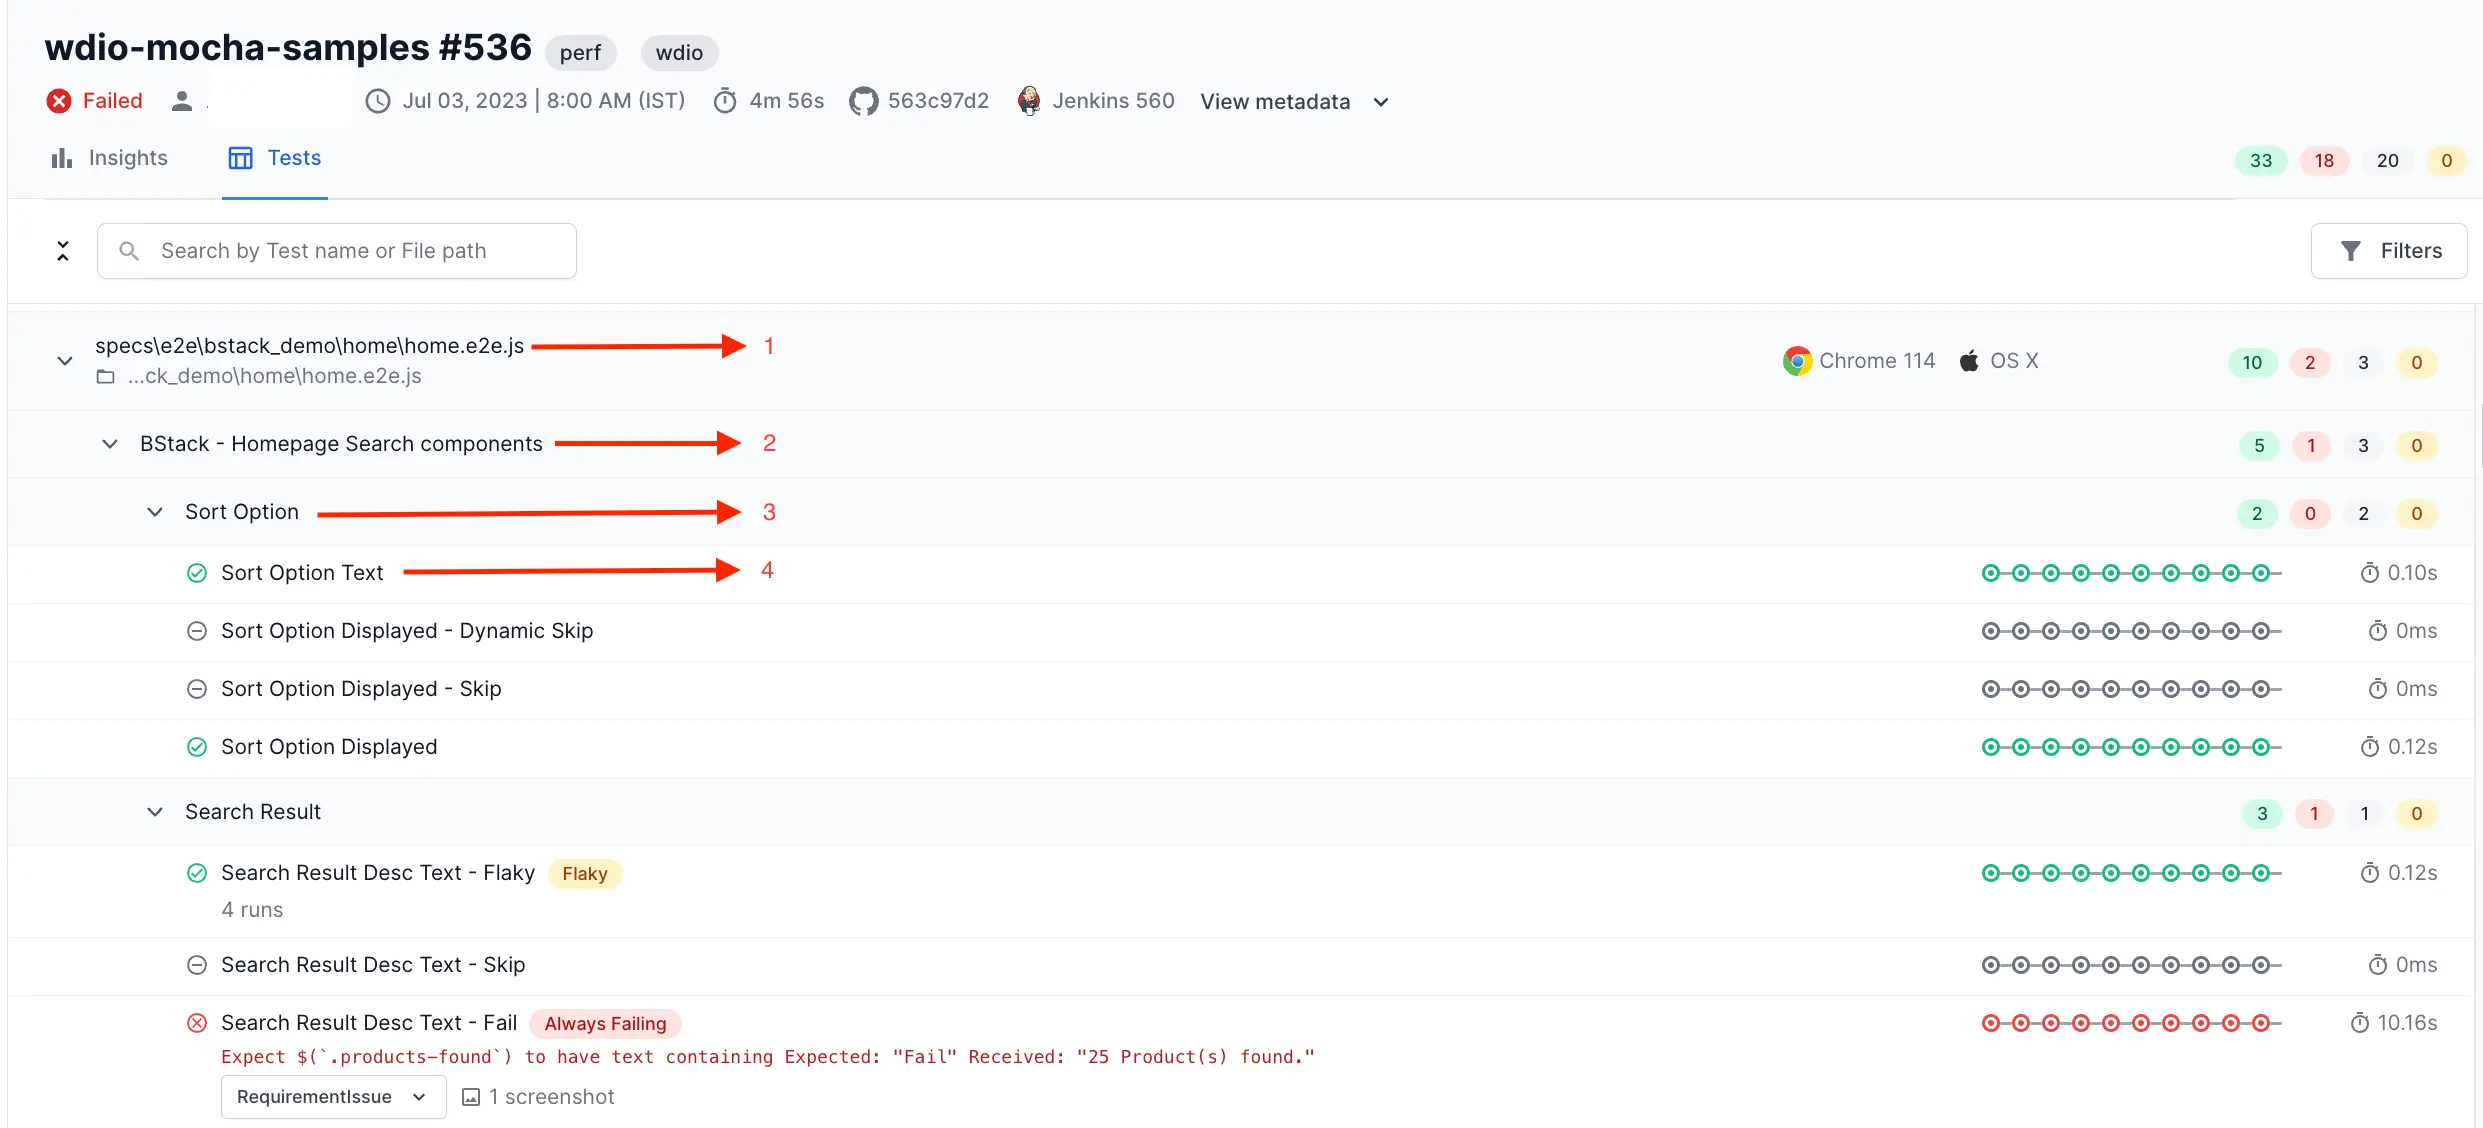
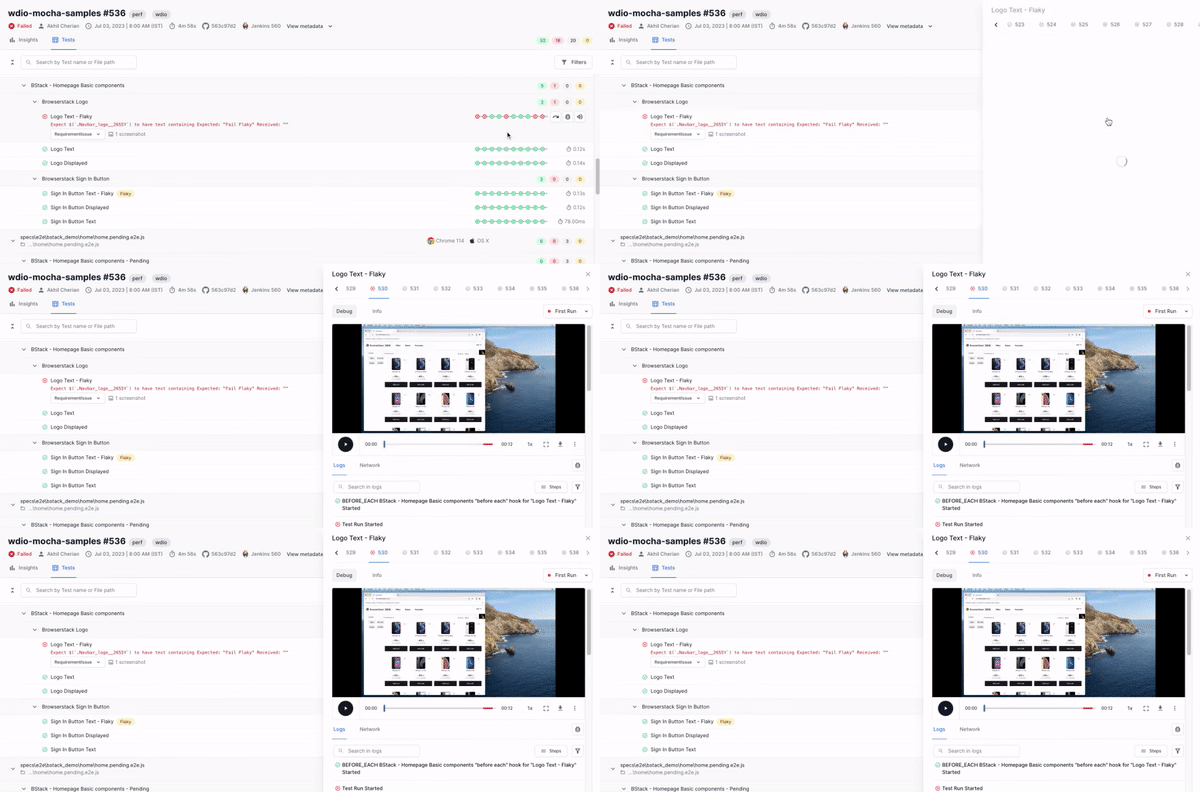
You can click an individual test case to open the Timeline Debugging view.
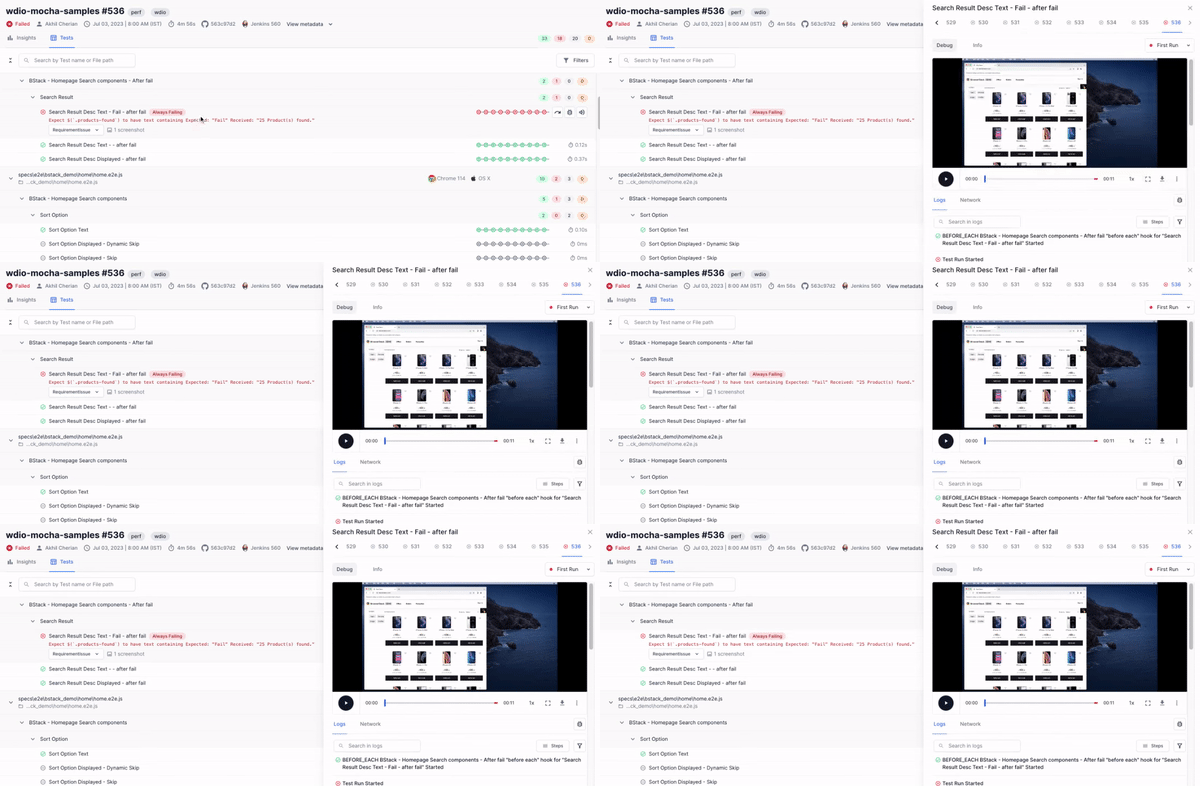
Accessibility tab in test listing
You can view a short summary of the accessibility issues in the Accessibility tab of the Test Listing. You can view the total number of accessibility issues along with a split of the severity of those issues. You can click View report to view the Accessibility Testing Dashboard.
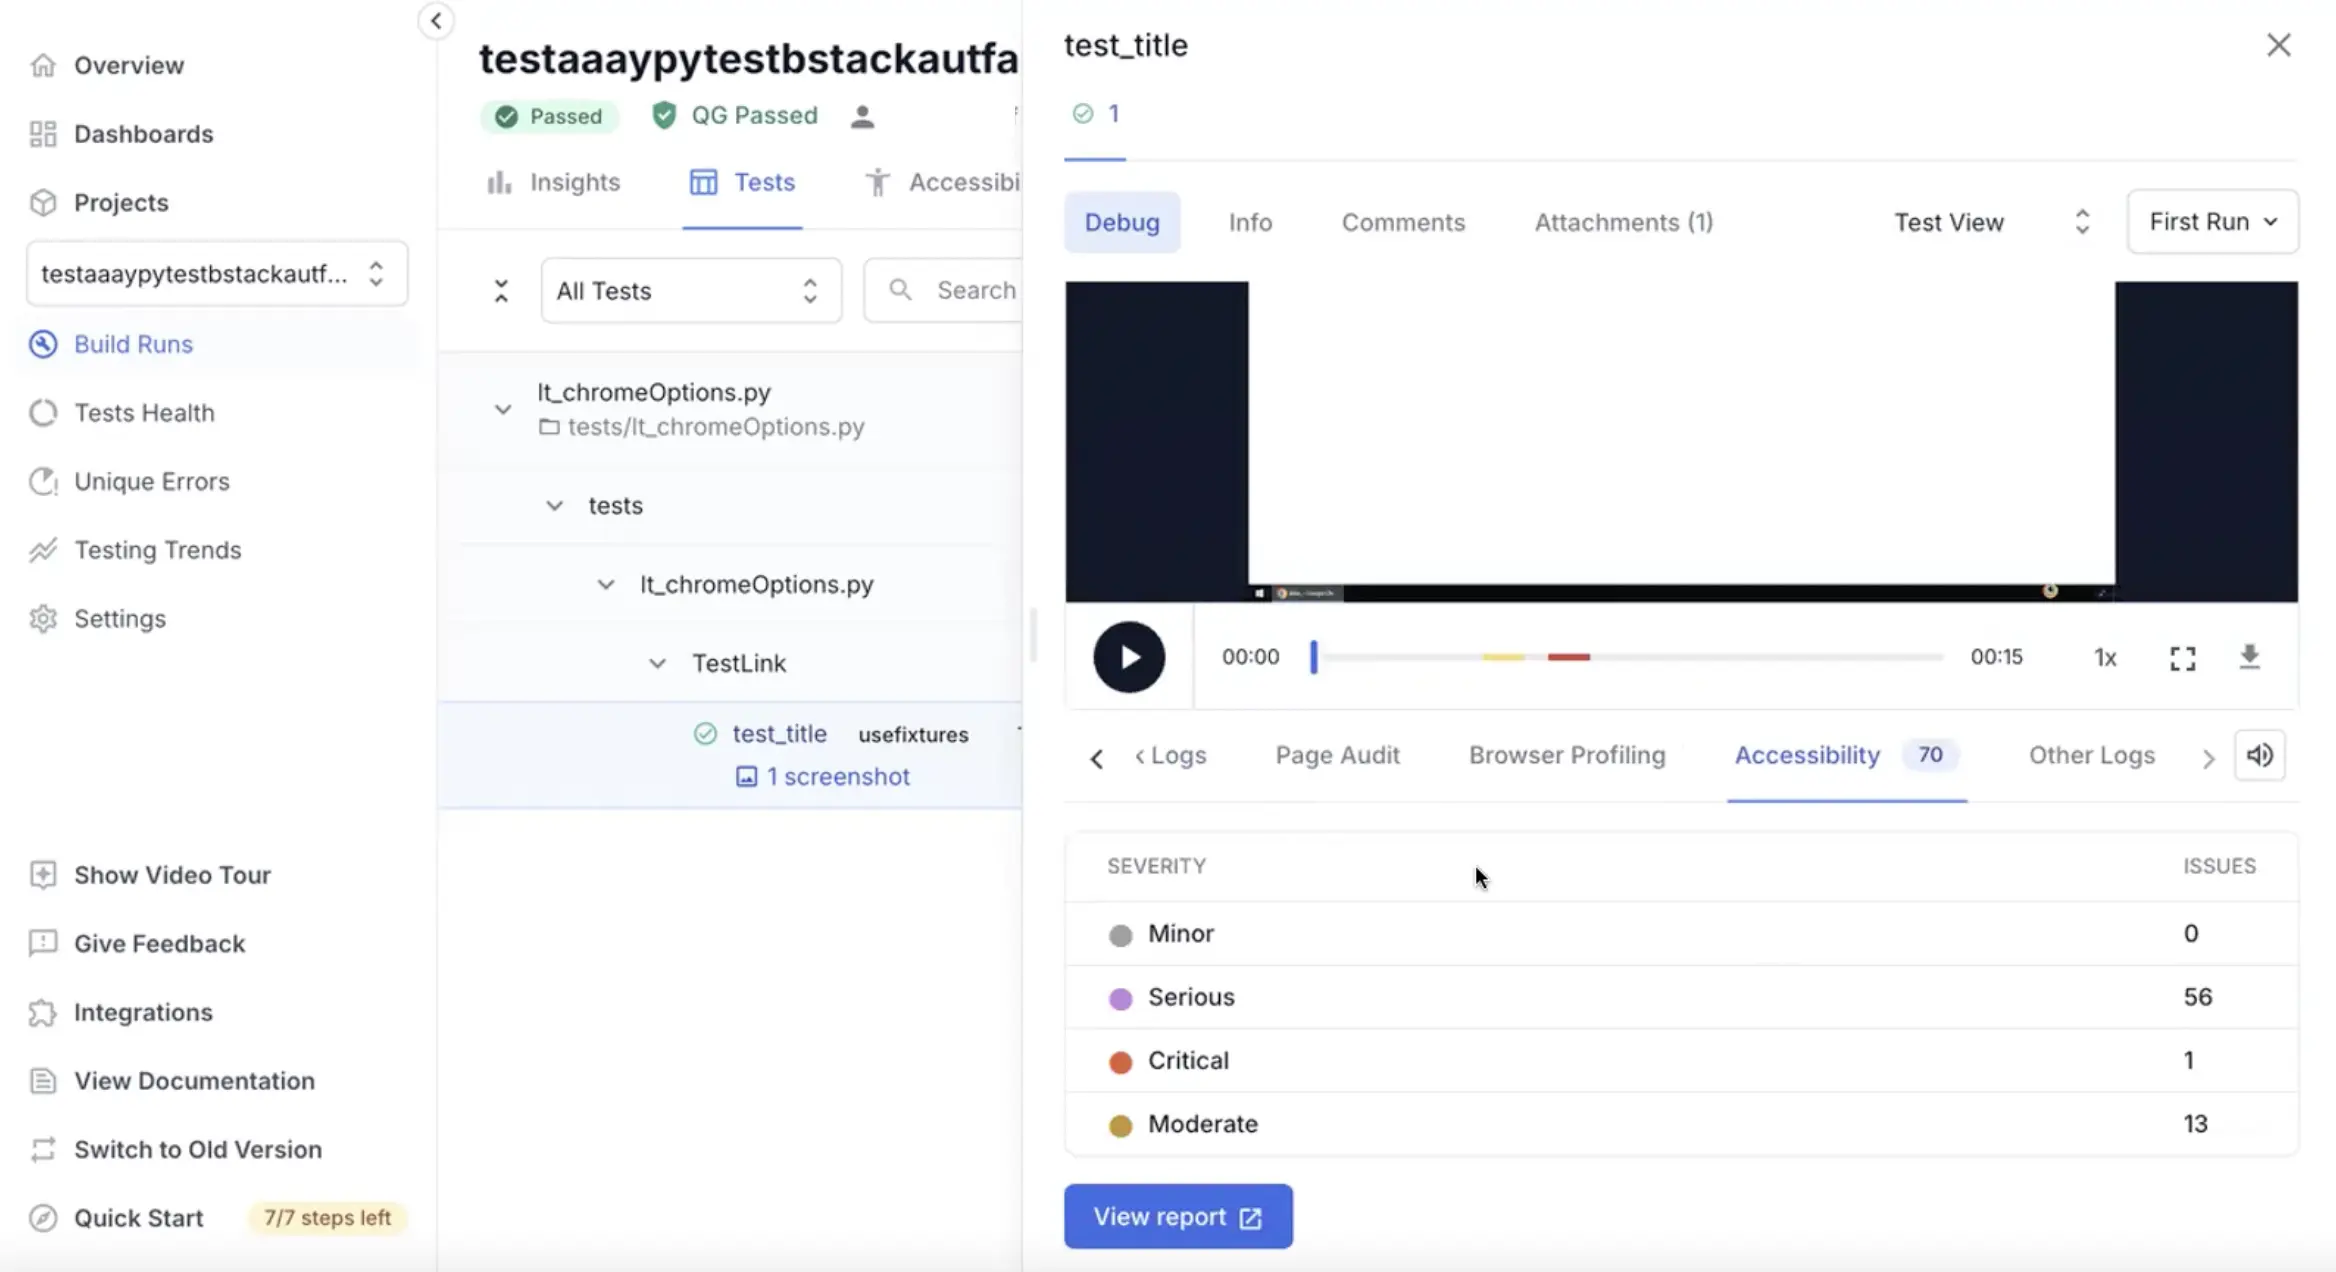
Search for a test or file path
You can use the search bar to find a particular test or file path.

Apply filters to tests
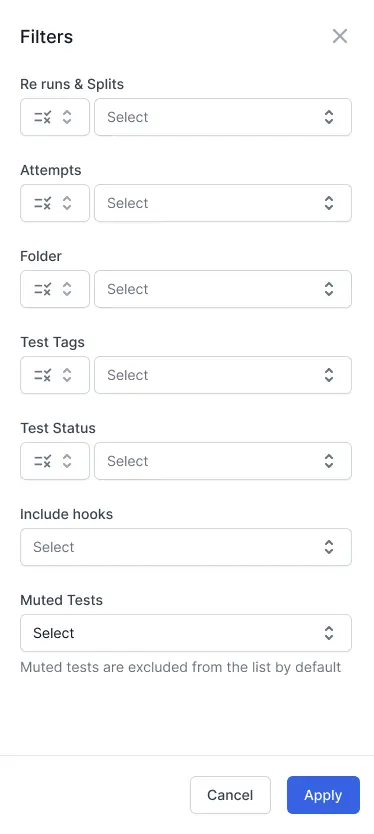
To filter the tests in a build, click the Filters button on the top-right corner. A sidebar appears where you can select the desired filters. After you’ve made your selections, click the Apply button to filter the tests based on your chosen criteria.
You can filter tests using the following fields:
-
Reruns & Splits: Allows you to view tests that are part of a particular rerun or split run.

-
Attempts: Allows you to view tests that have run for a definite number of attempts across multiple reruns or split runs. For example, using this filter, you can view the tests that ran four times (could be framework level rerun, CI rerun, etc across multiple reruns or split runs), and what happened to those tests.

- Folder: Allows you to view tests that are located in a specific folder.
- Test Tags: Allows you to view tests that have specific tags associated with them.
- Test Status: Allows you to view tests based on their status (e.g., passed, failed, skipped).
- Include Hooks: Allows you to view tests that have specific hooks associated with them.
- Flaky Tests: Allows you to view tests that have been marked as flaky.
- Muted Tests: Allows you to view tests that have been muted.
- Always Failing: Allows you to view tests that have consistently failed across multiple runs.
- Newly Failed Tests: Allows you to view tests that have failed for the first time in the current build.
- Performance Anomalies: Allows you to view tests that have exhibited unusual performance characteristics.
- Host Name: Allows you to view tests that were run on specific host machines.
- Device: Allows you to view tests that were run on specific devices.
- OS: Allows you to view tests that were run on specific operating systems.
- Browser: Allows you to view tests that were run on specific browsers.
- Failure Categories Group: Allows you to view tests that belong to specific failure categories groups.
- Failure Categories: Allows you to view tests that fall under specific failure categories.
- Defect Status: Allows you to view tests based on their defect status (e.g., open, closed, in progress).
- Custom Fields: Allows you to filter tests based on custom metadata fields that you have set.
Sort tests in test listing
You can sort the tests in your test listing in ascending or descending order according to any of the following criteria:
- Execution Order
- Filename
- Duration
- Status
- Platform
To sort tests using the UI, click the sort button near the top-right corner of the test listing. A sidebar appears in which you can select the criteria to sort.
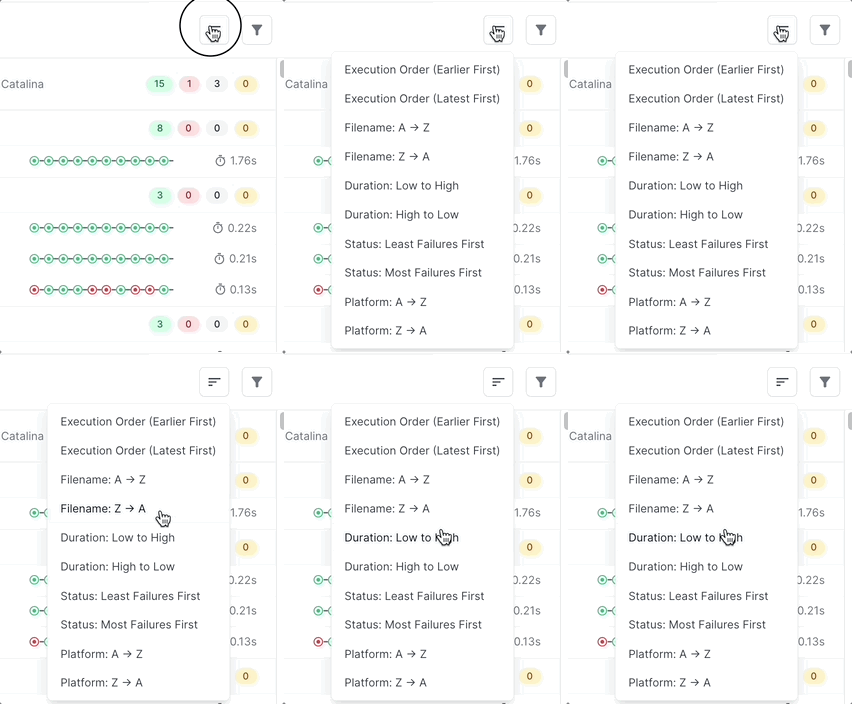
Further, you can save the sort setting in a view by clicking Save as new view and creating a new view. Refer to the custom views doc for more information on views.
To sort tests while using the get-tests external API, add the parameters sort and order in your request. The sort parameter is used to specify the criterion by which the tests have to be sorted. The order parameter is used to sort tests in ascending or descending order.
Refer the get-tests API documentation for more details.
View test execution history
You can view a timeline chart that illustrates the multiple executions of a test. Red, green, and grey circles represent a failed, passed, or skipped test respectively.
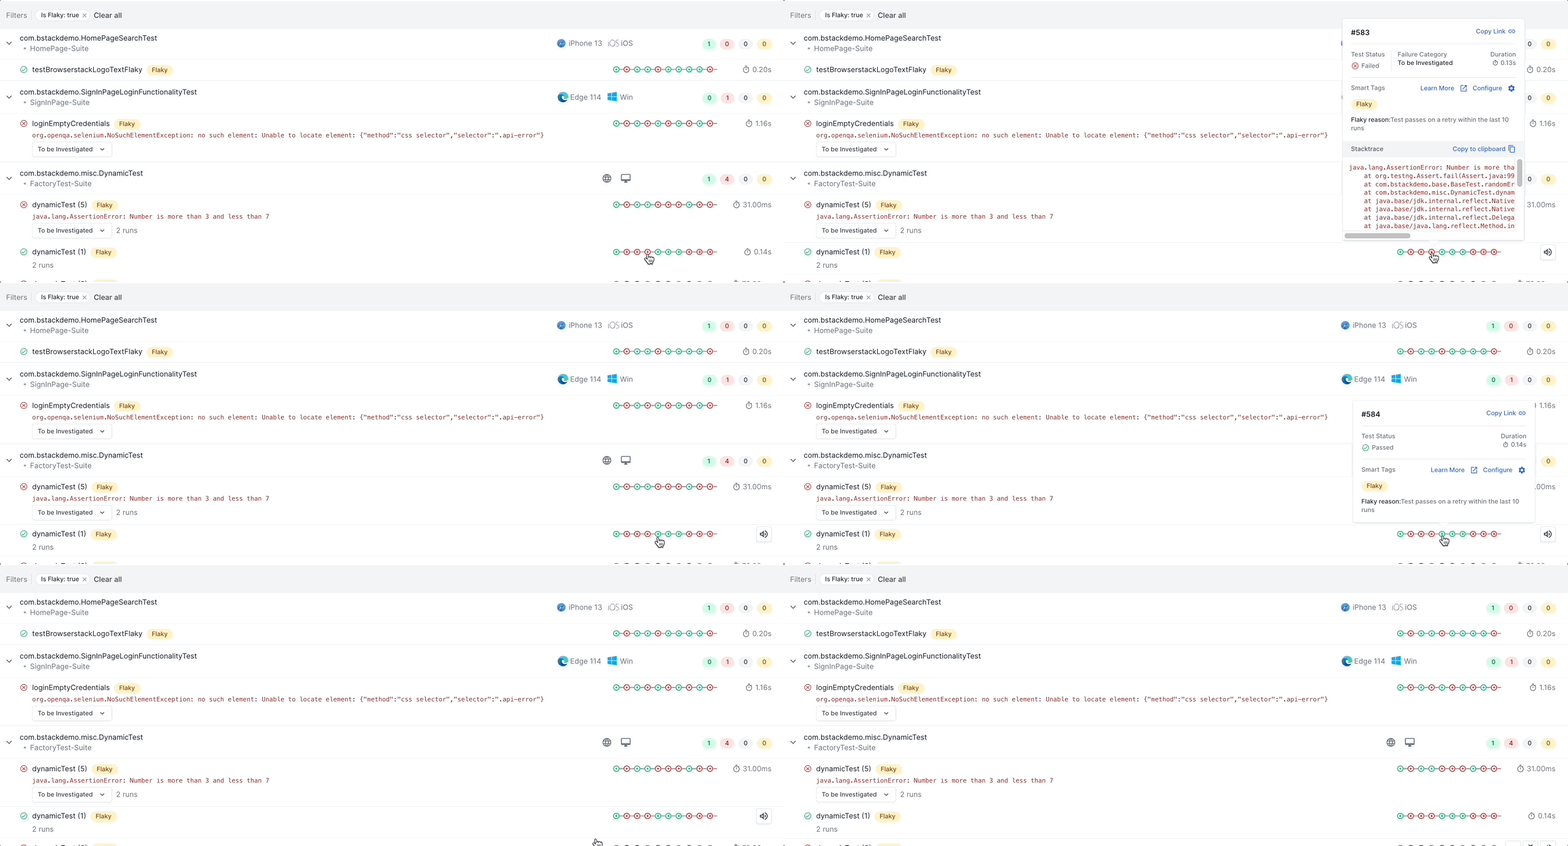
If you click the chart or a test, you can inspect more details in the Timeline Debugging view. In the Timeline Debugging view, you can view and debug your test runs with every type of log in one place. You can also travel back in time to see how the same test fared in previous executions to aid your debugging efforts.
Report a Jira bug, Re-run, mute, or unmute tests
You can hover over a test to view buttons to re-run a test, report a Jira bug, and mute/unmute a test.

Accessibility tab
The Accessibility tab in Build Insights provides a summary of the accessibility issues detected in the build run. It includes the number of accessibility issues, the severity of those issues, and a link to view more details. For more information, you can click View report.
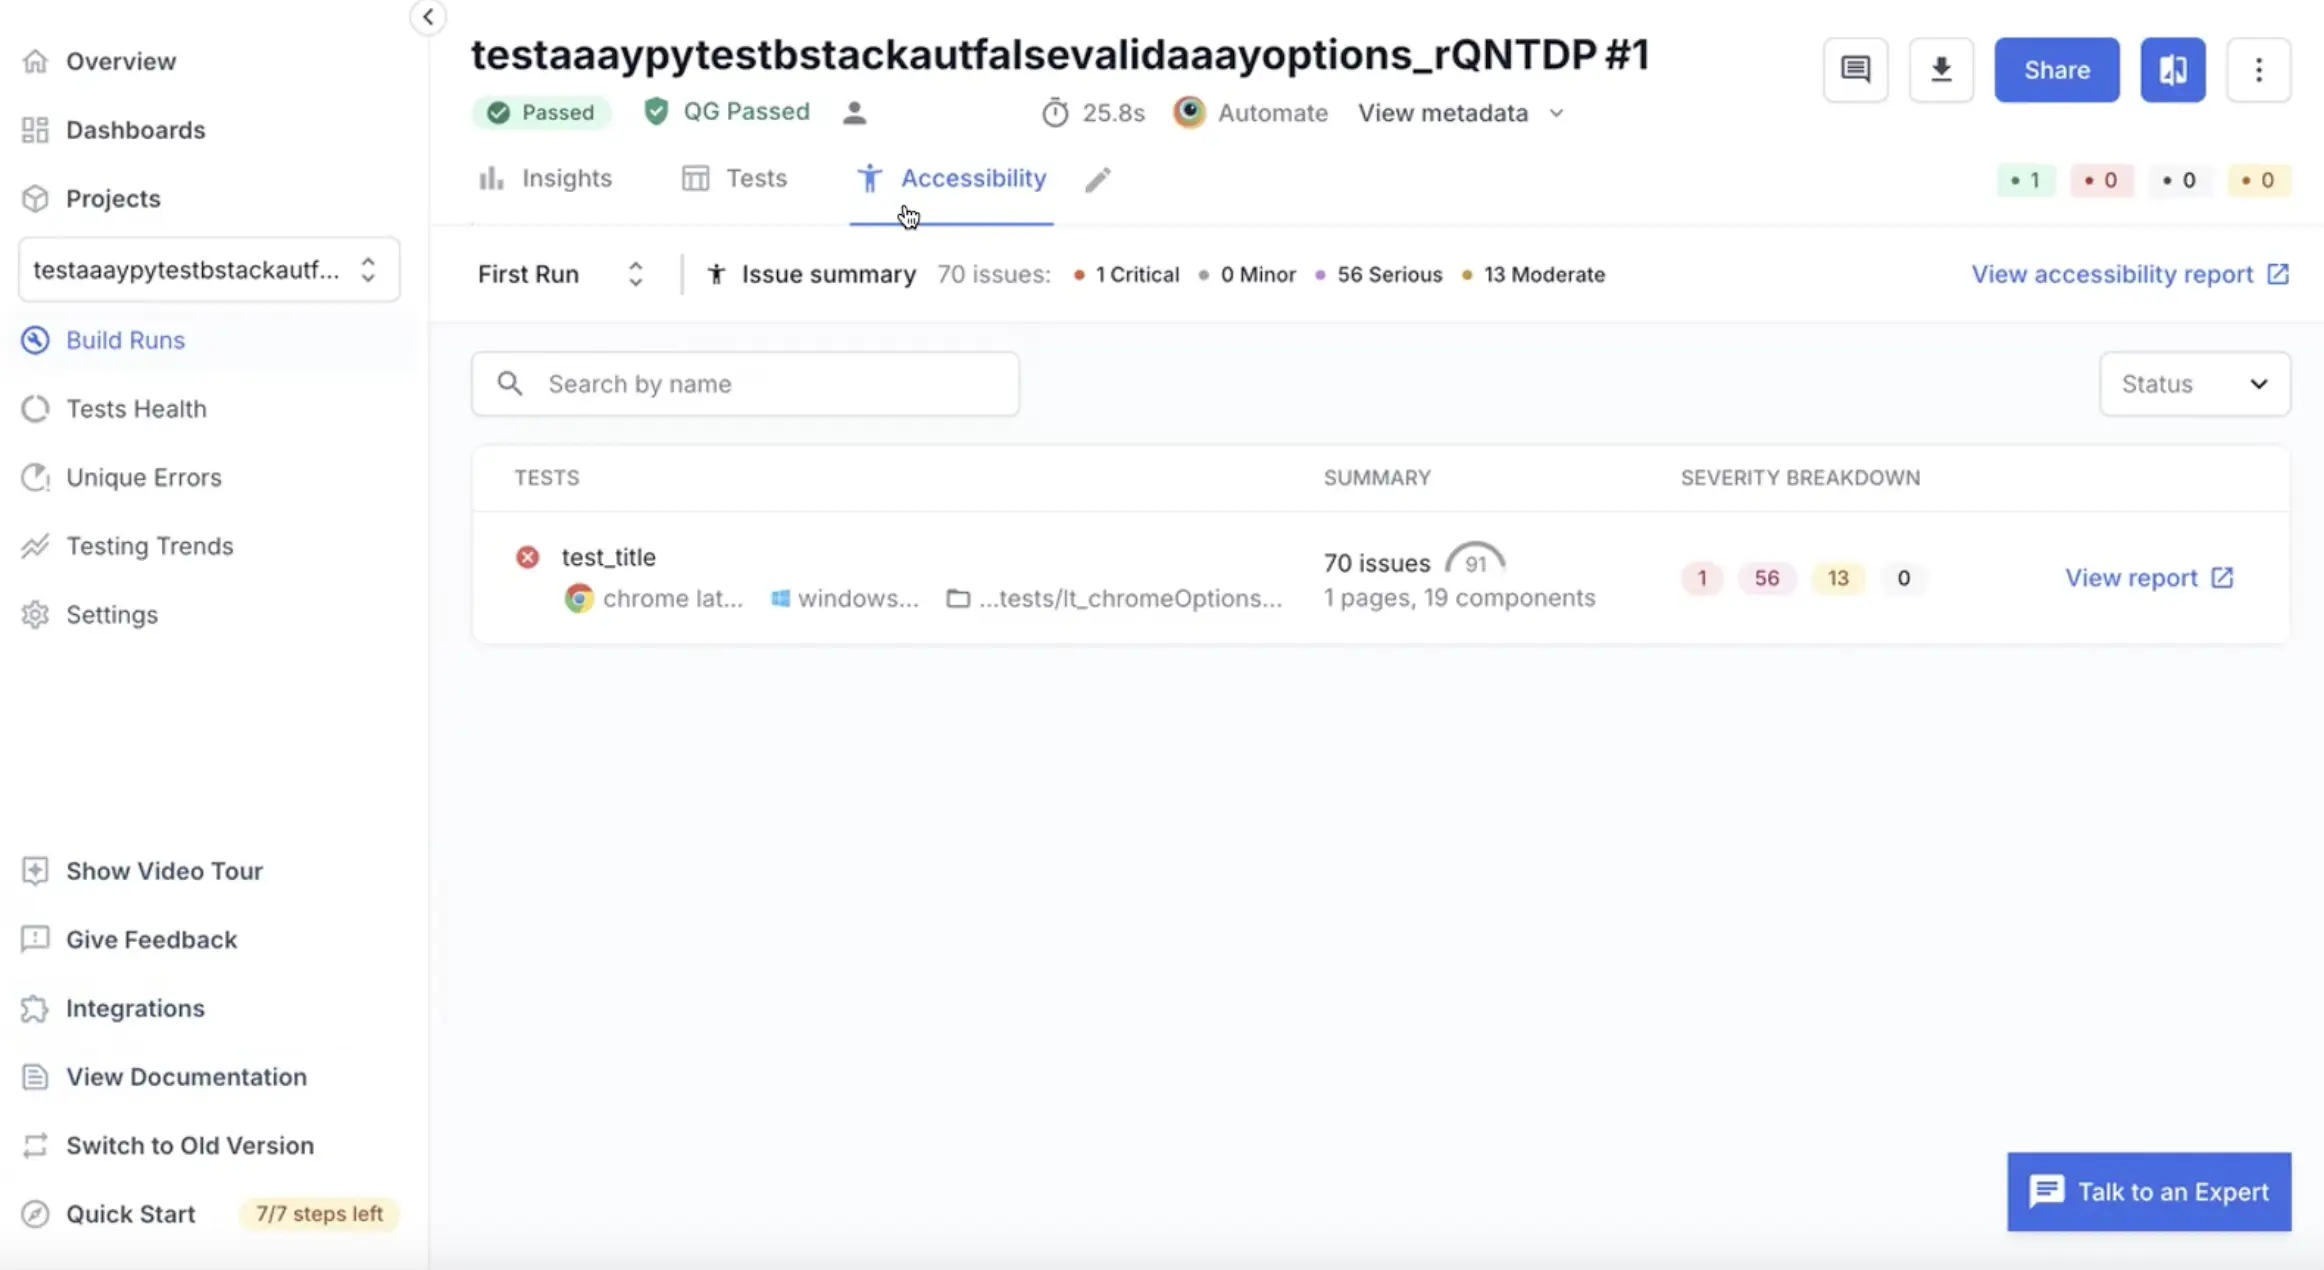
You can read more details about this tab in the Accessibility Testing doc on the Tests tab of Automated reports.
You can view a short summary of the issue in Issue summary. For further details, click View accessibility report to view a build-level overview.
Select default tab or reorder
You can choose whether Insights or Tests tab opens by default when you click a build from Build Runs. You can also select the order of these tabs.
For running builds, the default tab is always Tests irrespective of the default tab chosen.
On the page to view the details of a build run, follow these steps to select the default tab and reorder them:
- Click the Edit icon next to the tabs.

- In Manage Tabs, you can select the default tab from a menu.

- Reorder the Tab order by dragging an option to the required position.
- Click Save.
Explore Build Insights and Test Listing in the demo sandbox
You can explore Build Insights and Test Listing in the Test Reporting & Analytics demo sandbox.
We're sorry to hear that. Please share your feedback so we can do better
Contact our Support team for immediate help while we work on improving our docs.
We're continuously improving our docs. We'd love to know what you liked
We're sorry to hear that. Please share your feedback so we can do better
Contact our Support team for immediate help while we work on improving our docs.
We're continuously improving our docs. We'd love to know what you liked
Thank you for your valuable feedback!