Integrate other tools with Test Reporting & Analytics
Integrate external tools.
The following docs will help you with integrating commonly used tools with Test Reporting & Analytics to simplify your testing experience.
View server-side application error logs & stack traces by integrating log collectors like Filebeat, Logstash, Promtail, Fluentd, or Winston.
With automatic integration with SCM tools like GitHub, GitLab, and Bitbucket, you can view the code changes associated with a build directly on Test Reporting & Analytics.
When you notice a bug or issue in your test suite, you can create a bug or ticket on Jira or Asana directly from Test Reporting & Analytics with auto-populated Metadata.
Do more with Test Reporting & Analytics by integrating other tools
QA teams often have to switch between several tools for their daily work. This process can become tedious and inefficient in the long term. You can reduce the need to work with multiple tools by integrating your commonly used tools with Test Reporting & Analytics.
By integrating other tools, you can unlock many features in Test Reporting & Analytics. These features improve your testing workflow and efficiency.
You can activate the following features in Test Reporting & Analytics by integrating other tools:
-
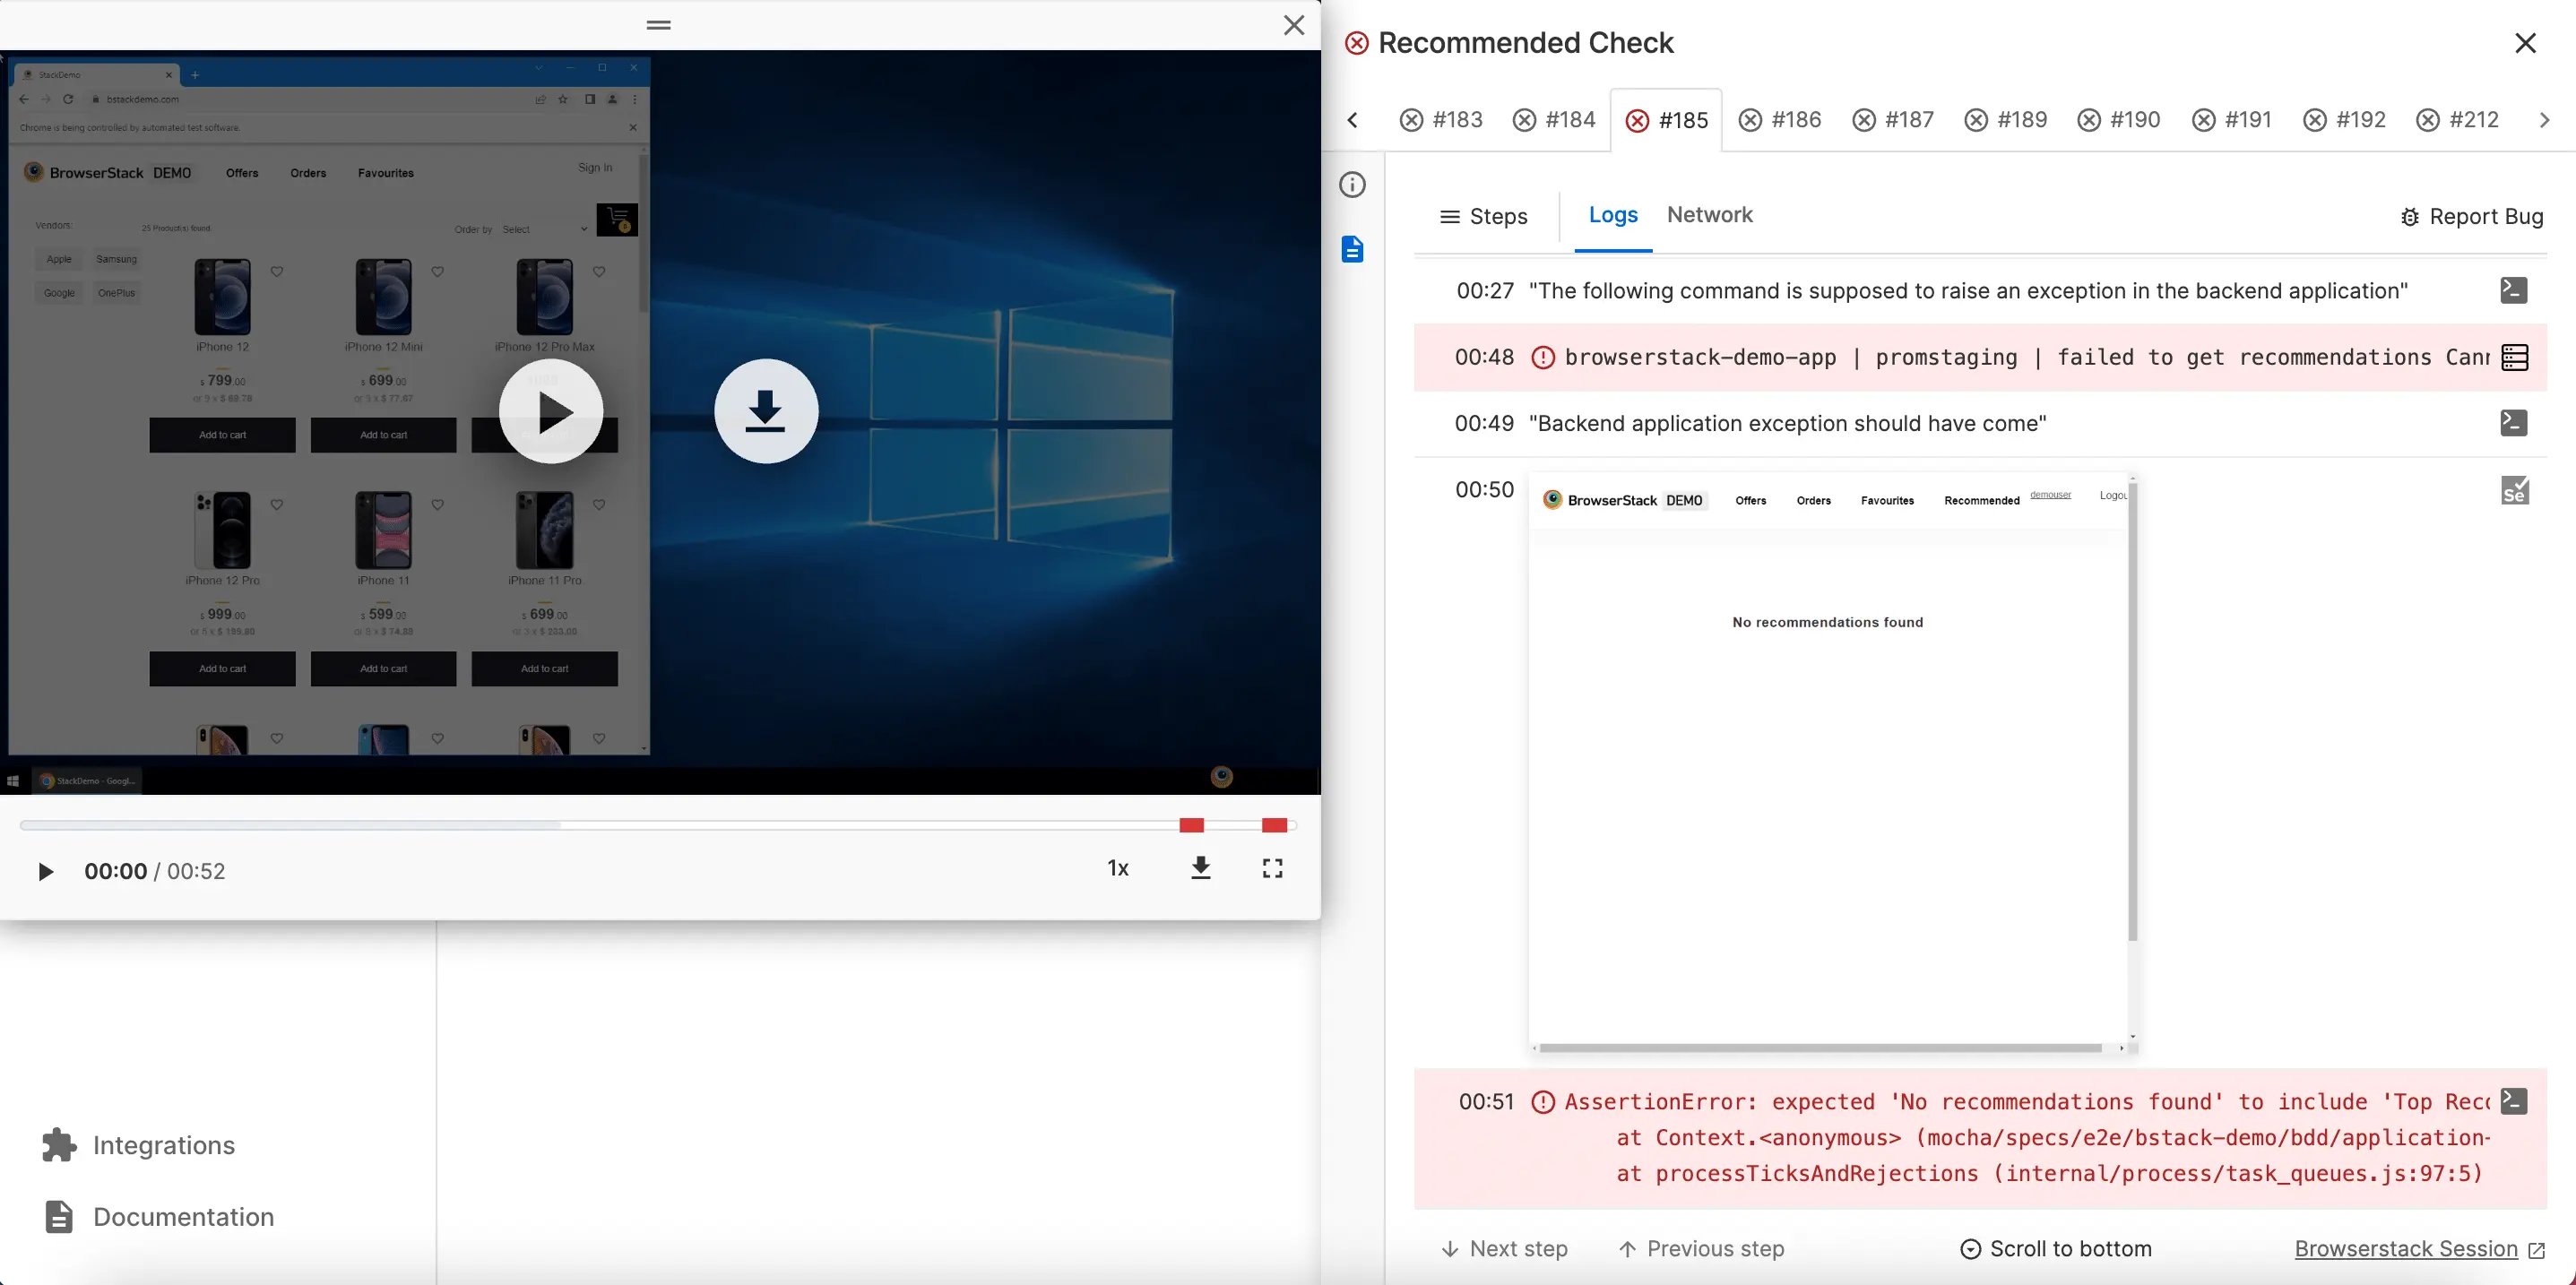
View backend application logs: Standard logs from testing frameworks record only the client-side errors. In Test Reporting & Analytics, you can also include application logs such that you can see both client-side and server-side logs in one place. With errors and stack traces from both sides available on Test Reporting & Analytics, you can easily investigate what went wrong without the need to manually pull up server logs or cross-check with multiple tools. This convenient method makes debugging a lot easier.
To include application logs, you need to integrate an application log collector like Filebeat, Logstash, Promtail, Fluentd, or Winston. Learn more about integrating application log collectors here.
-
View source code: You can view the test code on Test Reporting & Analytics without switching to any other tools. This feature helps you know the expected flow of the test case right from Test Reporting & Analytics. You can also click the commit associated with a build to navigate to your SCM tool to inspect what was changed in the code.
Learn more about viewing source code and code changes from Test Reporting & Analytics here. -
Re-run tests: The ability to re-run tests removes the dependencies on other teams and speeds up the workflow for SDETs. After debugging and fixing a build, SDETs can re-run the build from Test Reporting & Analytics without requesting help from the DevOps team. In Test Reporting & Analytics, you can re-run the tests and automatically map them with previous runs of the same test case.
You can integrate Jenkins and Azure Pipelines with Test Reporting & Analytics to activate the re-run feature. Learn more about re-running tests here.
-
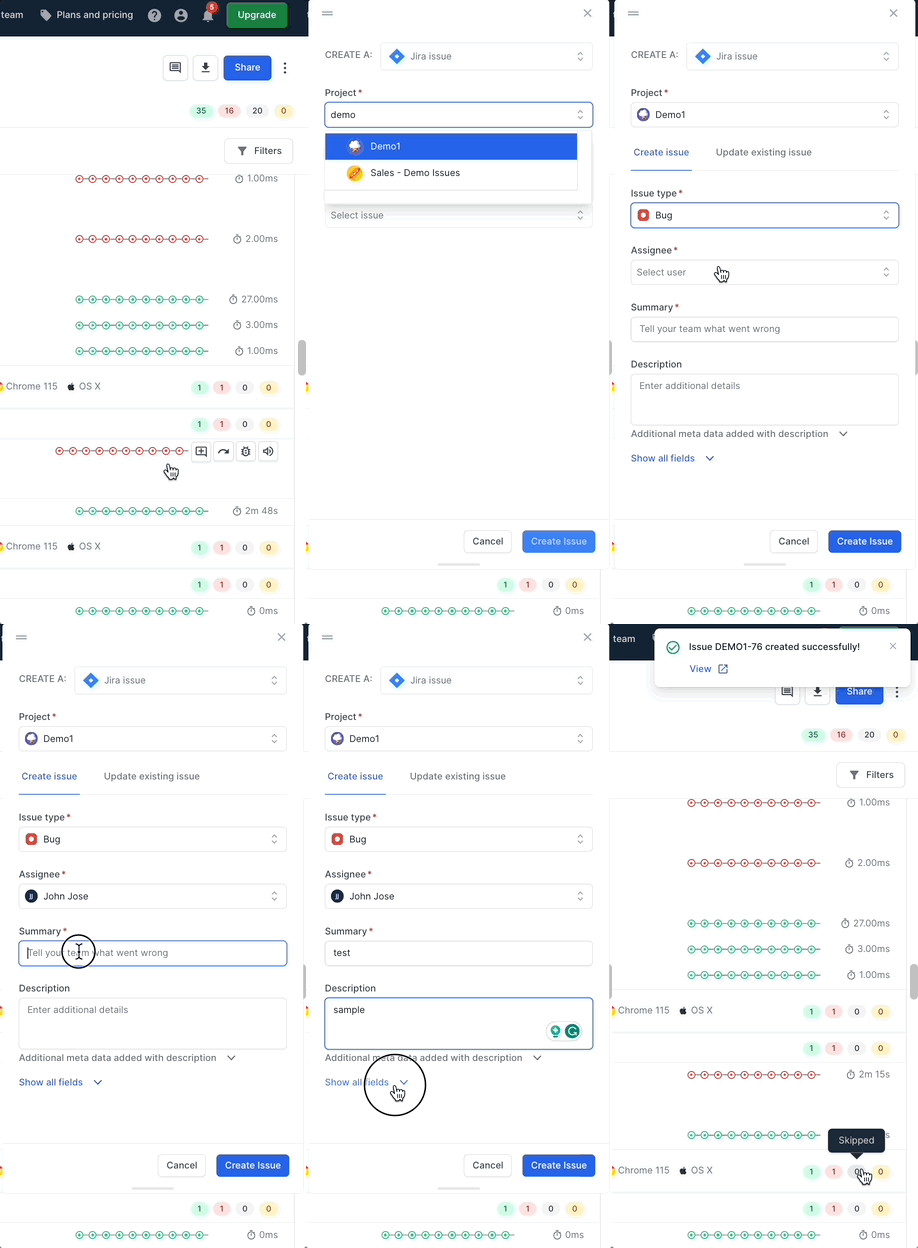
Report bugs on Jira: When you spot a bug, you can directly report it on Jira without leaving Test Reporting & Analytics. Test Reporting & Analytics automatically adds rich Metadata to the Jira bug such that anyone who looks at it gets all the information needed to resolve the bug.
Learn more about integrating Jira with Test Reporting & Analytics here.
New to Test Reporting & Analytics?
You can integrate Test Reporting & Analytics with your test suite in a few minutes. Test Reporting & Analytics works with most of the leading test frameworks.
Curious to learn more?
Check out the demo sandbox to experience advanced testing using Test Reporting & Analytics.
We're sorry to hear that. Please share your feedback so we can do better
Contact our Support team for immediate help while we work on improving our docs.
We're continuously improving our docs. We'd love to know what you liked
We're sorry to hear that. Please share your feedback so we can do better
Contact our Support team for immediate help while we work on improving our docs.
We're continuously improving our docs. We'd love to know what you liked
Thank you for your valuable feedback!