Create a usage dashboard
Track the usage of test executions considered for billing.
BrowserStack Test Reporting & Analytics uses the number of test executions as the main metric for billing purposes. You can track the overall usage in home. To monitor test executions in-depth, you can also create a usage dashboard.
Components of a usage dashboard
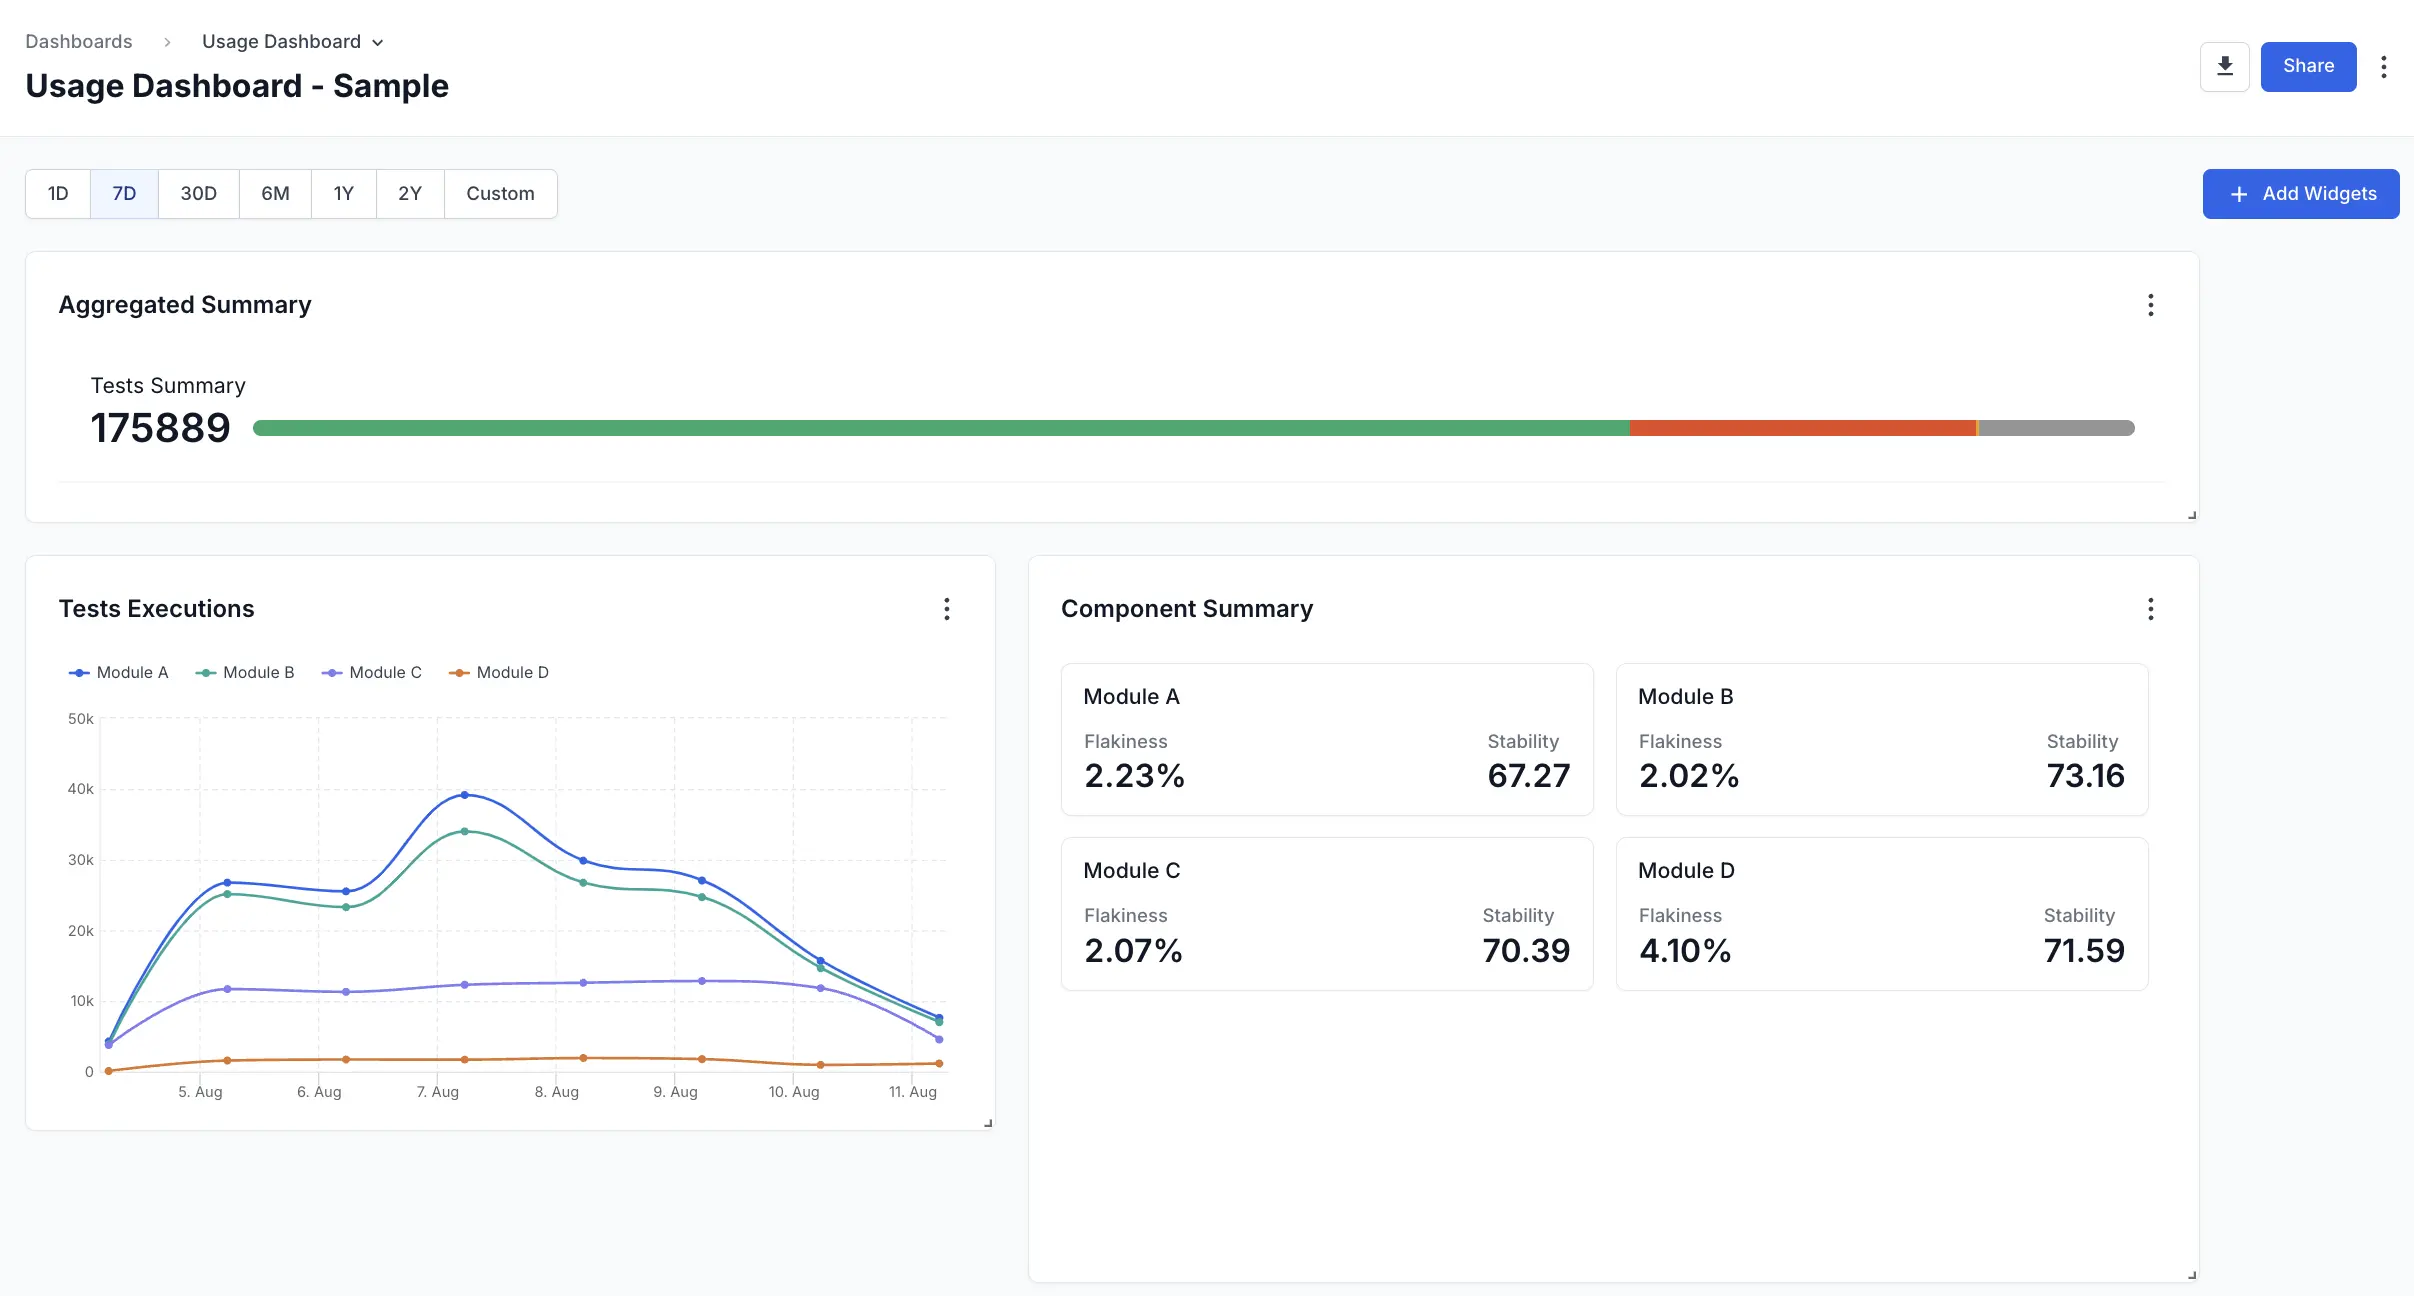
To create a comprehensive usage dashboard that tracks the test executions counted towards your billing, you can make a dashboard with the following three widgets:
- Aggregated Summary
- Test Executions
- Component Summary
The following image is a sample usage dashboard with all the three widgets configured:
Aggregated Summary widget in the usage dashboard
The Aggregated Summary widget provides high-level information on the total test executions that count toward billing.
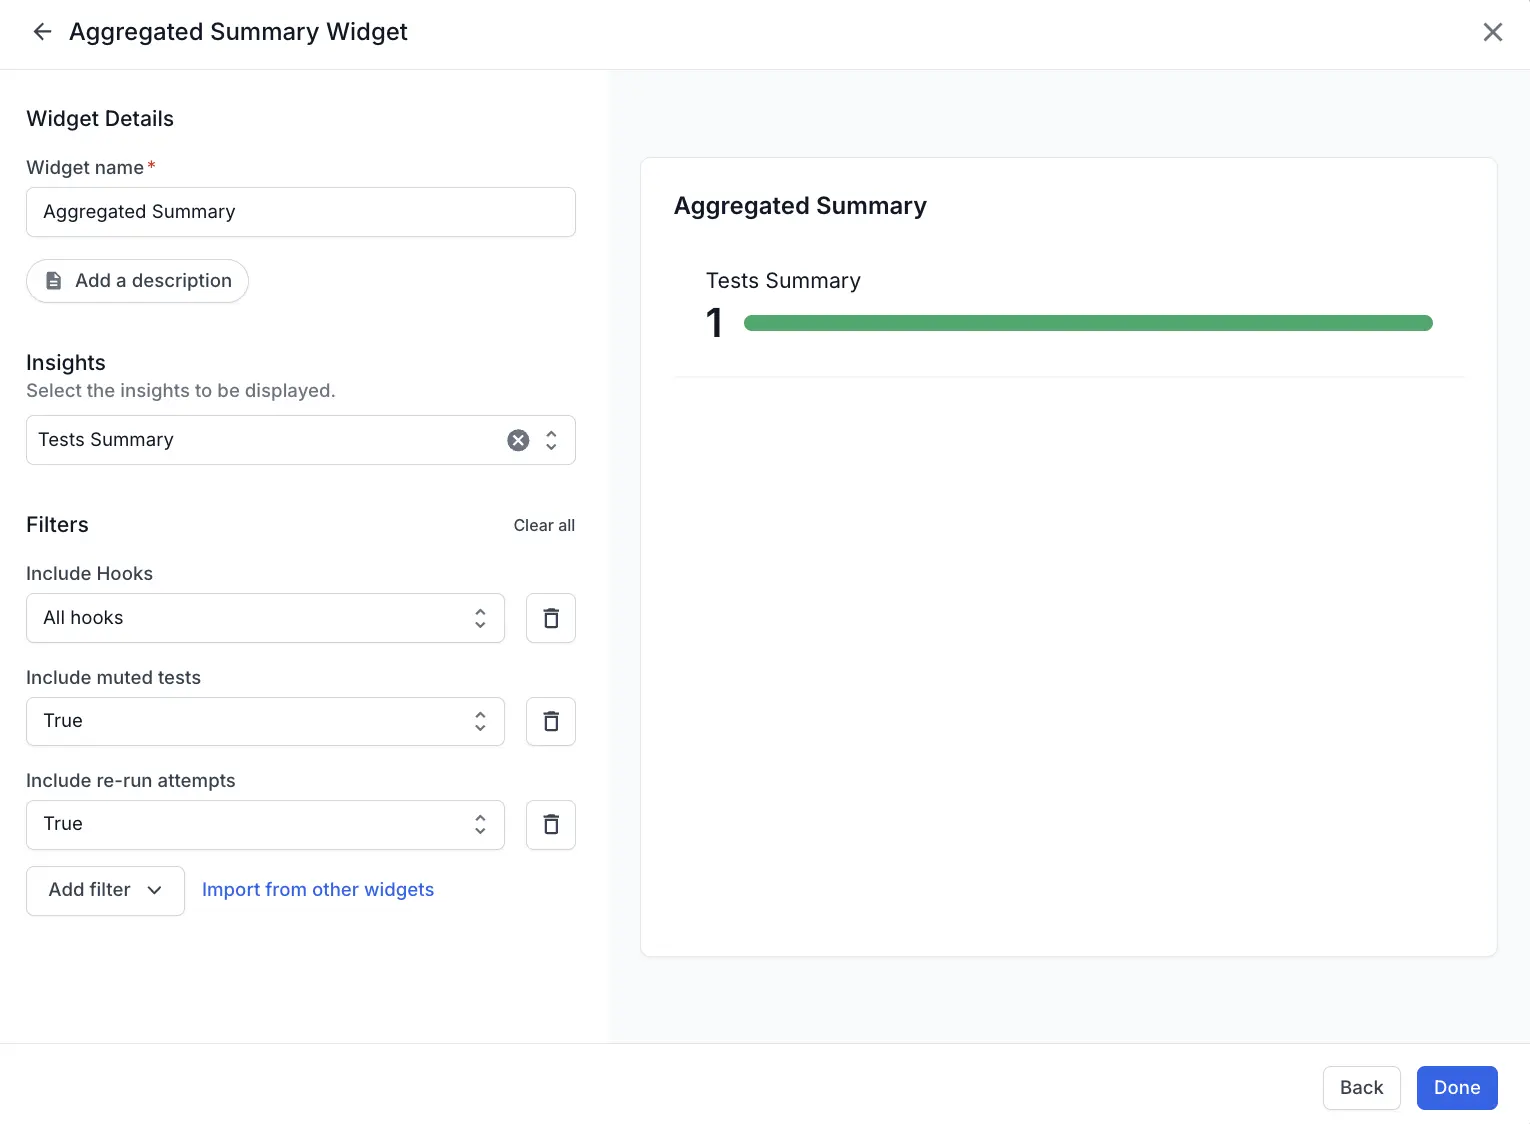
Add the following configurations in the Aggregated Summary widget in the usage dashboard to get an overview of the total number of test executions consumed by your organization:
- Add
Tests Summaryas an insight. - Select
All hooksunder theHooks Visibilityfilter. - Select
Trueunder theInclude muted testsfilter. - Select
Trueunder theInclude re-run attemptsfilter.
Here is a sample configuration:
Test Executions widget in usage dashboard
If you want to track the trend of the number of test executions used by different modules, teams, users, etc, you can configure the Test Executions widget.
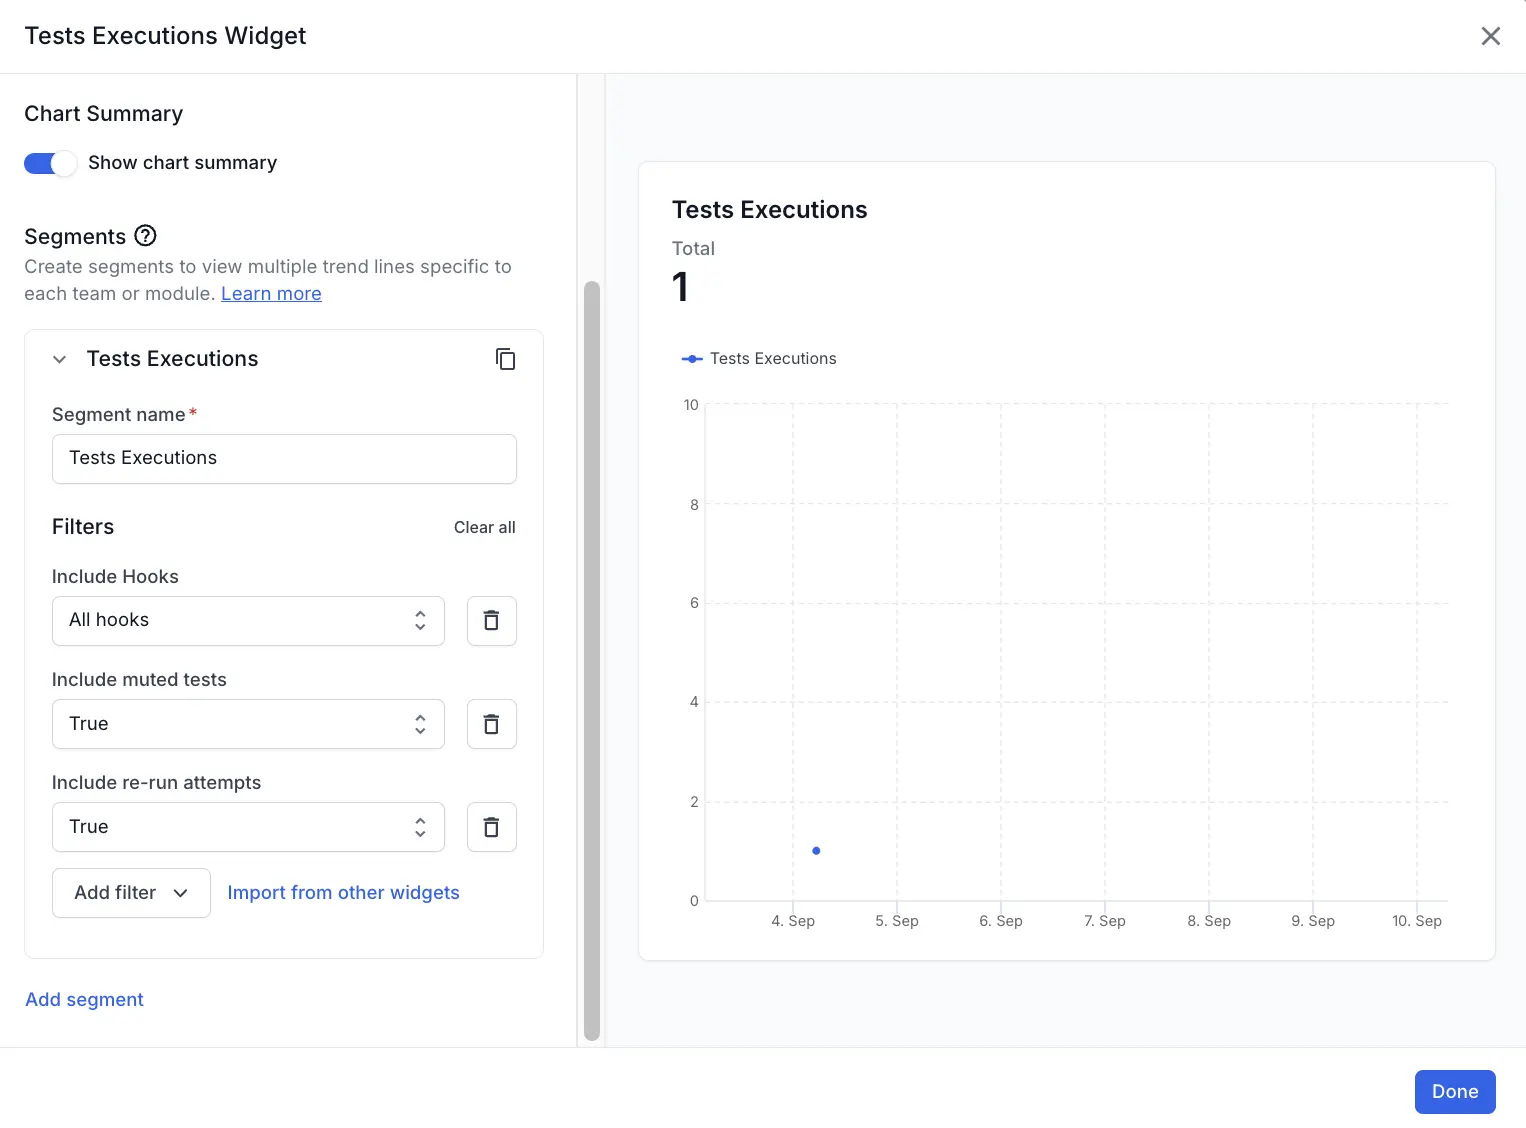
Add the following filters in the Test Execution widget to track the usage:
- Select
All hooksunder theHooks Visibilityfilter. - Select
Trueunder theInclude muted testsfilter. - Select
Trueunder theInclude re-run attemptsfilter.
Here is a sample configuration:
You can further create segemets to track or compare the usage across different modules, teams, etc.
Component Summary widget in the usage dashboard
If you want to compare the aggregated numbers of test executions used by different modules, teams, users, etc, you can configure the Component Summary widget.
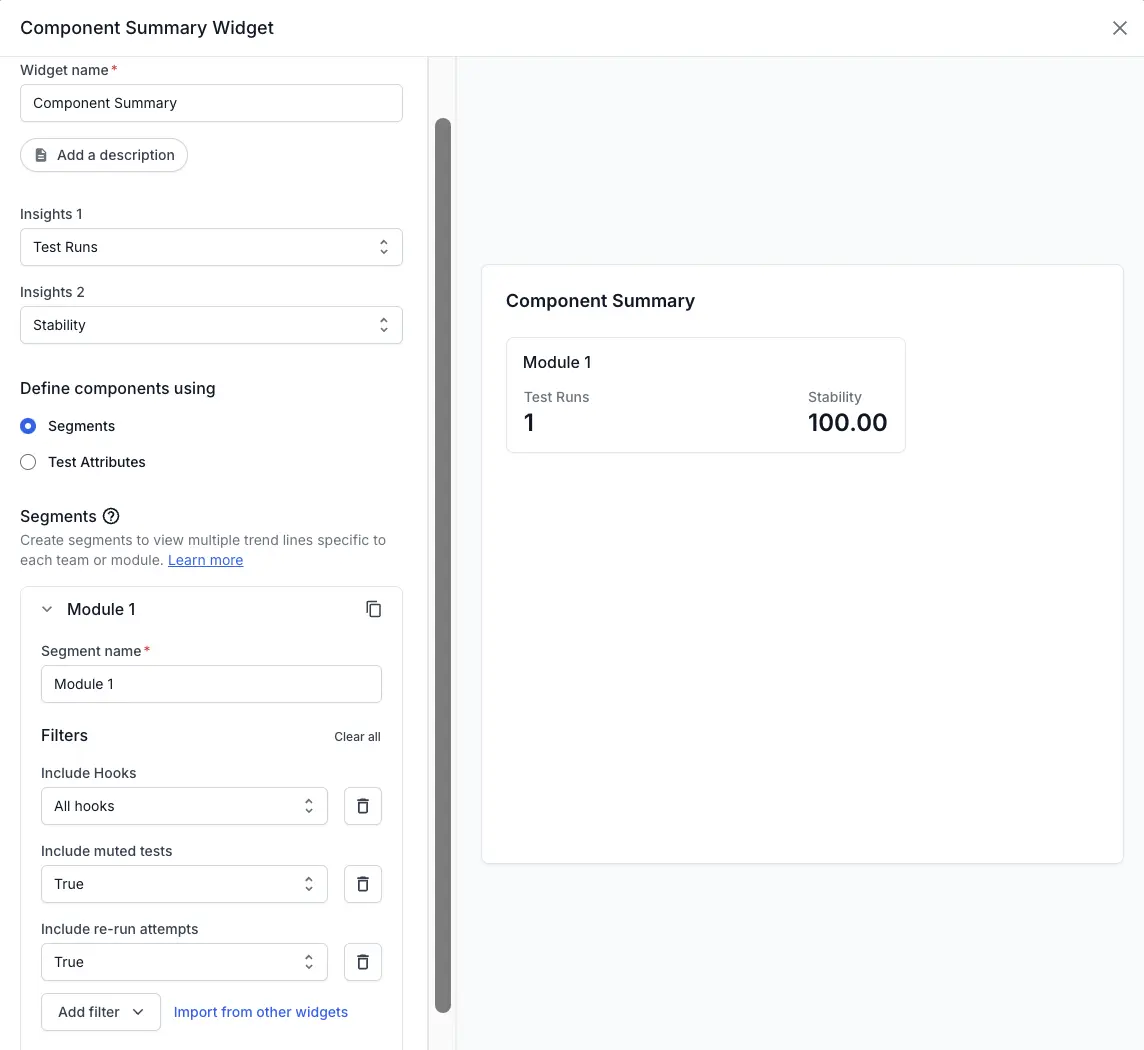
Add the following configurations in the Component Summary widget in the usage dashboard to get an overview of the total number of test executions consumed by your organization:
- Add
Test Runsas one of the insights. - Select segments to define modules, teams, etc.
- Select
All hooksunder theHooks Visibilityfilter. - Select
Trueunder theInclude muted testsfilter. - Select
Trueunder theInclude re-run attemptsfilter.
Here is a sample configuration:
We're sorry to hear that. Please share your feedback so we can do better
Contact our Support team for immediate help while we work on improving our docs.
We're continuously improving our docs. We'd love to know what you liked
We're sorry to hear that. Please share your feedback so we can do better
Contact our Support team for immediate help while we work on improving our docs.
We're continuously improving our docs. We'd love to know what you liked
Thank you for your valuable feedback!