Overview page in Test Reporting & Analytics
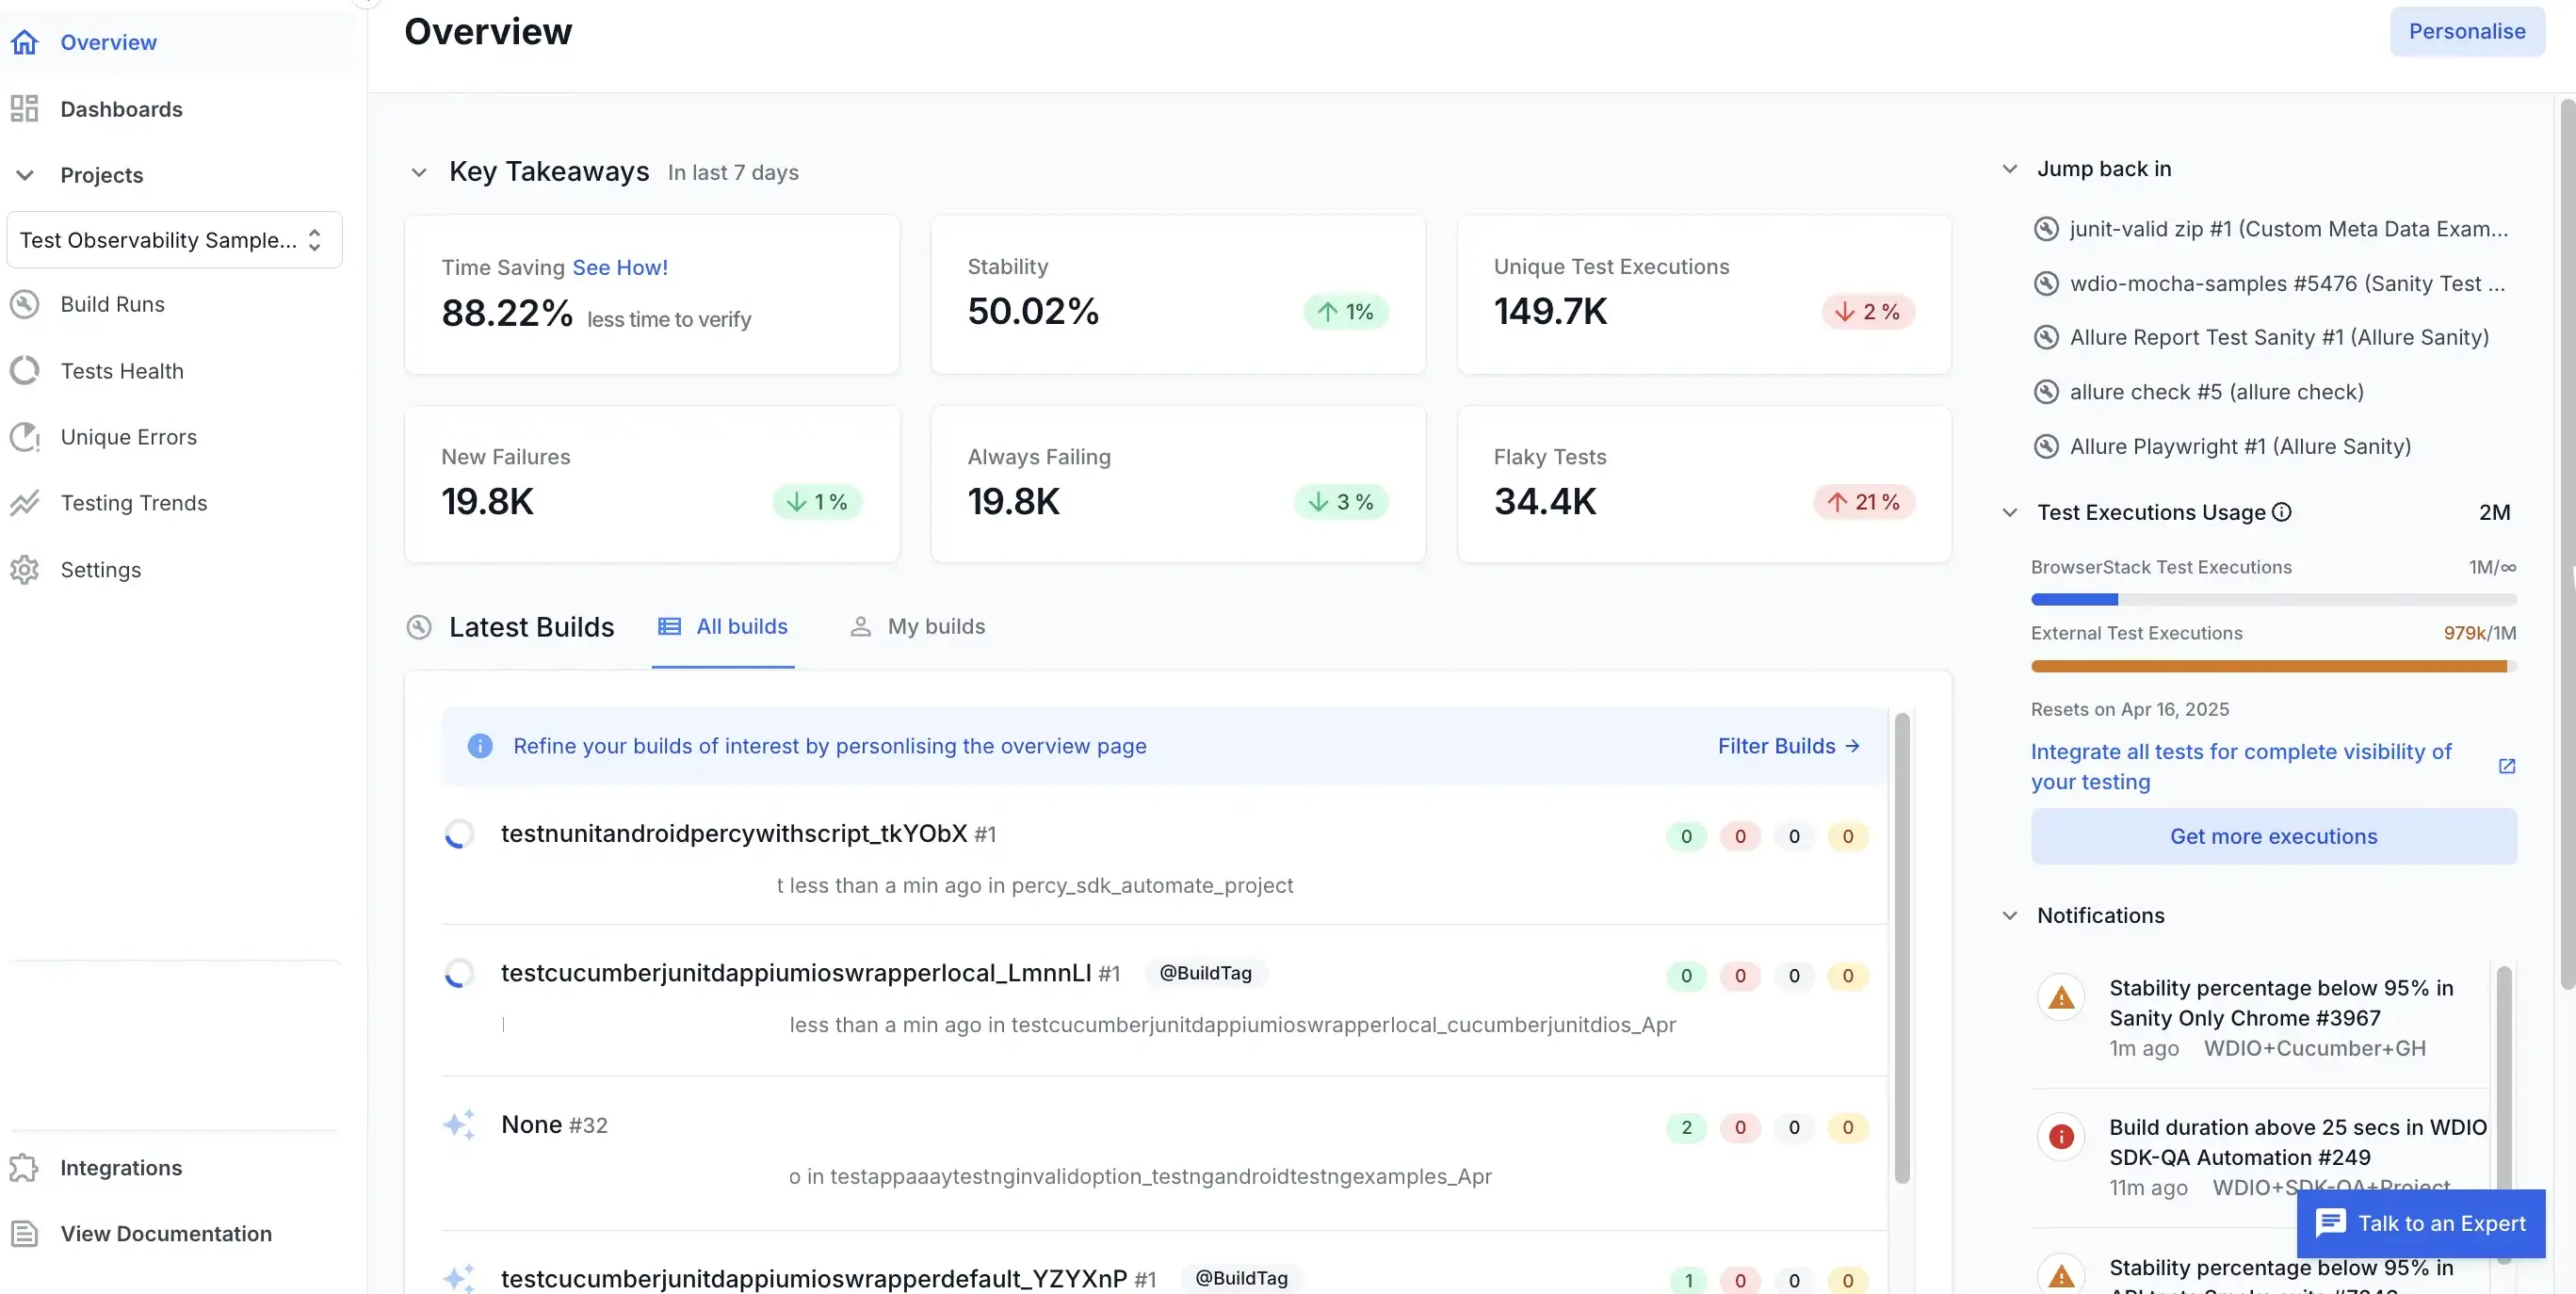
The Overview page is the default landing space for anyone who visits Test Reporting & Analytics. It gives you easy access to the screens you frequently visit, the latest runs of the builds you are interested in, action items you need to work on, and other advanced insights. You can consider the Overview page as the homepage of Test Reporting & Analytics. The Overview page aggregates cross-project information and simplifies navigation across multiple projects and screens.
Personalise your Overview page
You can personalise your Test Reporting & Analytics Overview page to optimize your experience and get the best out of it. Each user can personalise the Overview page to only see data from the projects and builds relevant to them. This can be achieved by choosing projects, builds, build tags, file directories, and users who triggered the builds relevant to you. Whenever there is any change in the tests you are interested in, you can edit your personalisation to suit the new requirements.
Follow these steps to personalise the Overview page:
- Click Personalise on the top-right of the Overview page.
- Limit the tests you want to include in the Overview page by selecting the values for
Projects,Unique Build names,Build Tags,Users, andFile Directory.
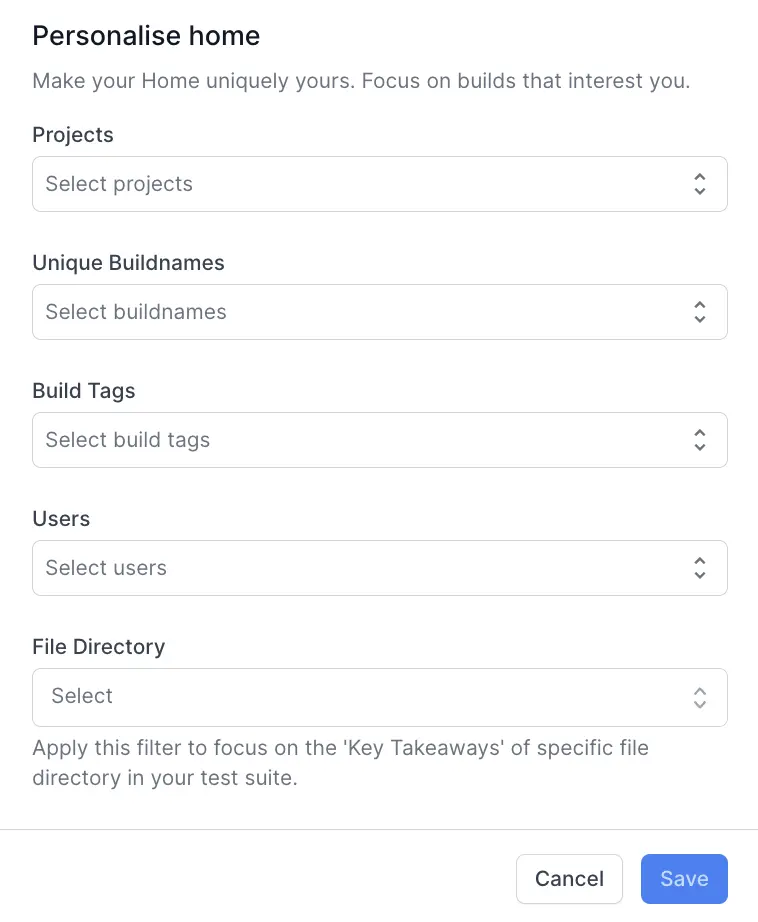
- Switch the notification on for Filtered Builds (all builds as per the filters chosen) or My Builds (only your builds as per the filters chosen) if you want to receive a notification everytime a new build run is detected. Switch this off if you don’t want to recieve notification.

- Click Save.
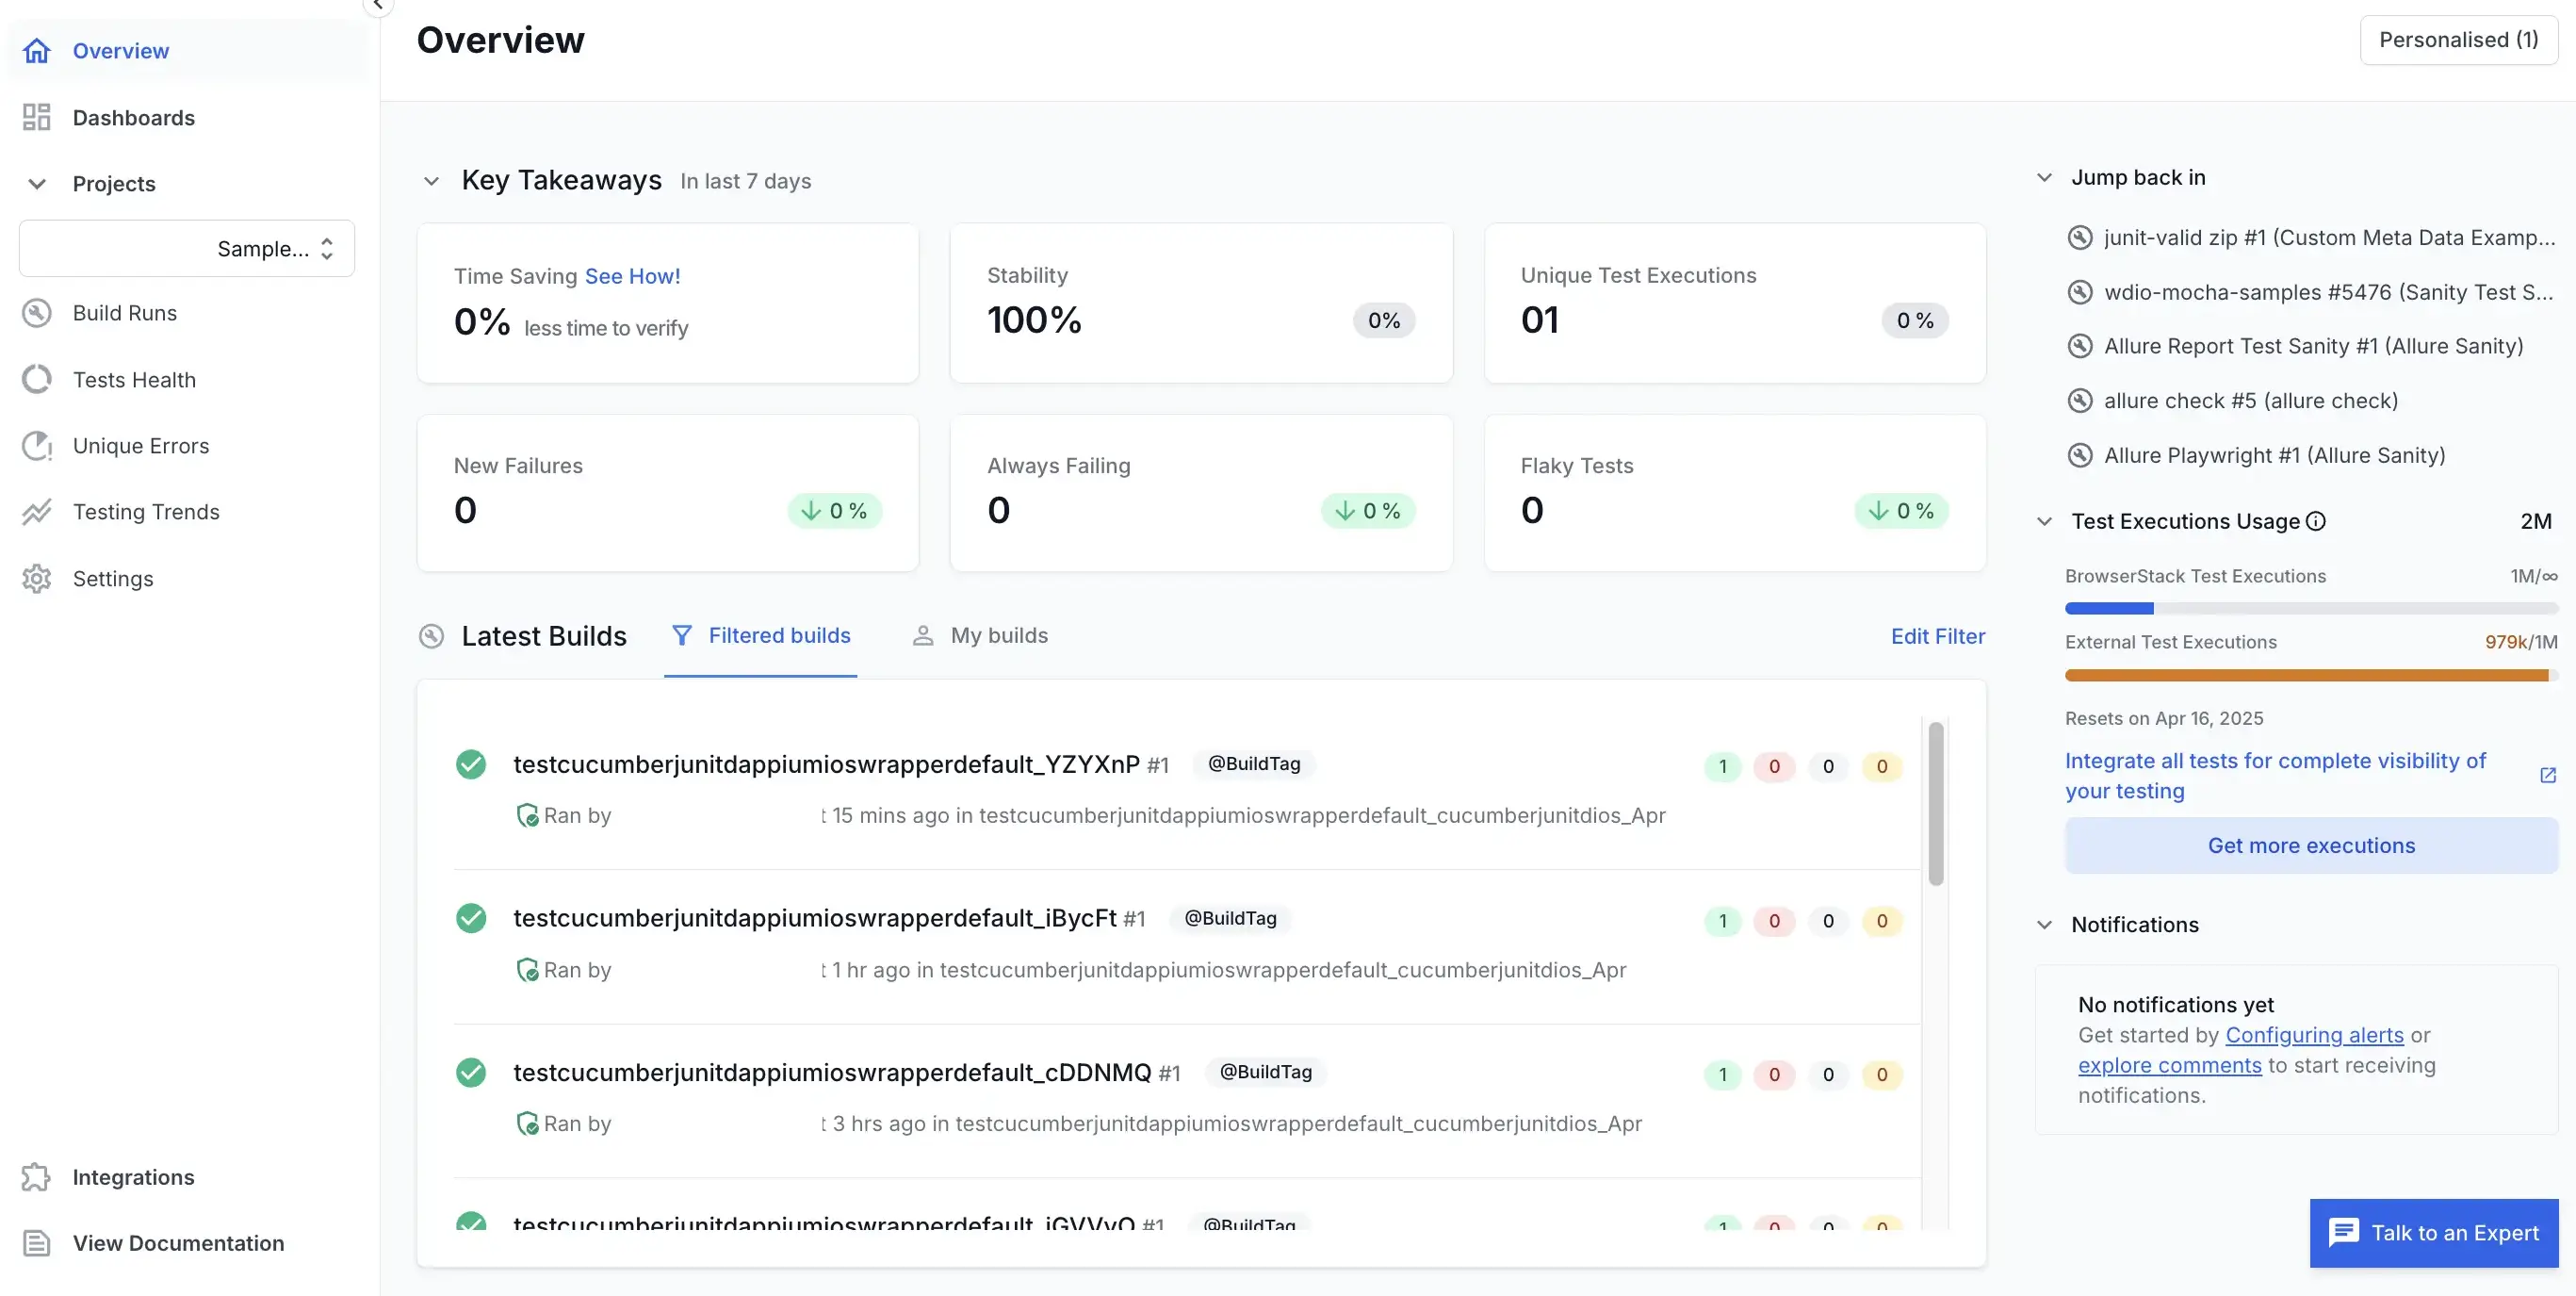
The components in Overview page Key Takeaways, Latest Builds, and Notifications include tests according to your choices while personalising Overview page.
Components of the Overview page
Overview page displays crucial information at a glance and allows you to quickly navigate to action items, frequently visited pages, and the latest runs of your builds. The following are the major components of the Overview page:
Key Takeaways
The Overview page prominently displays high-level metrics that help you track the performance of your test setup. These metrics are calculated for a period of the last 7 days along with a percentage deviation compared to the last 7 days window. Note that these metrics are calculated only for the tests you include while personalising Overview page.

Following are the attributes you can evaluate in this section:
- Time Savings: Estimated savings in time, using auto failure analysis and smart tagging in Test Reporting & Analytics.
- Stability: Stability of your tests for the last 7 days, along with percentage deviation from the previous cycle.
- Unique Test Executions: Total number of unique test cases run during the last 7-day window, along with percentage deviation from the previous cycle.
- New Failures: Number of new test failures in the last 7-day window, along with percentage deviation from the previous cycle.
- Always failing: Number of tests that always fail in the last 7-day window, along with percentage deviation from the previous cycle.
- Flaky Tests: Number of flaky tests in the last 7-day window, along with percentage deviation from the previous cycle.
Latest Builds
This section lists the latest runs of your builds along with a high-level summary of the run based on the options you chose while personalising. You can navigate to the respective build run by clicking on it.
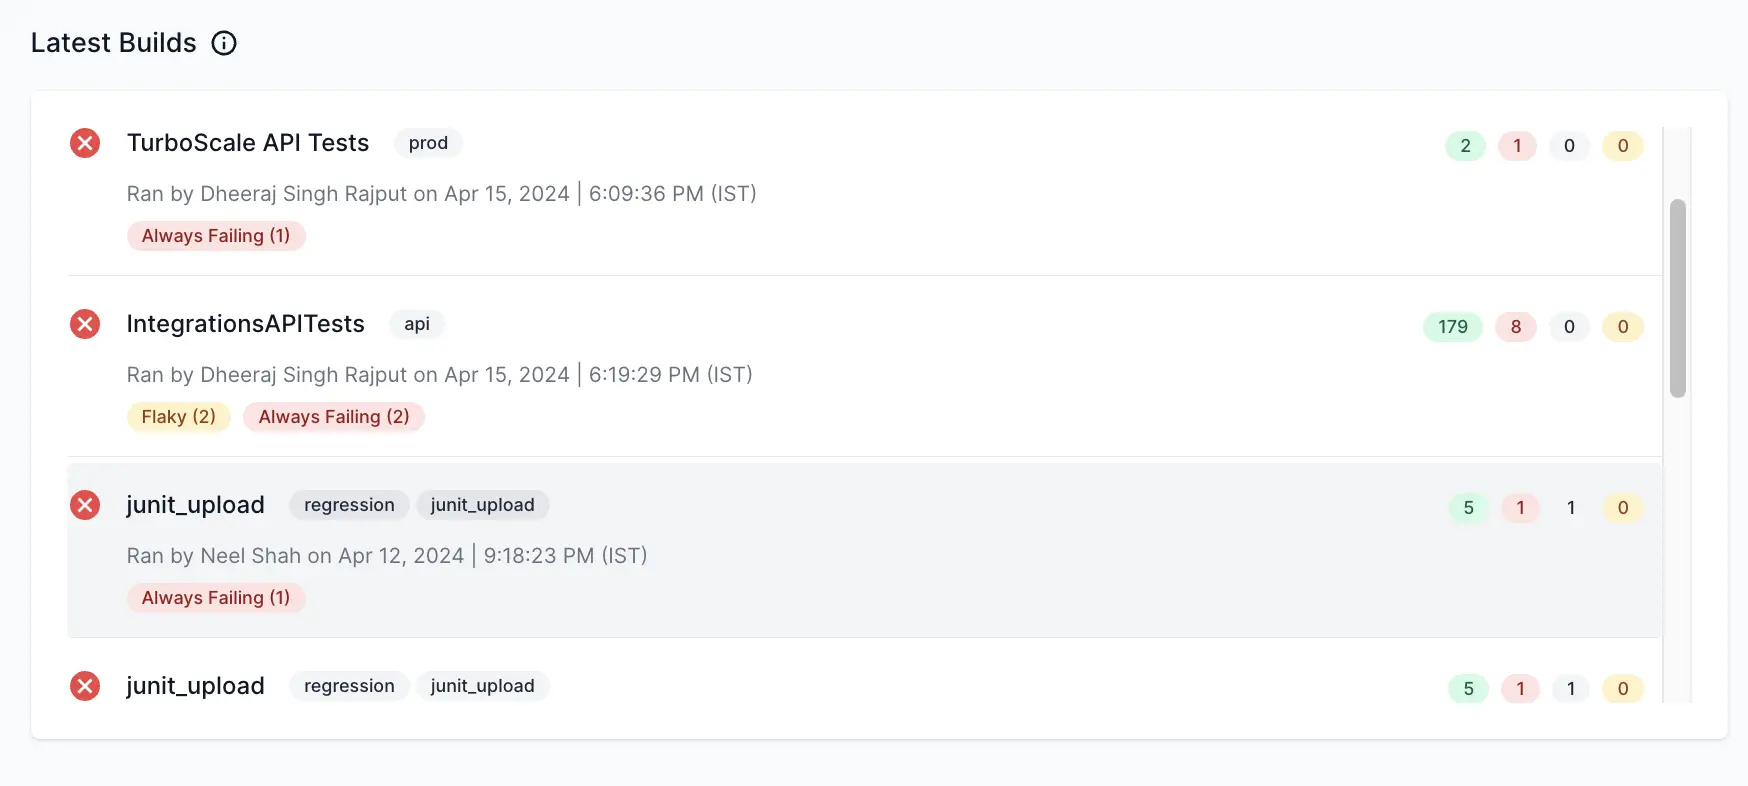
There are two tabs in Latest Builds. The All builds tab lists all the builds and My builds tab lists only the builds run by the user logged in. After you personalise your homepage, the All builds tab changes to Filtered Builds.
Jump back in
This section lists the last five screens you have visited. You can click on them to revisit any of these pages.
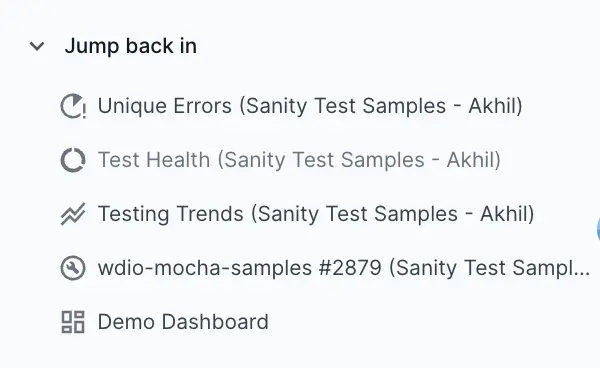
It’s an efficient way to restart your work from where you left it. Using this section, you can quickly access information that you have been looking at recently. For example, if you have been working on a dashboard or a project, you will be able to view it in this section.
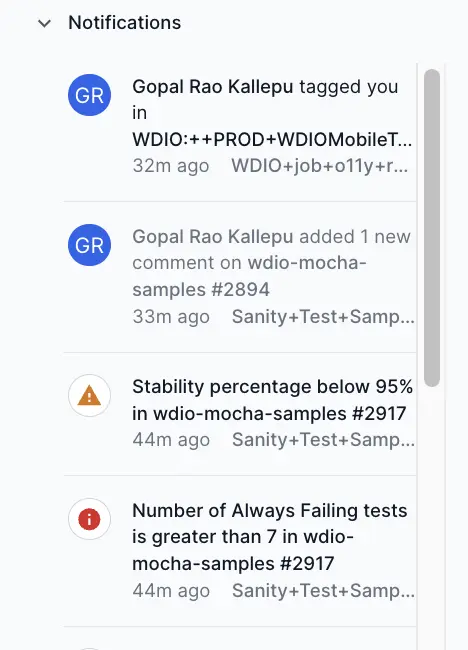
Notifications
The Notifications section displays the list of alerts triggered for your builds and any comment notification based on options included while you personalise your Overview page. This includes:
- Any build-level alerts that have been triggered for your builds.
- Anyone tags you in a comment on your builds.
- Anyone replies to your comment.
Note that the notifications for comments work independently and do not honor the personalisation settings.
This section on the Overview page is an efficient way to track some of your action items whenever you log in to Test Reporting & Analytics.
We're sorry to hear that. Please share your feedback so we can do better
Contact our Support team for immediate help while we work on improving our docs.
We're continuously improving our docs. We'd love to know what you liked
We're sorry to hear that. Please share your feedback so we can do better
Contact our Support team for immediate help while we work on improving our docs.
We're continuously improving our docs. We'd love to know what you liked
Thank you for your valuable feedback!