Top Unique Errors
This widget lists the top errors and the number of tests and test executions impacted by these errors. This widget provides you with a unique approach to identifying the unique errors that are causing the most number of failures and solving them.
Drill down for more information
You can investigate more contextual information on all dashboard widgets using the drill-down feature.
You can use the drill-down feature in the Top Unique Errors widget to analyze more details on the errors. For example, if you want to investigate the unique error causing the most test fest failures, you can investigate that particular error.
Follow these steps to use the drill-down feature:
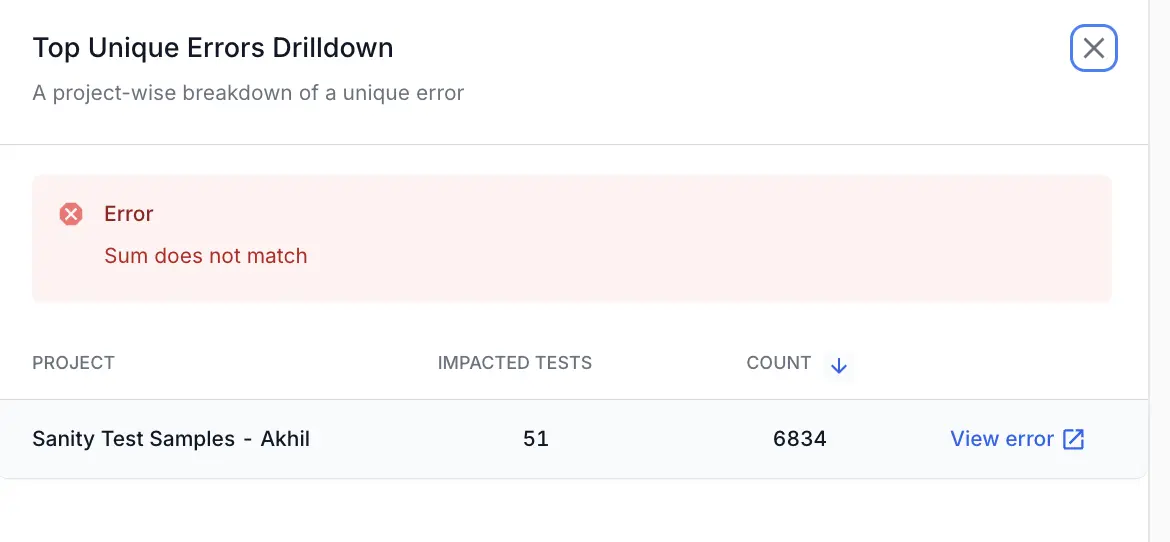
- Click any unique error in the Top Unique Errors widget. A project-wise breakdown of the metrics for the selected date range opens up in a side pane.

- Click View error to get to the error.
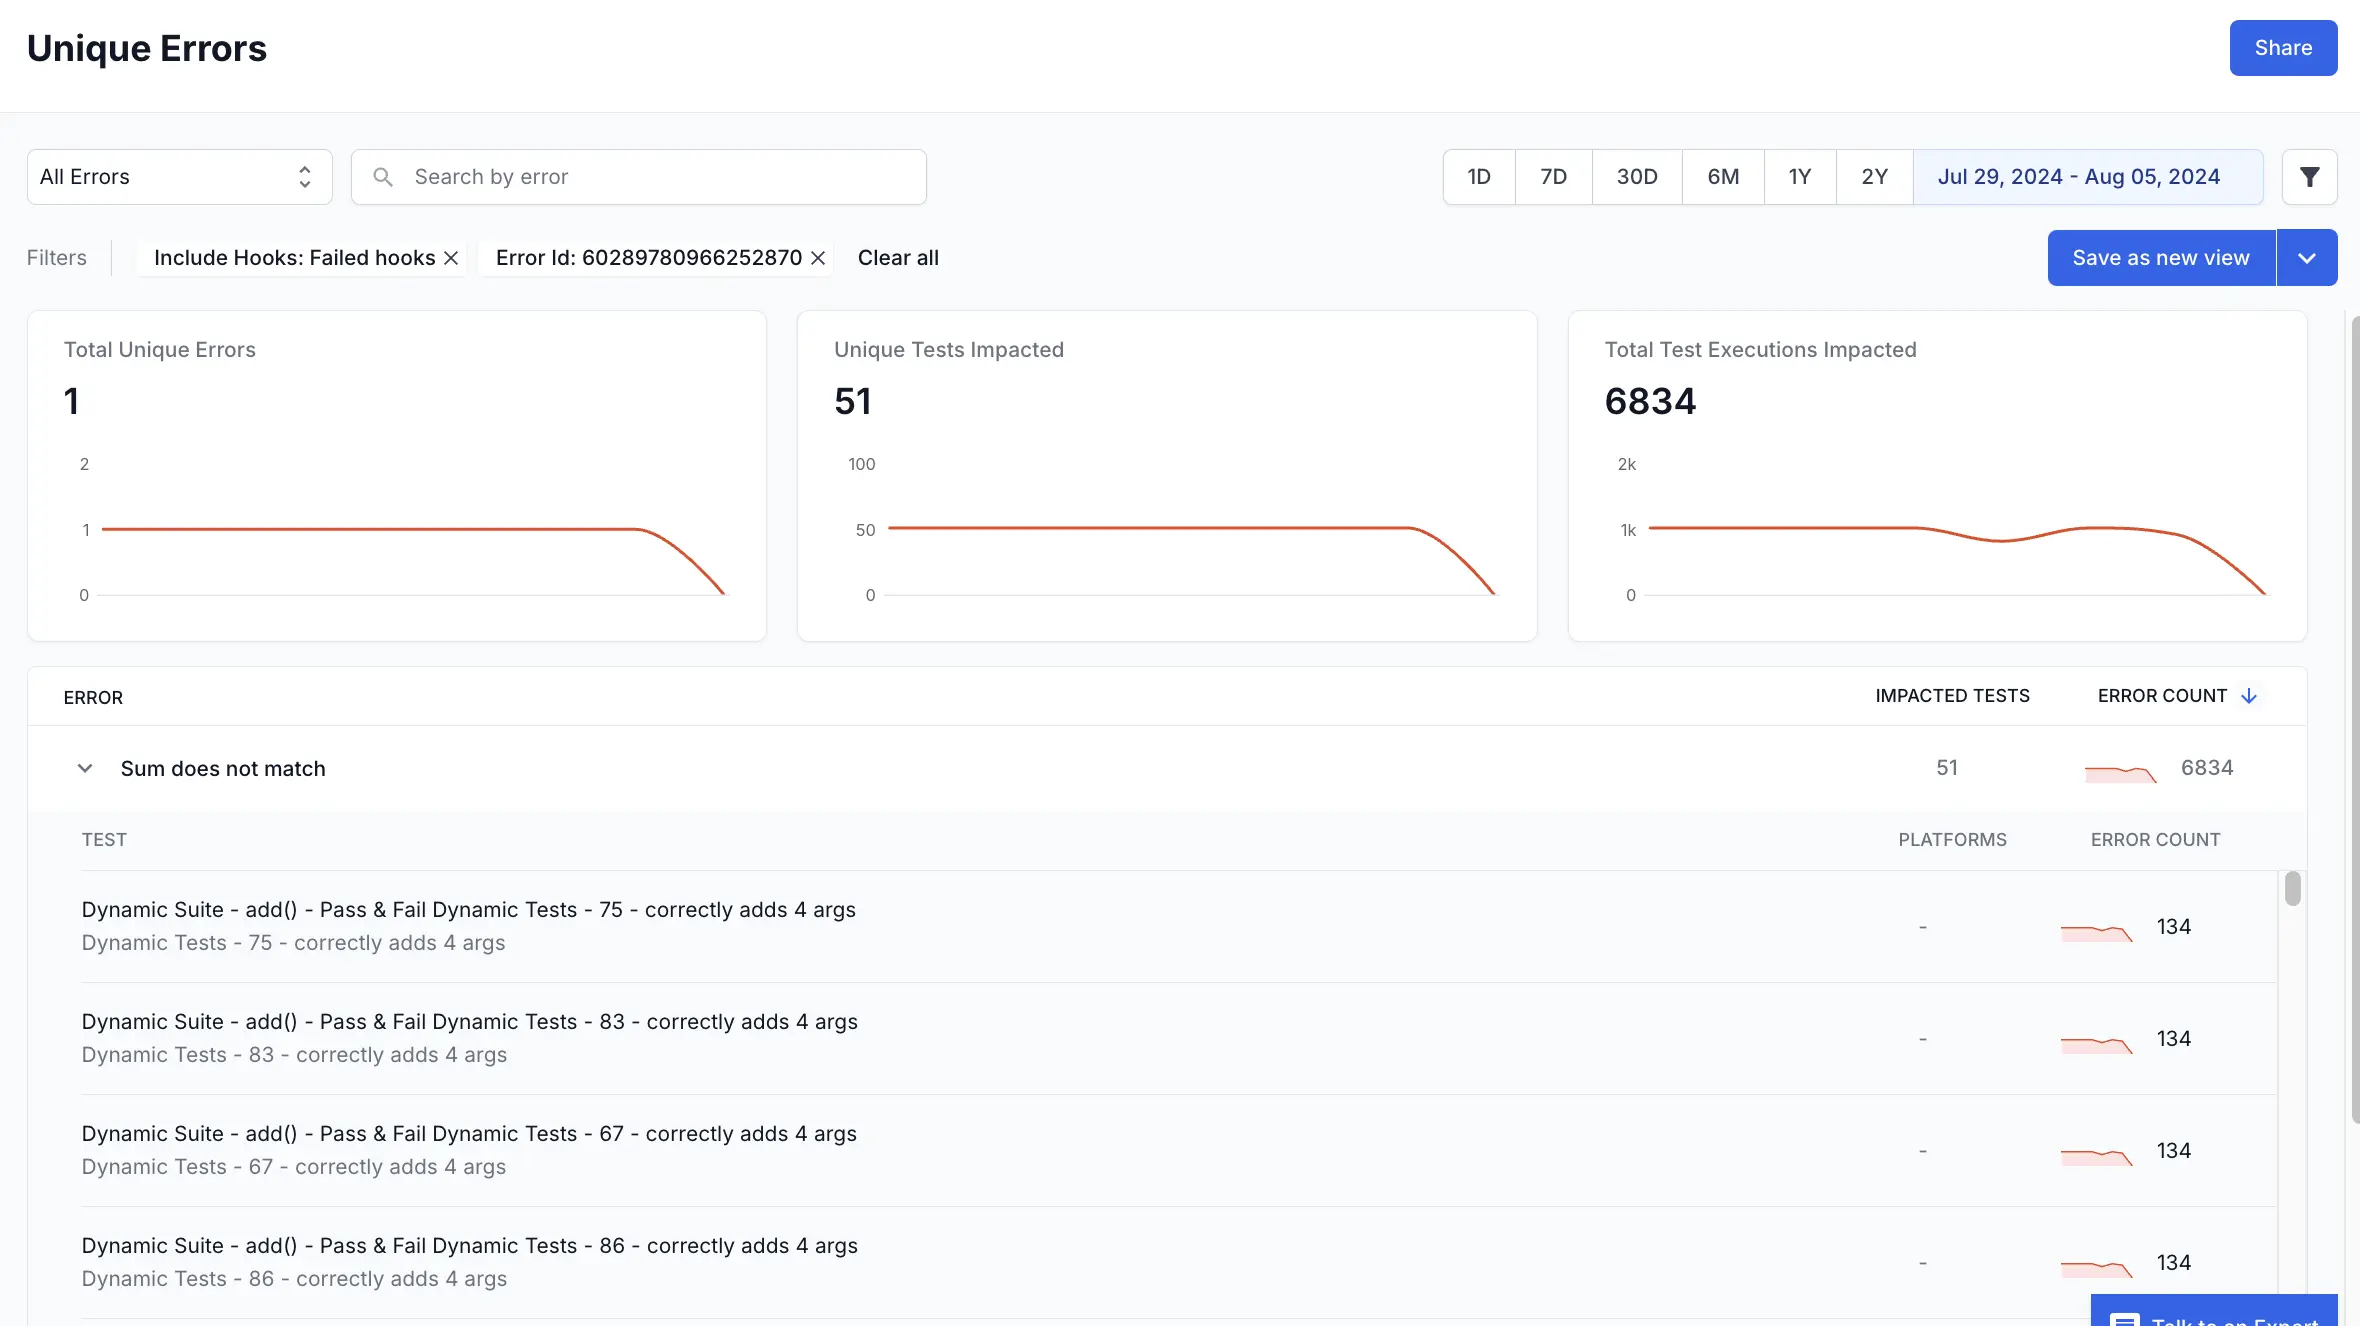
This opens Unique Errors in a new tab with the applicable filters. On Unique Errors, you can further investigate the error and take corrective actions.

Widget configuration - Top Unique Errors
You can configure the following options in the Top Unique Errors widget:
- Choose to show
20,50, or100errors in the widget. - Filter data by several parameters like projects, unique build names, users, tags, etc.
- Display or hide the chart summary.
We're sorry to hear that. Please share your feedback so we can do better
Contact our Support team for immediate help while we work on improving our docs.
We're continuously improving our docs. We'd love to know what you liked
We're sorry to hear that. Please share your feedback so we can do better
Contact our Support team for immediate help while we work on improving our docs.
We're continuously improving our docs. We'd love to know what you liked
Thank you for your valuable feedback!