
iOS Network Logs
The Network Logs section shows the details of all the API requests made during a manual app performance test session. With these details, you can verify that the resources are being downloaded or uploaded as expected. You can analyze the details of an individual resource, such as its HTTP headers, content, size, and so on.
In App Performance Testing, the Network Logs feature is supported only for manual testing (App Live), not for automated tests (App Automate).
View iOS Network Logs for manual app tests
- In App Live, select the iOS device, start a session, open the DEVTOOLS pane and select NETWORK.
- Under Configure Network Tracking, choose Enable for all traffic or Enable for specific domains. If you choose Enable for specific domains, enter the domains in the text field, separated by commas.
- Click Save configuration, which will restart the app to apply the changes.
A message appears: “Network Tracking enabled successfully”. If app profiling is in progress and you modify the network configuration, the app will restart. - Go to the PERFORMANCE tab and run the app performance test. Click View Full Report and scroll to the Network Logs section.
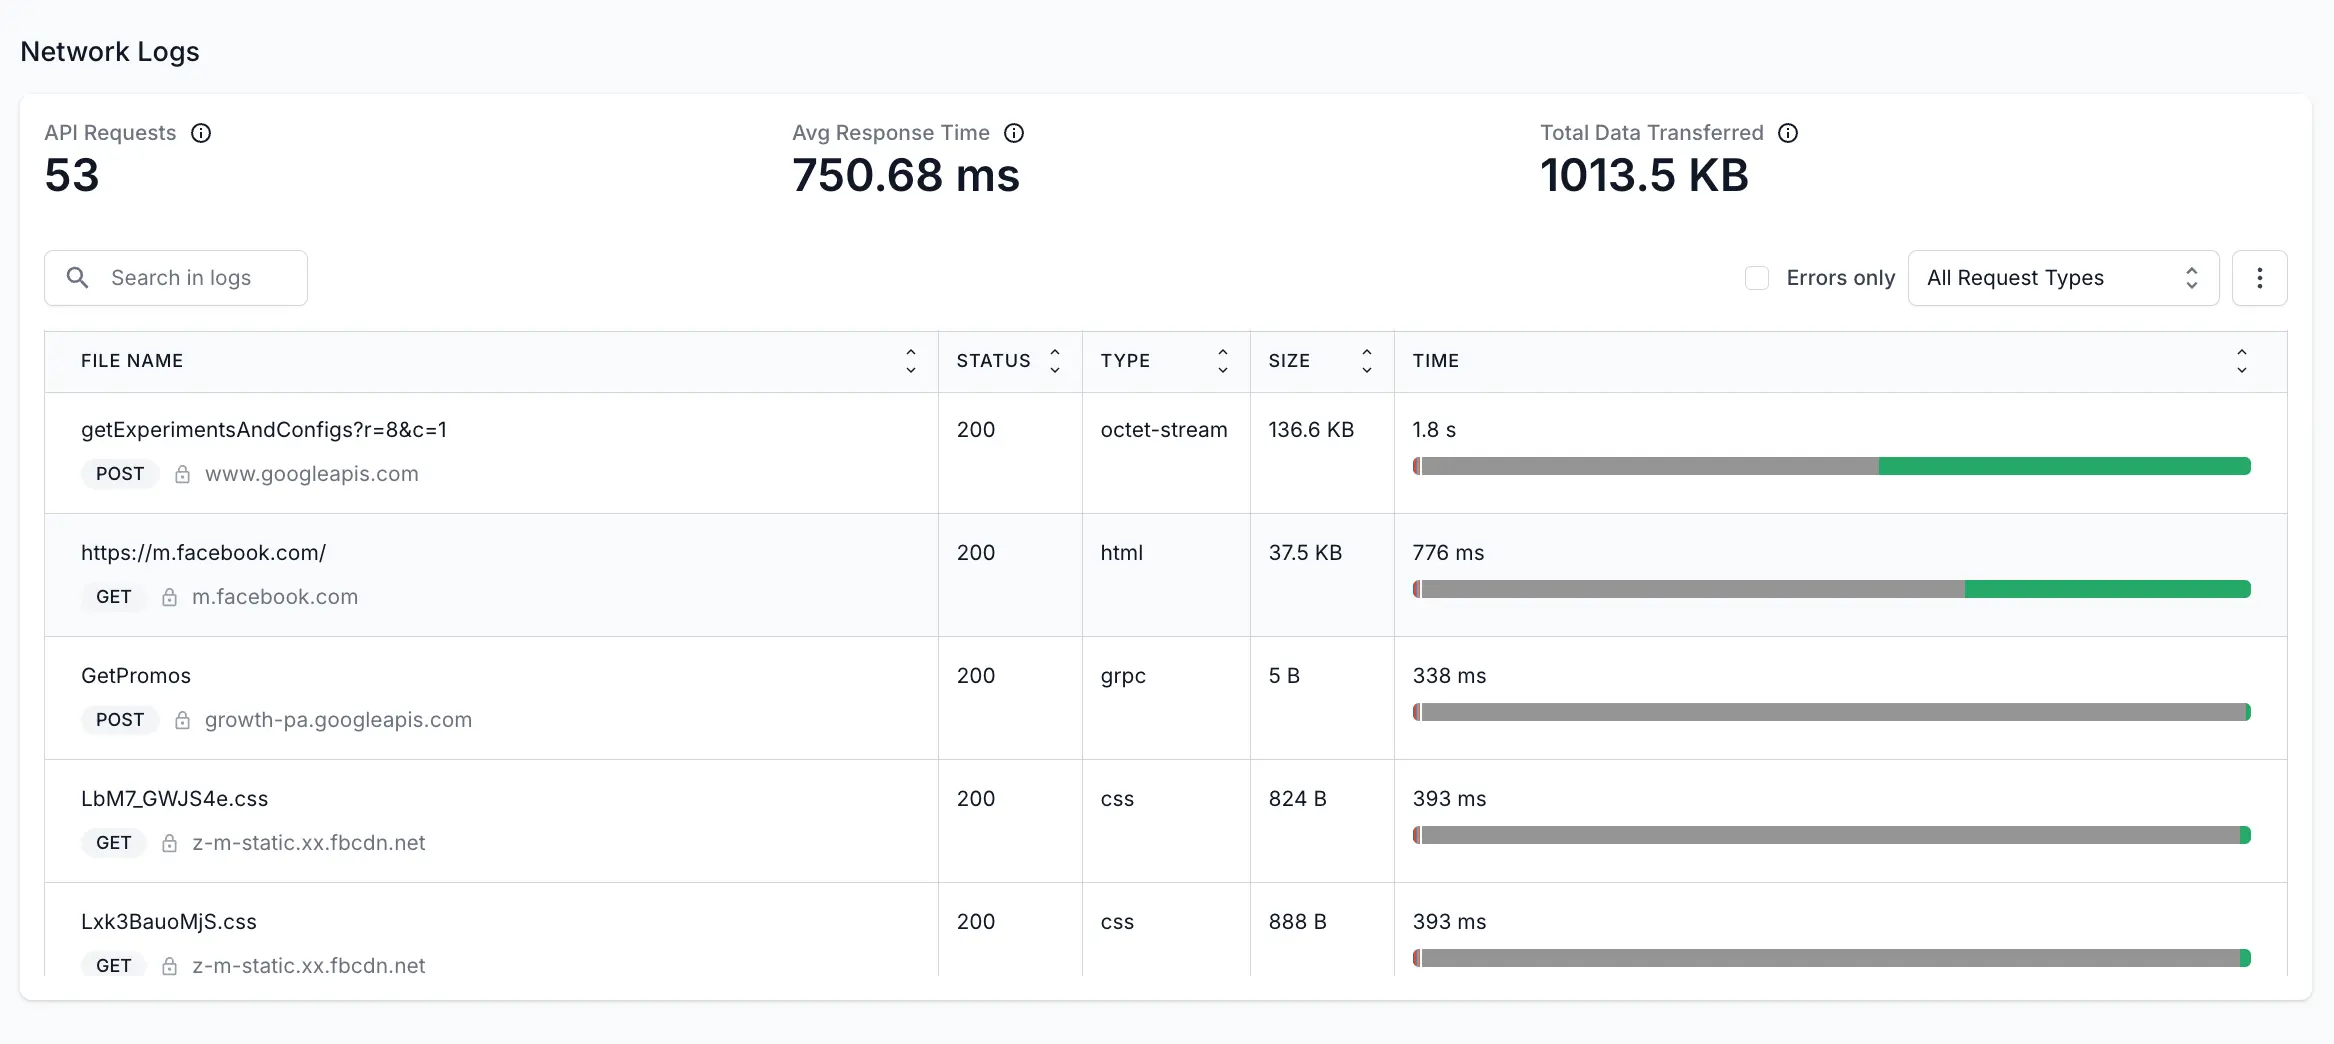
In the Network Logs section, you can view the following details:
- API Requests: The number of API requests made throughout the session.
- Avg Response Time: The average of the time taken by the APIs to take the request, process it, and send back the response to the app.
- Total Data Transferred: The total data exchanged (uploaded or downloaded) from the internet by the app throughout the session.
- API requests table: Click an API to view a detailed table of all API requests, including response status, data transferred, processing time, and for individual APIs, details such as response, headers, payload, and timing. For more details, see API requests table.
API requests table
In the Network Logs section, you can see a table that lists the APIs that were requested, the method used, response details, and more. The following table explains the details listed in the APIs table:
| Field | Description |
|---|---|
| File Name | Name or identifier of the API. |
| Status | The HTTP status code in the response header that indicates the general classification of the response. For example, the 200 status code indicates that the request was successful. Check out HTTP Status Code for more details. |
| Type | The file format or content type of the response. Possible values include HTML, CSS, PNG, X-Javascript and GIF. |
| Size | The combined size of the response headers plus the response body, as delivered by the server. |
| Time | The total duration, from the start of the request to the receipt of the final byte in the response. The bar shows various colors to represent different aspects of content loading: Blue: Represents the time taken to send the request in milliseconds. Red: Indicates the time during which the request is stalled, possibly due to network latency or server responsiveness in milliseconds. Dark Green: Measures the time taken to resolve the domain name into an IP address in milliseconds. Pink: Indicates the time taken to establish an SSL connection in milliseconds. Orange: Indicates the time taken to send the actual request after the connection was established in milliseconds. Grey: Indicates the Time to First Byte (TTFB), which is the time it takes for the server to start sending data after a request is made. Green: Indicates that a piece of content (like a web page, image, or file) was downloaded in milliseconds. |
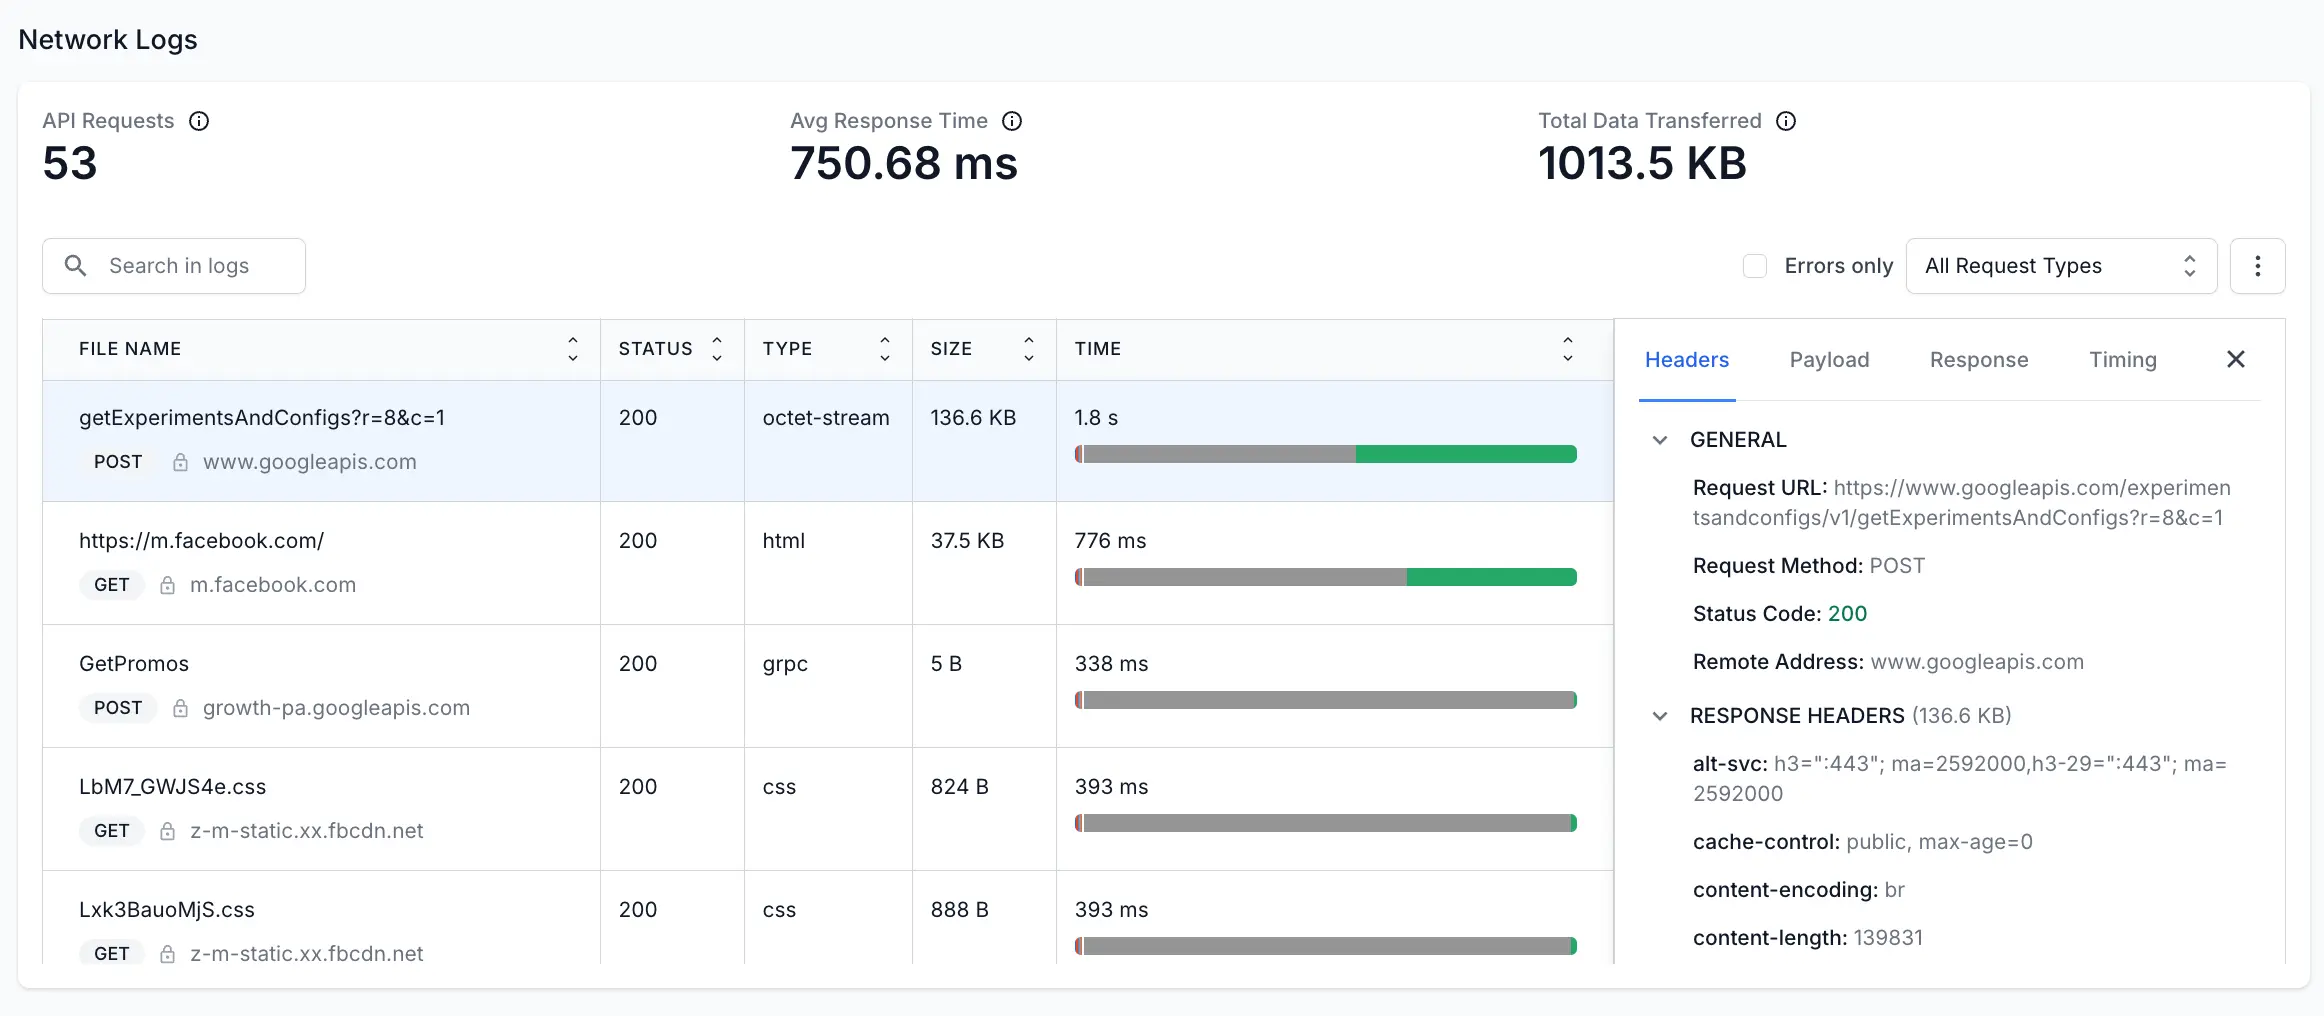
After you click any API entry from the table, another pane opens that shows further details of the API request:
| Field | Description |
|---|---|
| Headers | Information about the request and response, including the status code, the remote address, and the request method used to access the URL. |
| Payload | The data sent in the request, including both the request body and query parameters. |
| Response | The response body containing the requested information by the app. |
| Timing | The breakdown of the time taken to send the request, build connection, and get the response. |
Use filters
To find a particular API request, you can use the search box given at top of the table. Or, you can use the following filters:
- Search in logs: Find specific log entries by searching for text or keywords.
- Errors only: Only shows the APIs that returned error response.
- Request types: Filter the table according to the request type such as XHR, JS, CSS, images, and more.
Download the log file
To download the log file, click the three-dot menu and then click View RAW Logs to download the HAR file. The HAR files are stored in JSON (JavaScript Object Notation) format.
We're sorry to hear that. Please share your feedback so we can do better
Contact our Support team for immediate help while we work on improving our docs.
We're continuously improving our docs. We'd love to know what you liked
We're sorry to hear that. Please share your feedback so we can do better
Contact our Support team for immediate help while we work on improving our docs.
We're continuously improving our docs. We'd love to know what you liked
Thank you for your valuable feedback!