Test app performance on App Live
Identify and troubleshoot app performance issues early in the development cycle.
App performance directly impacts the end-user experience and adoption of the app. App Live integrates with the App Performance Testing tool that helps you identify performance issues in your app early in the app development cycle.
This feature is available only under Team Pro and Enterprise Pro plans. For more details check out our pricing page.
App Performance Testing analyzes the app performance against several industry-standard metrics such as Frames Per Second (FPS), Application Not Responding (ANR) rate, app & page loading times, device resource usage, and more. Once you have identified these issues, you can fix them and release a performant app, ensuring better user experience and adoption.
Supported OS versions
App Performance is supported on the following OS versions:
- Android: versions 10 to 16 Beta
- iOS: versions 14 to 18 and 26 Beta
Run an app performance test
App performance profiling does not support apps installed from TestFlight, the App Store, or the Play Store. You can only profile apps uploaded through the Uploaded Apps option, as shown in the image below.
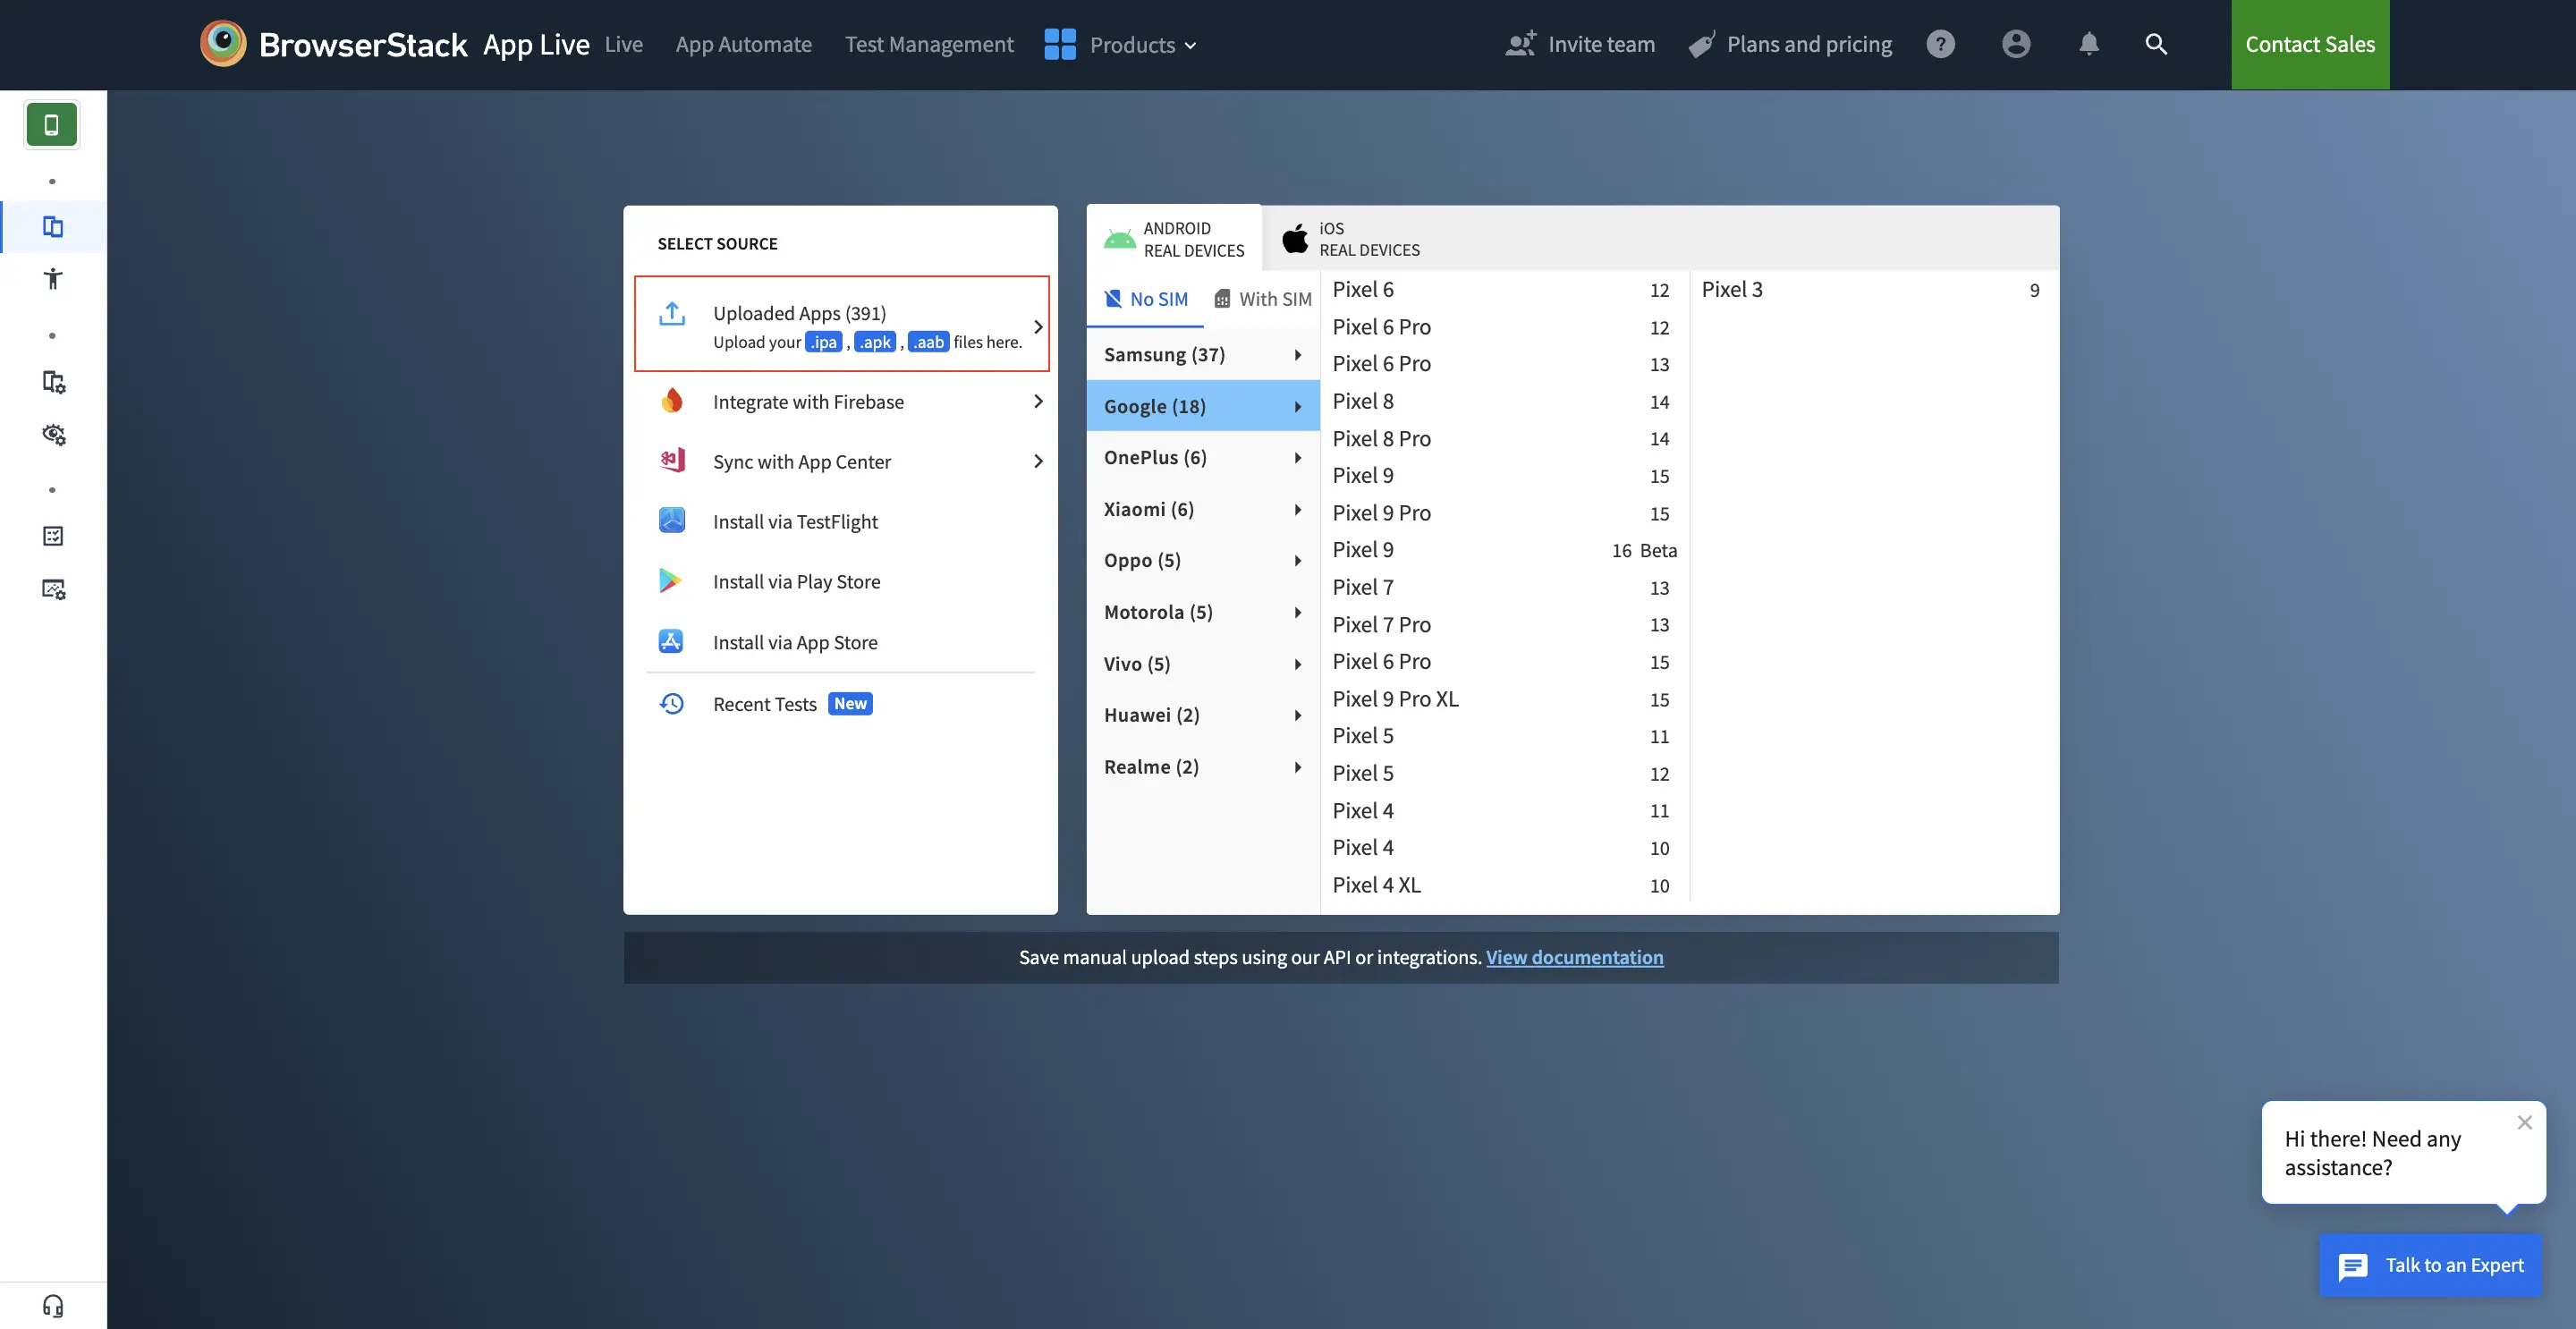
To test app performance on App Live, follow these steps:
- Log in to the App Live dashboard.
- Select your app and the device to launch your test session.
The DevTools pane opens automatically. If you close it and want to open it again, click the DevTools option in the horizontal toolbar.
- In the DevTools pane, click PERFORMANCE.
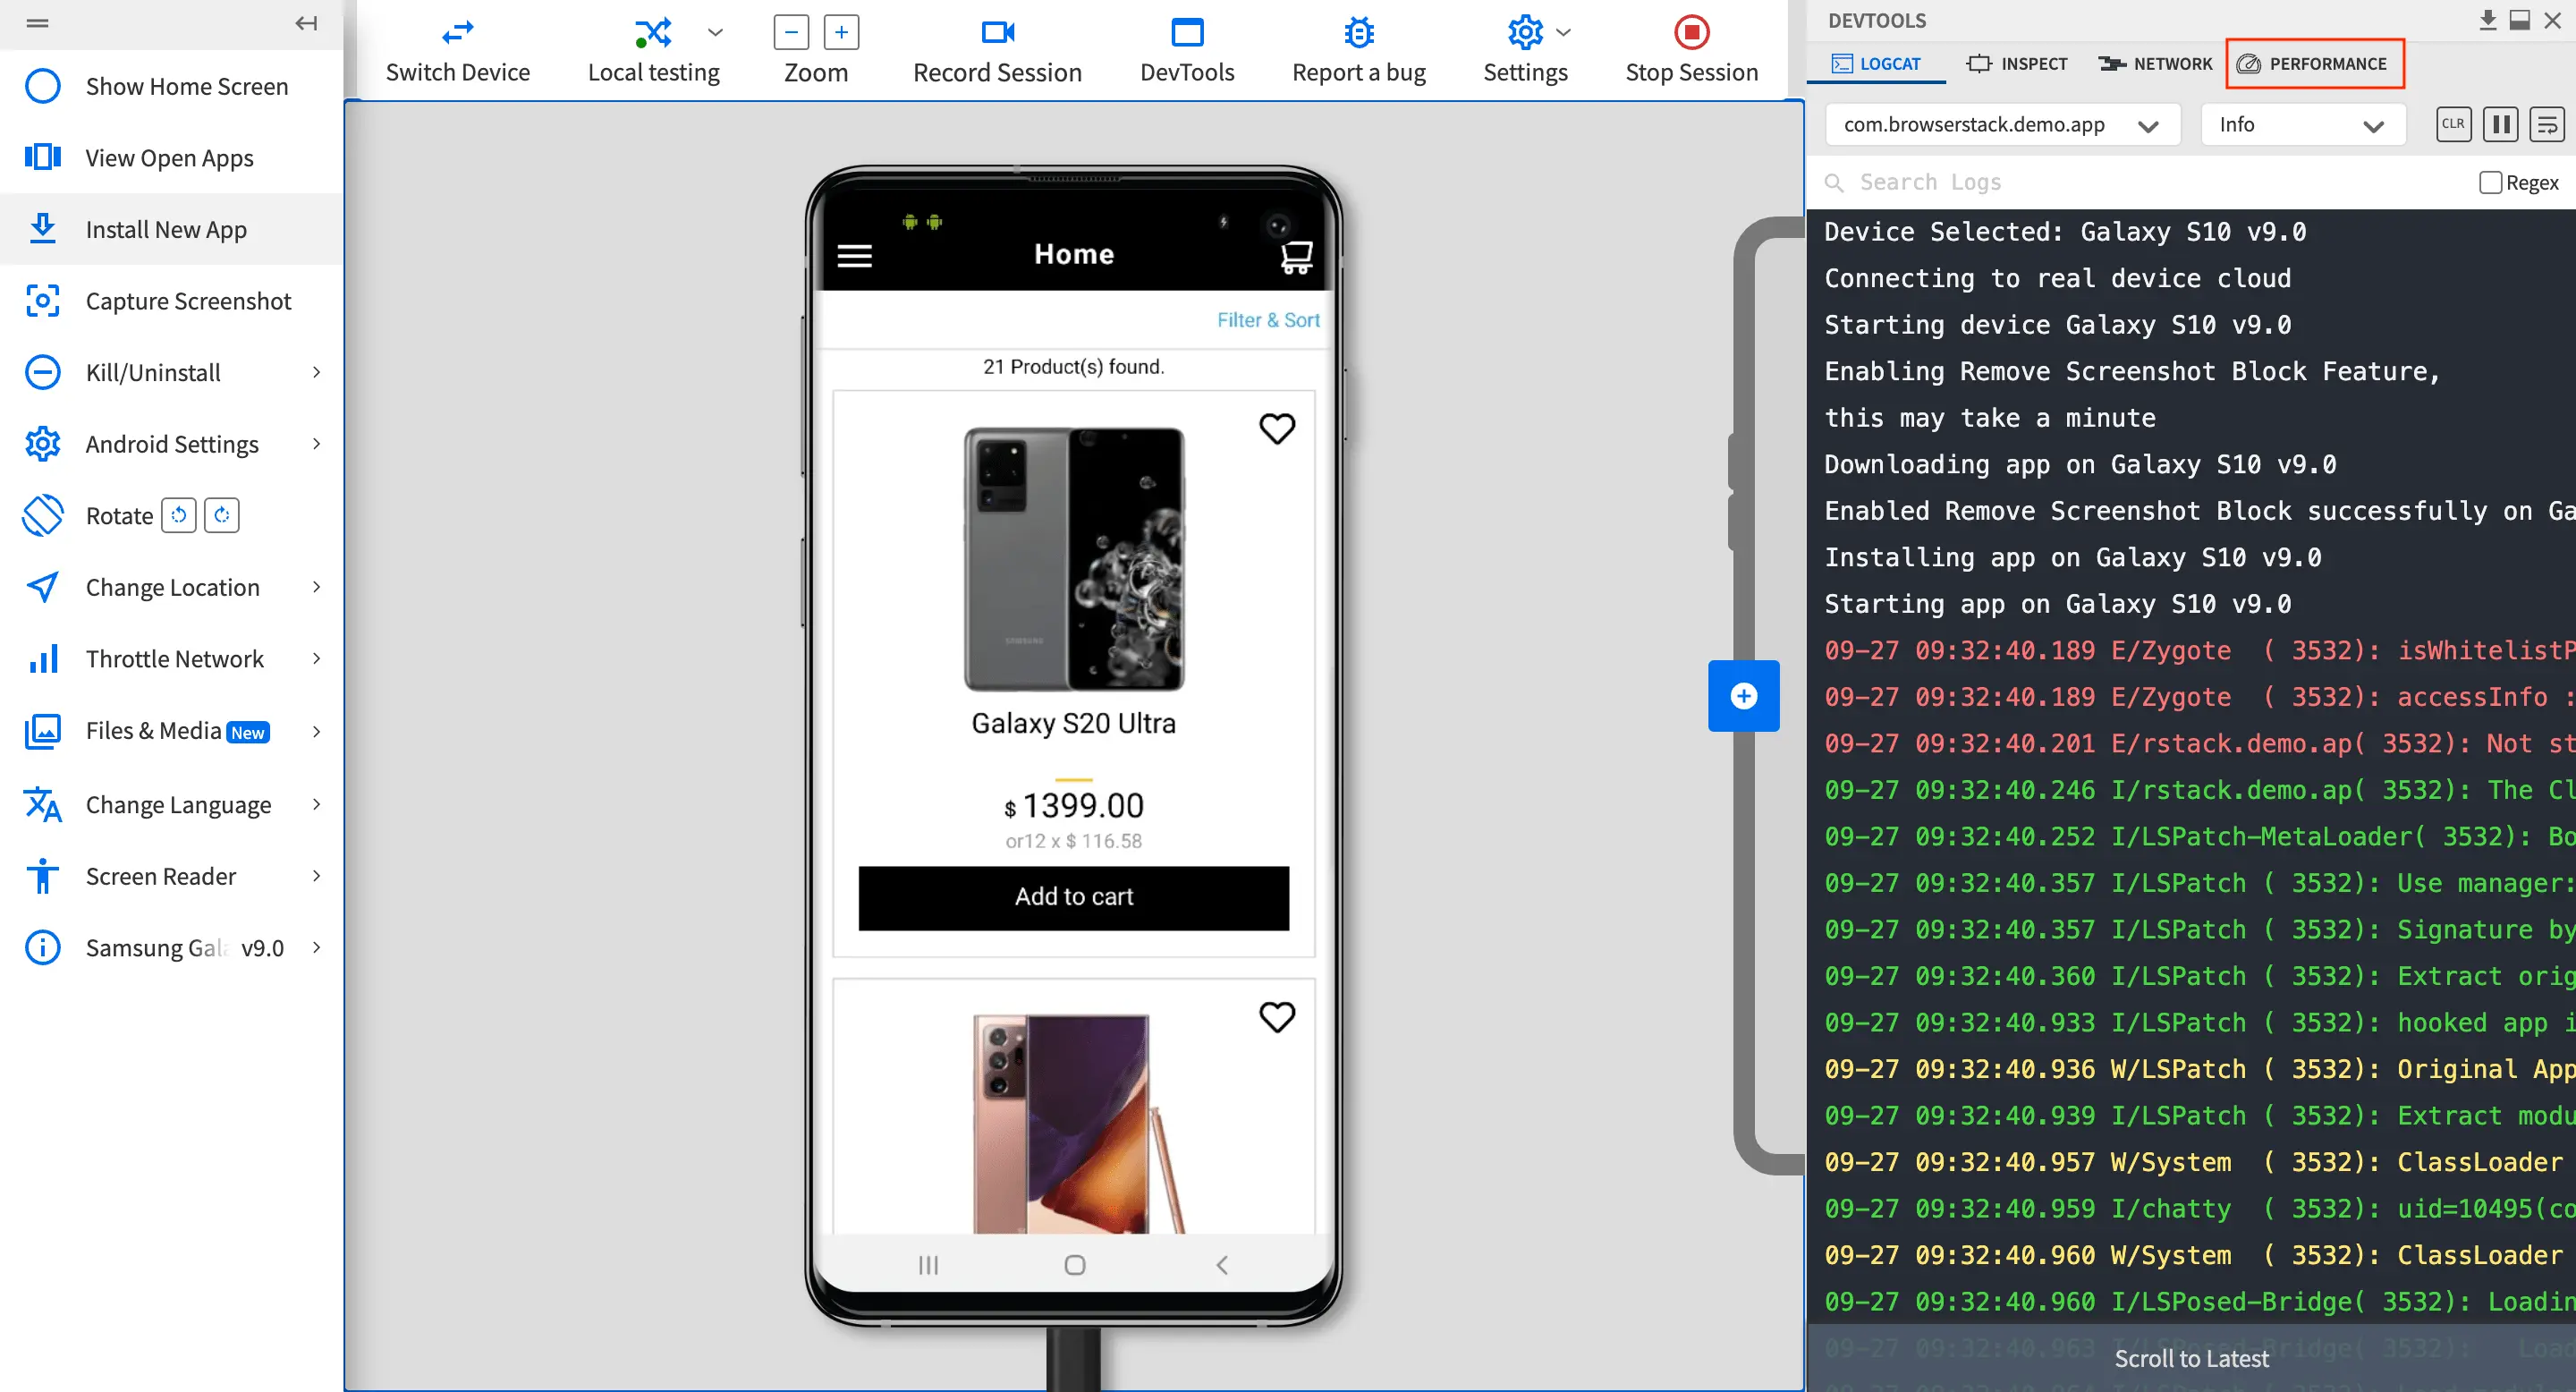
- If you are using an unsupported version, the PERFORMANCE tab displays a list of Android and iOS compatible devices. You can switch to a compatible device from the list.
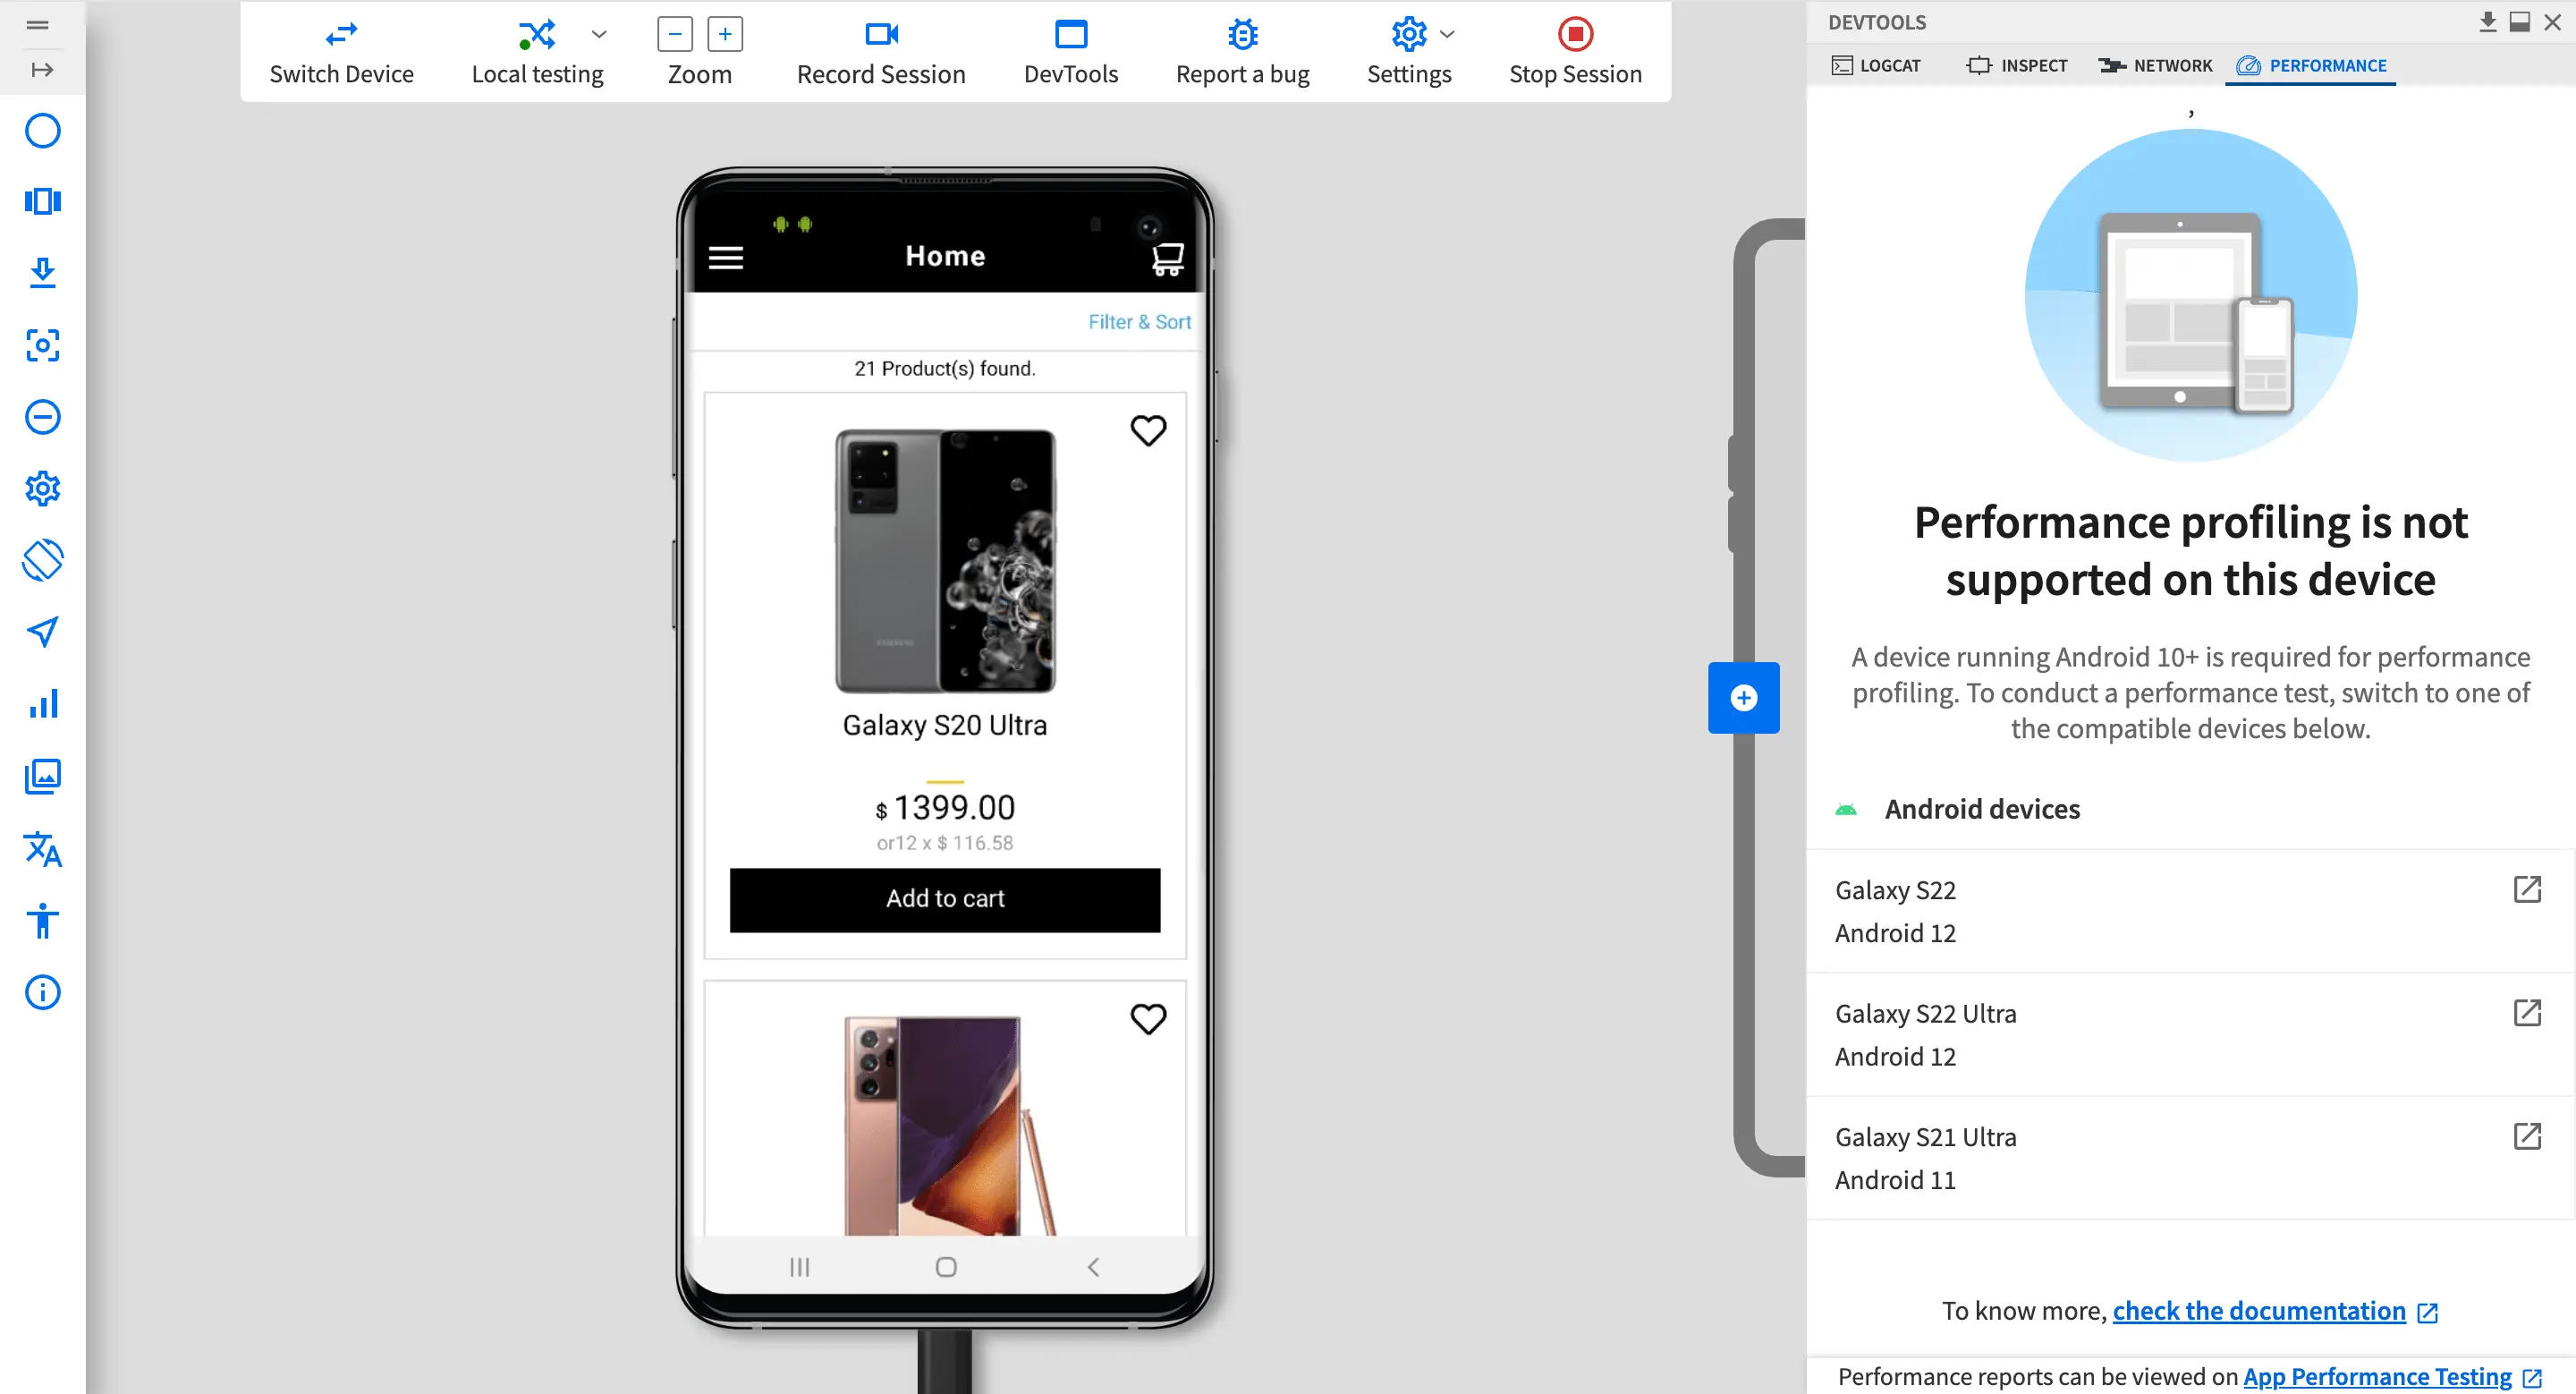 A dialog box appears prompting you to click Switch Device. A new session will then start for the new device you selected.
 - If required, before starting app profiling, click Sample Performance Report. A sample PDF of the app performance report will open in a new browser window. This lets you preview the insights you will gain from the profiling process.
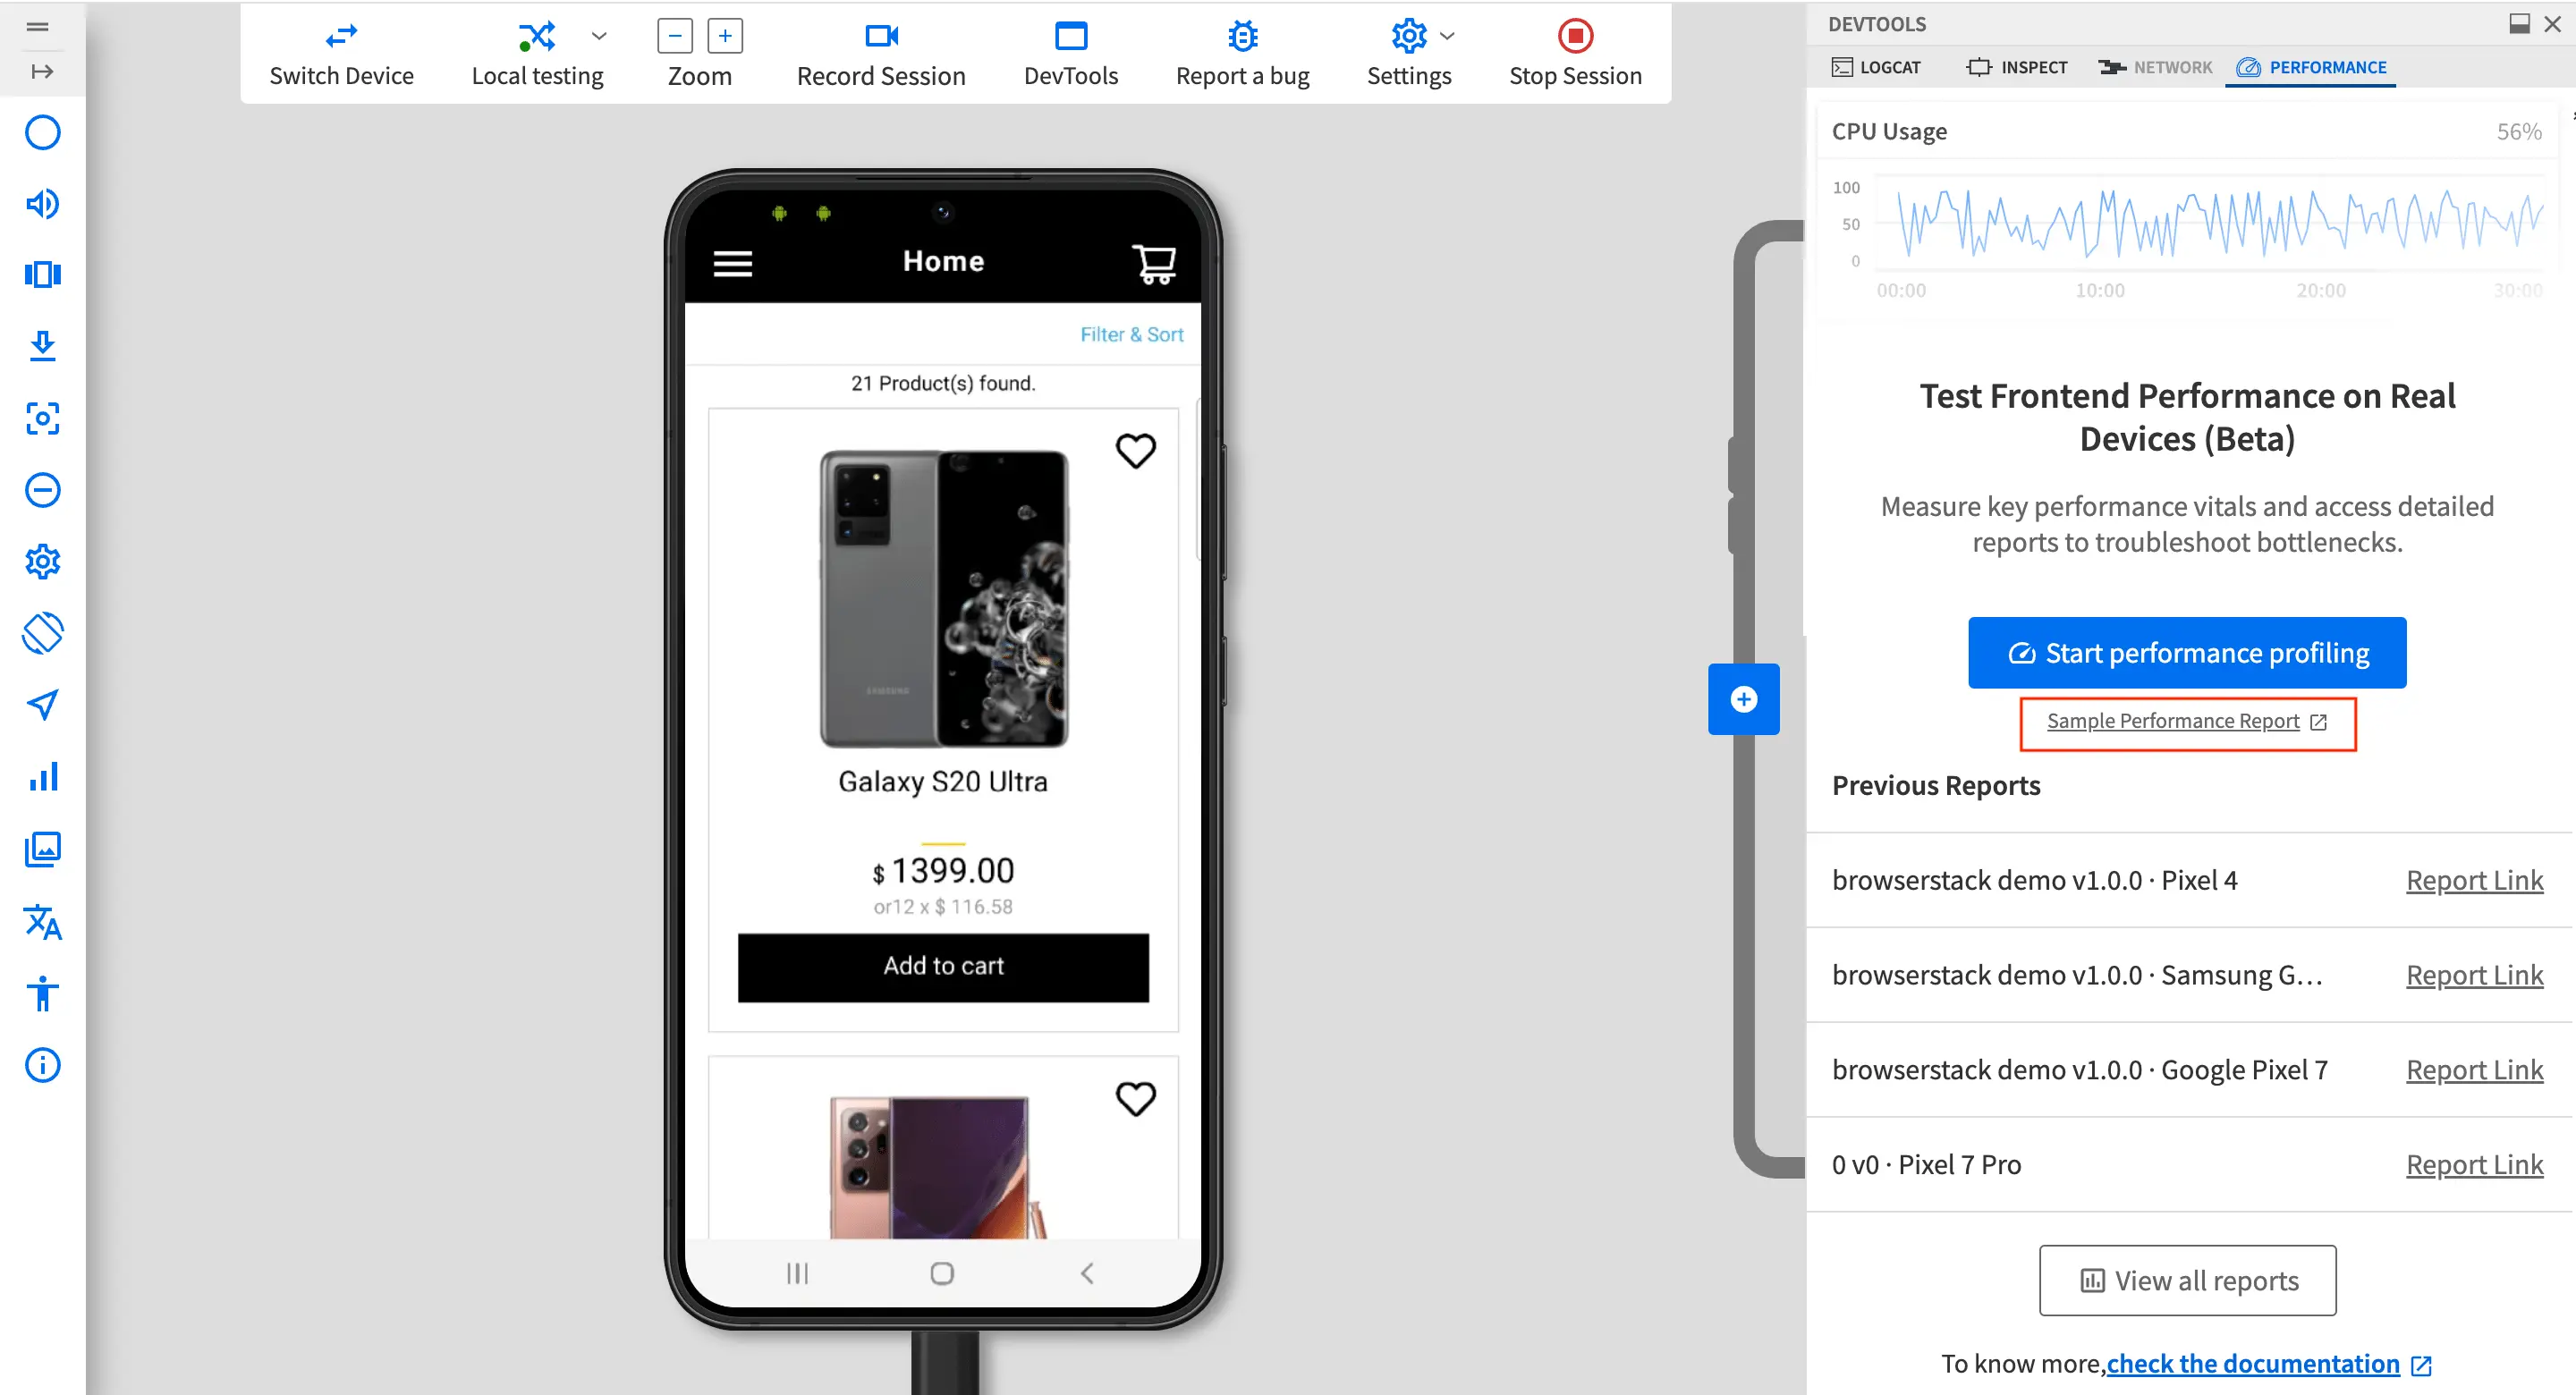
- Click Start performance profiling. The performance profiling of your app starts.
- Perform the user workflow on your app that you want to test.
As you interact with your app, App Performance analyzes the performance of your app during the interaction and visualizes the corresponding performance metrics in the PERFORMANCE tab. - After you complete a user workflow, click Stop profiling.

After you stop profiling, a report overview is displayed.
- To view the detailed report, the following options are shown:
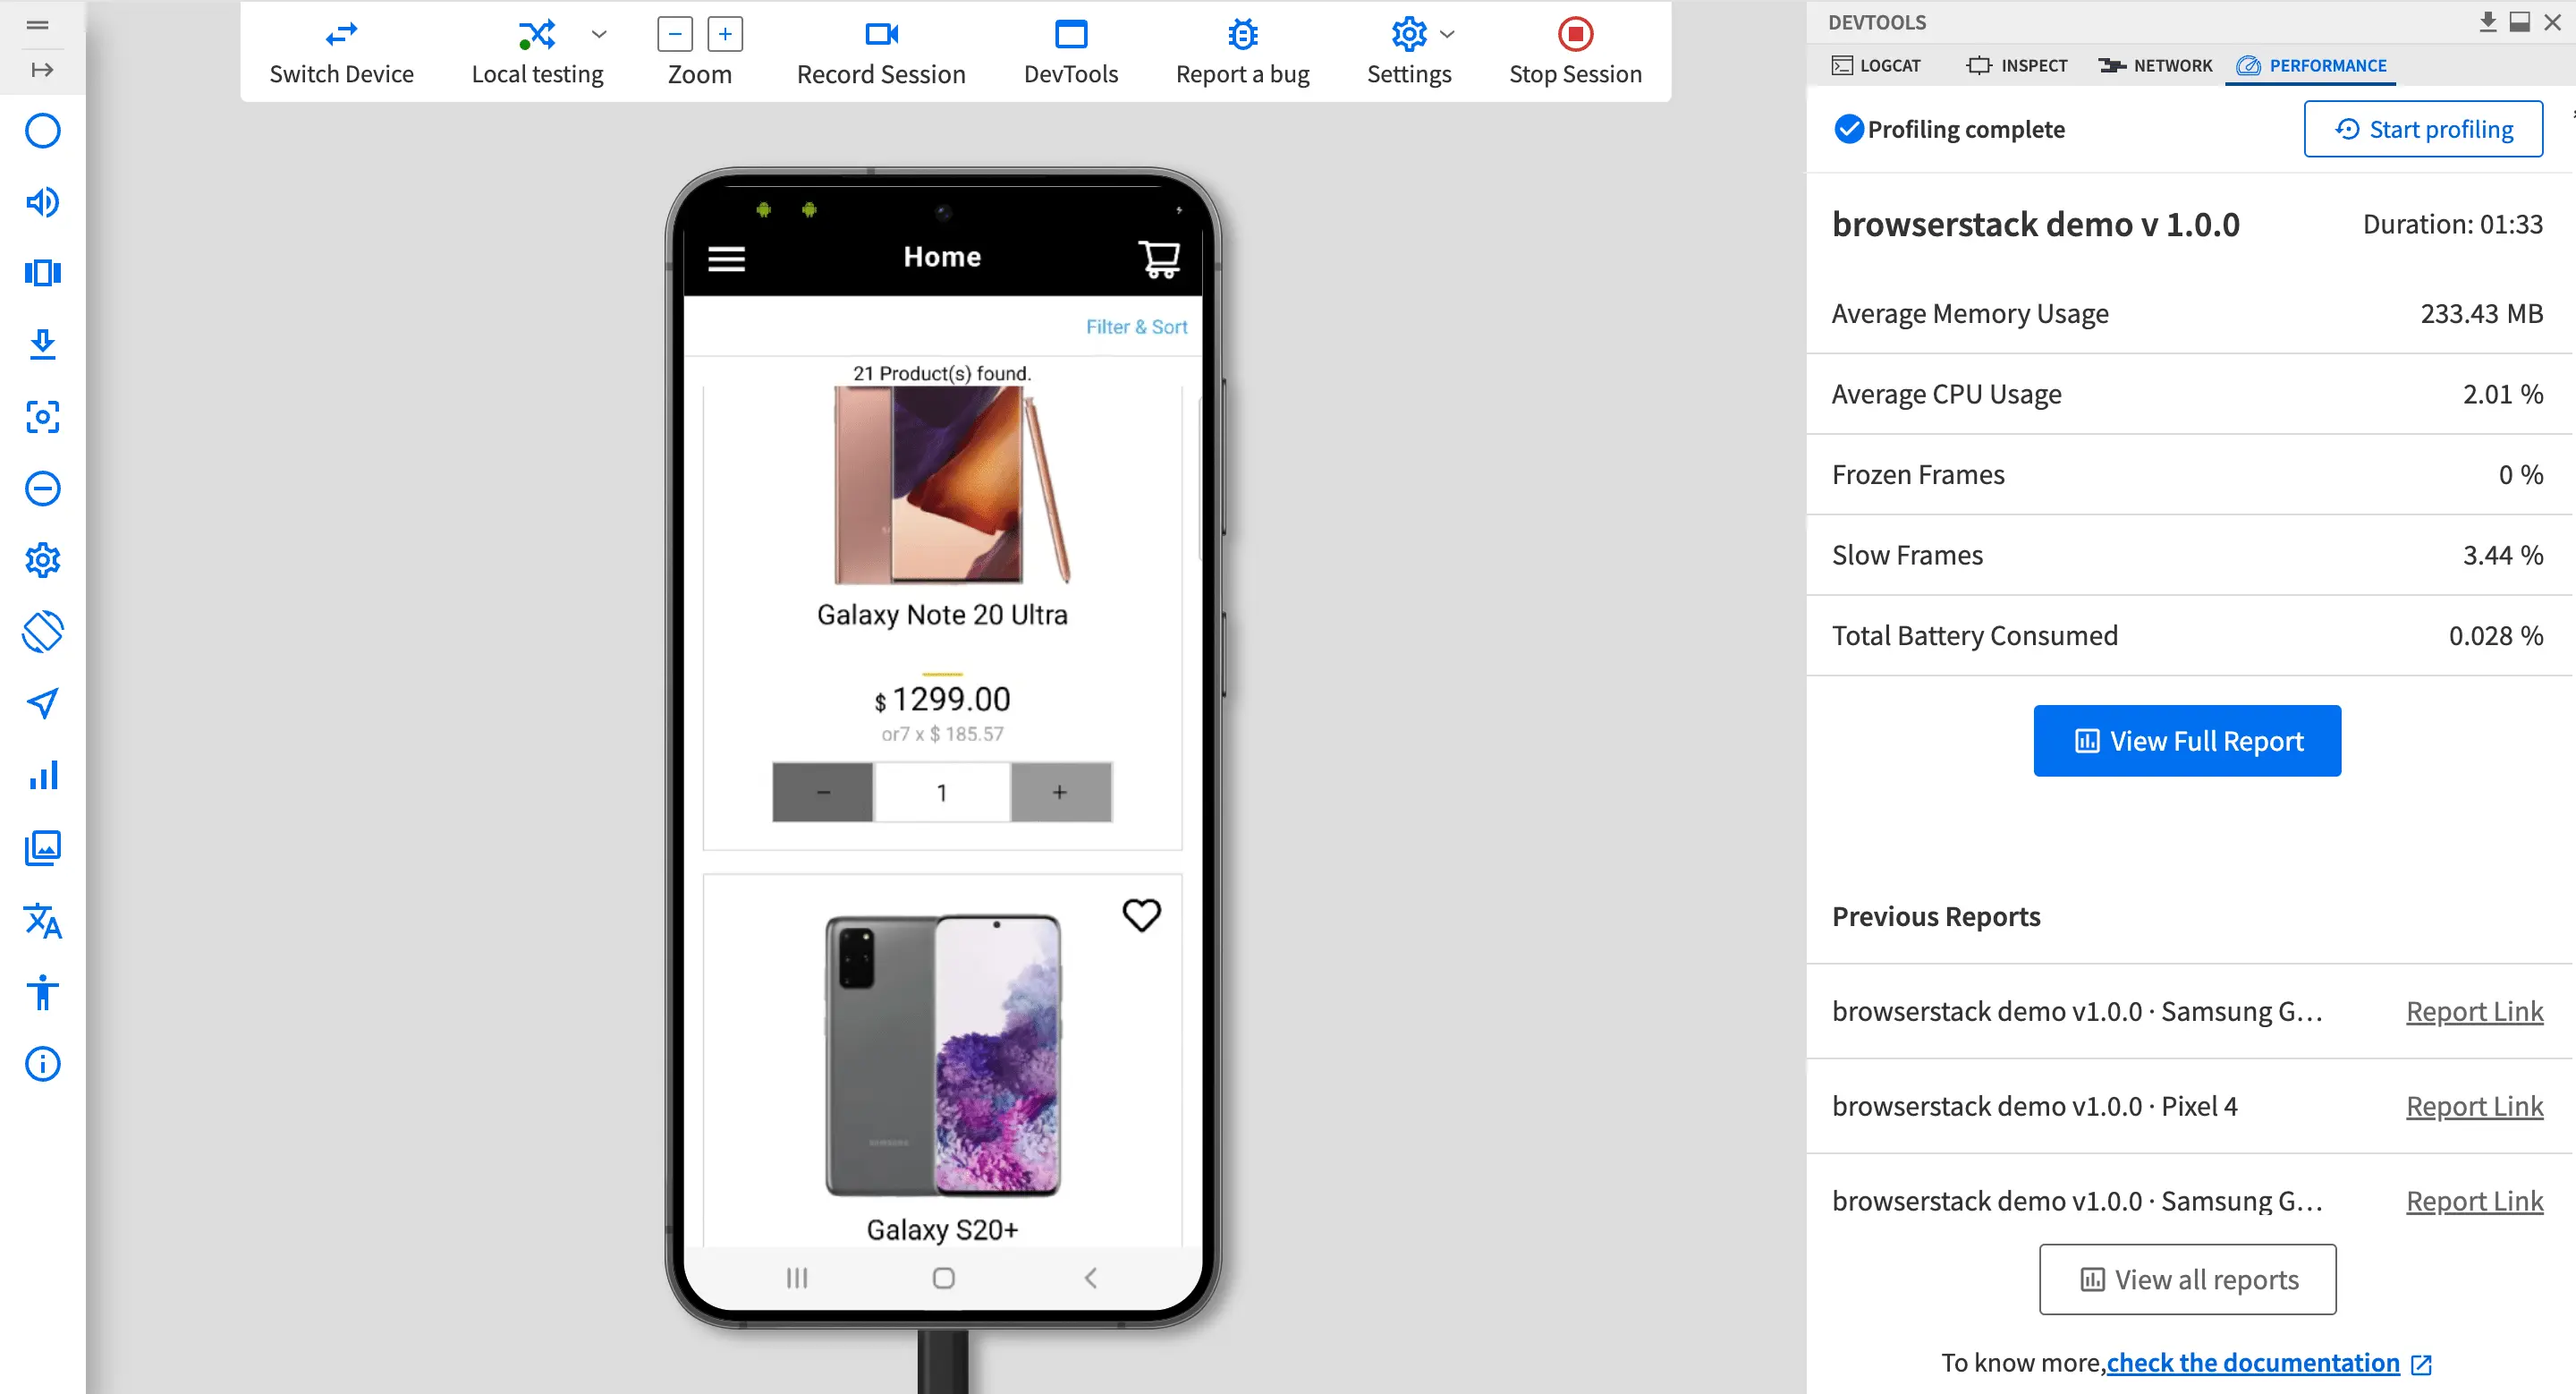
-
View Full Report: Opens the detailed report of the current performance test on the App Performance Testing dashboard.
-
Previous Reports: Shows the performance reports of the last five performance tests.
- View all reports: Opens the App Performance Testing dashboard. Lists reports of all the performance tests performed by you and the reports shared with you by your team.
Additionally, you can click the check the documentation link at the bottom to access the App Performance documents.
-
View Full Report: Opens the detailed report of the current performance test on the App Performance Testing dashboard.
Next steps
View reports on App Performance Testing dashboard
We're sorry to hear that. Please share your feedback so we can do better
Contact our Support team for immediate help while we work on improving our docs.
We're continuously improving our docs. We'd love to know what you liked
We're sorry to hear that. Please share your feedback so we can do better
Contact our Support team for immediate help while we work on improving our docs.
We're continuously improving our docs. We'd love to know what you liked
Thank you for your valuable feedback!