Android Memory Usage
The Memory Usage metric measures the memory used by the app during a session. It also highlights the average and maximum memory used (in MB) by the app in a session.
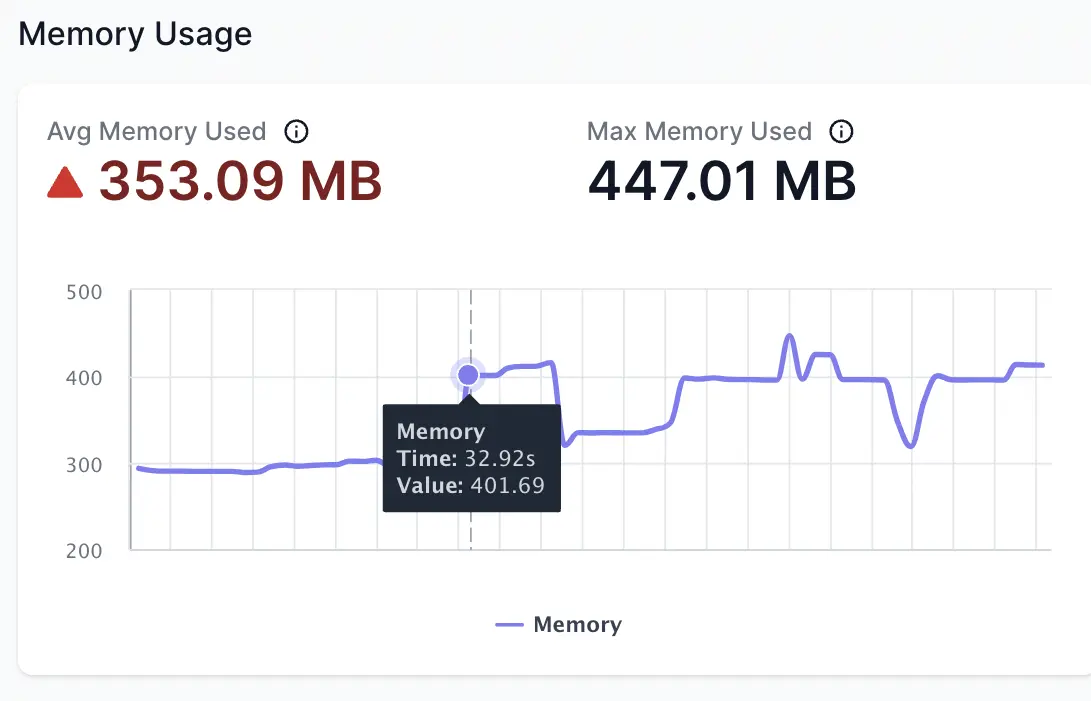
In the app performance report, go to the Memory Usage section to view the amount of memory consumed by the app in a session. In the graph, the axes represent the following:
- X-axis: Depicts the time (in seconds) elapsed since the start of the session. 0 on the X-axis represents the start of the profiling session.
- Y-axis: Depicts the amount of memory used by the app in MB at a particular time in the session since the session started.
Example
In the following graph, the app used 401.69 MB of memory at 32.92 s of the session since the session started. The graph also highlights the average memory used (353.09 MB) and the maximum memory used (447.01 MB) by the app during the session. The average memory is shown in red indicating that it is beyond the recommended threshold.
To identify the actions or workflows that caused excessive memory usage, you can play the session video. Alongside the video, a bar moves on the graph to help you identify the actions or workflows of your interest.

Impact on user experience
Excessive memory usage in an Android app can lead to sluggish performance, frozen screens, and app crashes, which can negatively impact the user experience. It’s essential to optimise memory usage to ensure smooth app performance and avoid user frustration.
Threshold guidelines
Recommended threshold for memory usage is less than 250 MB in a session.
If your app exceeds this threshold, App Performance Testing flags an issue in the performance report. To know more about the issue, see App performance issues - Memory Usage.
Recommendations
The following are the recommendations to improve Memory Usage:
- Use data structures that are optimized for memory usage, such as SparseArray and ArrayMap, instead of the traditional HashMap.
- Load data incrementally instead of loading all data at once.
- Bitmaps can consume a lot of memory, so it’s essential to manage them efficiently.
- Use the Memory Profiler to identify memory leaks and optimize memory usage
Related topics
We're sorry to hear that. Please share your feedback so we can do better
Contact our Support team for immediate help while we work on improving our docs.
We're continuously improving our docs. We'd love to know what you liked
We're sorry to hear that. Please share your feedback so we can do better
Contact our Support team for immediate help while we work on improving our docs.
We're continuously improving our docs. We'd love to know what you liked
Thank you for your valuable feedback!
