iOS Memory Usage
The Memory Usage metric measures the memory consumed by the app (in MB) during a session. It also shows the average and peak memory footprint (in MB) of the app in a session.
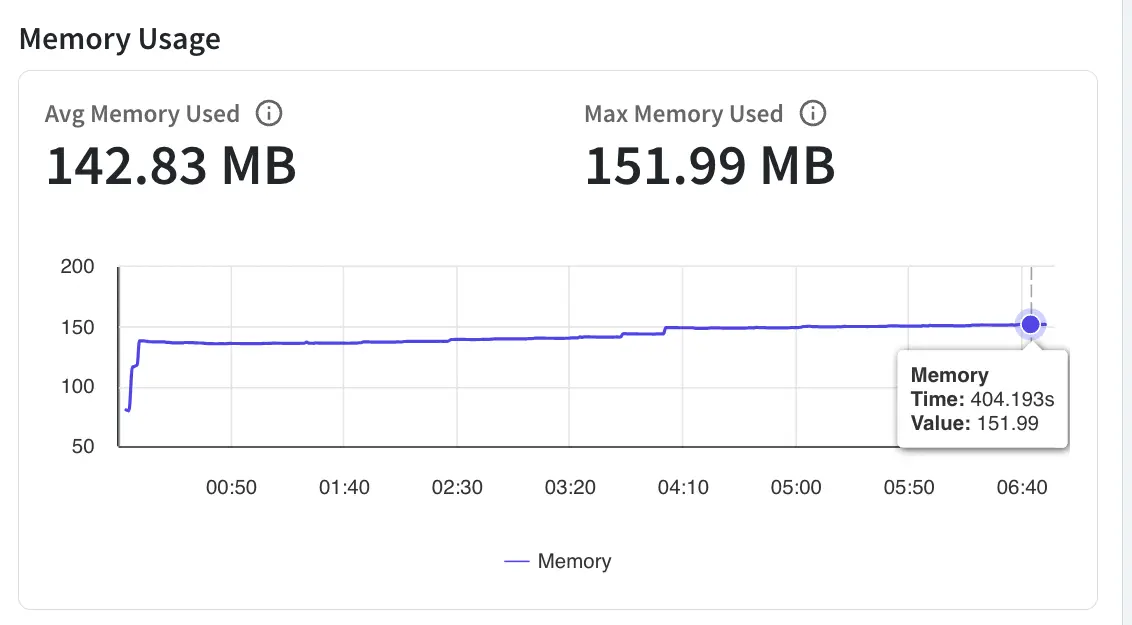
In the app performance report, go to the Memory Usage section to view the memory consumption by the app during a session. In the graph, the axes represent the following:
- X-axis: Depicts the time (in seconds) elapsed since the start of the session. 0 on the X-axis represents the start of the profiling session.
- Y-axis: Depicts the amount of memory consumed by the app at a particular time in a session since the session started.
Example
In the following graph, the app used 401.69 MB of memory at 32.92s of the session since the session started. The graph also shows that the average memory used by the app is 142.83 MB and the maximum memory used by the app is 151.99 MB during the session.
To identify the actions or workflows that caused excessive memory usage, you can play the session video. Alongside the video, a bar moves on the graph to help you identify the actions or workflows of your interest.

Impact on user experience
Excessive memory usage by an app can lead to sluggish performance, frozen screens, and app crashes, which can negatively impact the user experience. It’s essential to optimize memory usage to ensure smooth app performance and avoid user frustration.
Threshold guidelines
The recommended threshold for memory usage is less than 250 MB in a session.
If your app exceeds this threshold, App Performance Testing flags an issue in the performance report. To know more about the issue, see App performance issues - Memory Usage.
Recommendations
The following are the recommendations to improve Memory Usage:
- Optimize image usage: Use images that are the appropriate size for their intended use, and use image formats that are efficient, such as JPEG or PNG.
- Minimize use of storyboards: Use code to create your app’s user interface instead of relying on storyboards, which can increase memory usage.
- Use **Automatic Reference Count (ARC)**: Use ARC to manage your app’s memory usage automatically, reducing the risk of memory leaks.
- Implement data caching: Implement caching to reduce the amount of memory used by storing frequently accessed data, such as images, in memory for faster access.
- Use instruments: Use Xcode’s Instruments tool to identify and analyze memory usage in your app, allowing you to optimize memory usage and identify any potential memory leaks.
Related topics
We're sorry to hear that. Please share your feedback so we can do better
Contact our Support team for immediate help while we work on improving our docs.
We're continuously improving our docs. We'd love to know what you liked
We're sorry to hear that. Please share your feedback so we can do better
Contact our Support team for immediate help while we work on improving our docs.
We're continuously improving our docs. We'd love to know what you liked
Thank you for your valuable feedback!
