Debugging options
You can use various logging options to debug your failed test cases and fix them with ease.
If you are using the older dashboard, refer to the old dashboard documentation.
This document explains the capabilities for enabling the different debugging options that BrowserStack supports. Learn how to debug the running as well as the executed tests on BrowserStack.
Text logs are retained for 60 days, while all other logs mentioned on this page are available on the BrowserStack dashboard for 30 days. Logs are automatically deleted after their respective retention periods, starting from the day they are generated.
If you are using BrowserStack SDK, you can set the following capabilities in the configuration file:
Text logs
These are a comprehensive record of your test. They are used to identify all the steps executed in the test and troubleshoot errors for the failed step. Text Logs are accessible both from the Automate dashboard, as well as via our REST API to access text logs.
You don’t need to set any options for text logs, as these are enabled by default, and cannot be disabled.
Visual logs
These contain the screenshots that are auto-generated at every Selenium command that your code executes. Visual logs help with debugging the exact step and how the page was rendered when the failure occurred. They also help identify any layout or design related issues with your web pages on different browsers.
Visual logs are disabled by default. You can enable them by using the debug capability.
| Capability | Description | Expected values |
|---|---|---|
debug |
Enable visual logs | A string. Defaults to false true if you want to enable the visual logs. false otherwise. |
For example, this is how you enable visual logs:
Video logs
Every test run on the BrowserStack Selenium grid is recorded exactly as it is executed on our remote machine. This feature is particularly helpful whenever a browser test fails, so you can see the entire test in action. You can access these videos from the Automate dashboard for each session. You can also download the videos from the Dashboard or retrieve a link to download the video using our REST API.
Video logs are enabled by default. Note that video recording increases the text execution time slightly. You can disable them by using the video capability.
| Capability | Description | Expected values |
|---|---|---|
video |
Enable video recording | A string. Defaults to true true if you want to enable the video recording. false otherwise. |
For example, this is how you disable video logs:
Selenium logs
Selenium logs capture information about every Selenium command in your test script along with the browser preferences that you have configured. These logs provide insight into anything that might have led to your tests to fail. On the Automate dashboard, click the Other Logs tab to view the Selenium logs. You can also use the REST API to access Selenium logs.

Selenium logs are enabled by default. Set the seleniumLogs capability to false to disable Selenium logs.
| Capability | Description | Expected values |
|---|---|---|
seleniumLogs |
Enable Selenium logs | A string. Defaults to true. Set to false to disable Selenium logs. |
For example, this is how you disable Selenium logs:
Appium logs
The Appium server generates Appium logs, which contain a detailed record of your Appium test session execution. If your test session fails, the logs can assist you in troubleshooting any errors. On the Automate dashboard, click the Other Logs tab to view the Appium logs. Appium logs can also be accessed via the REST API.
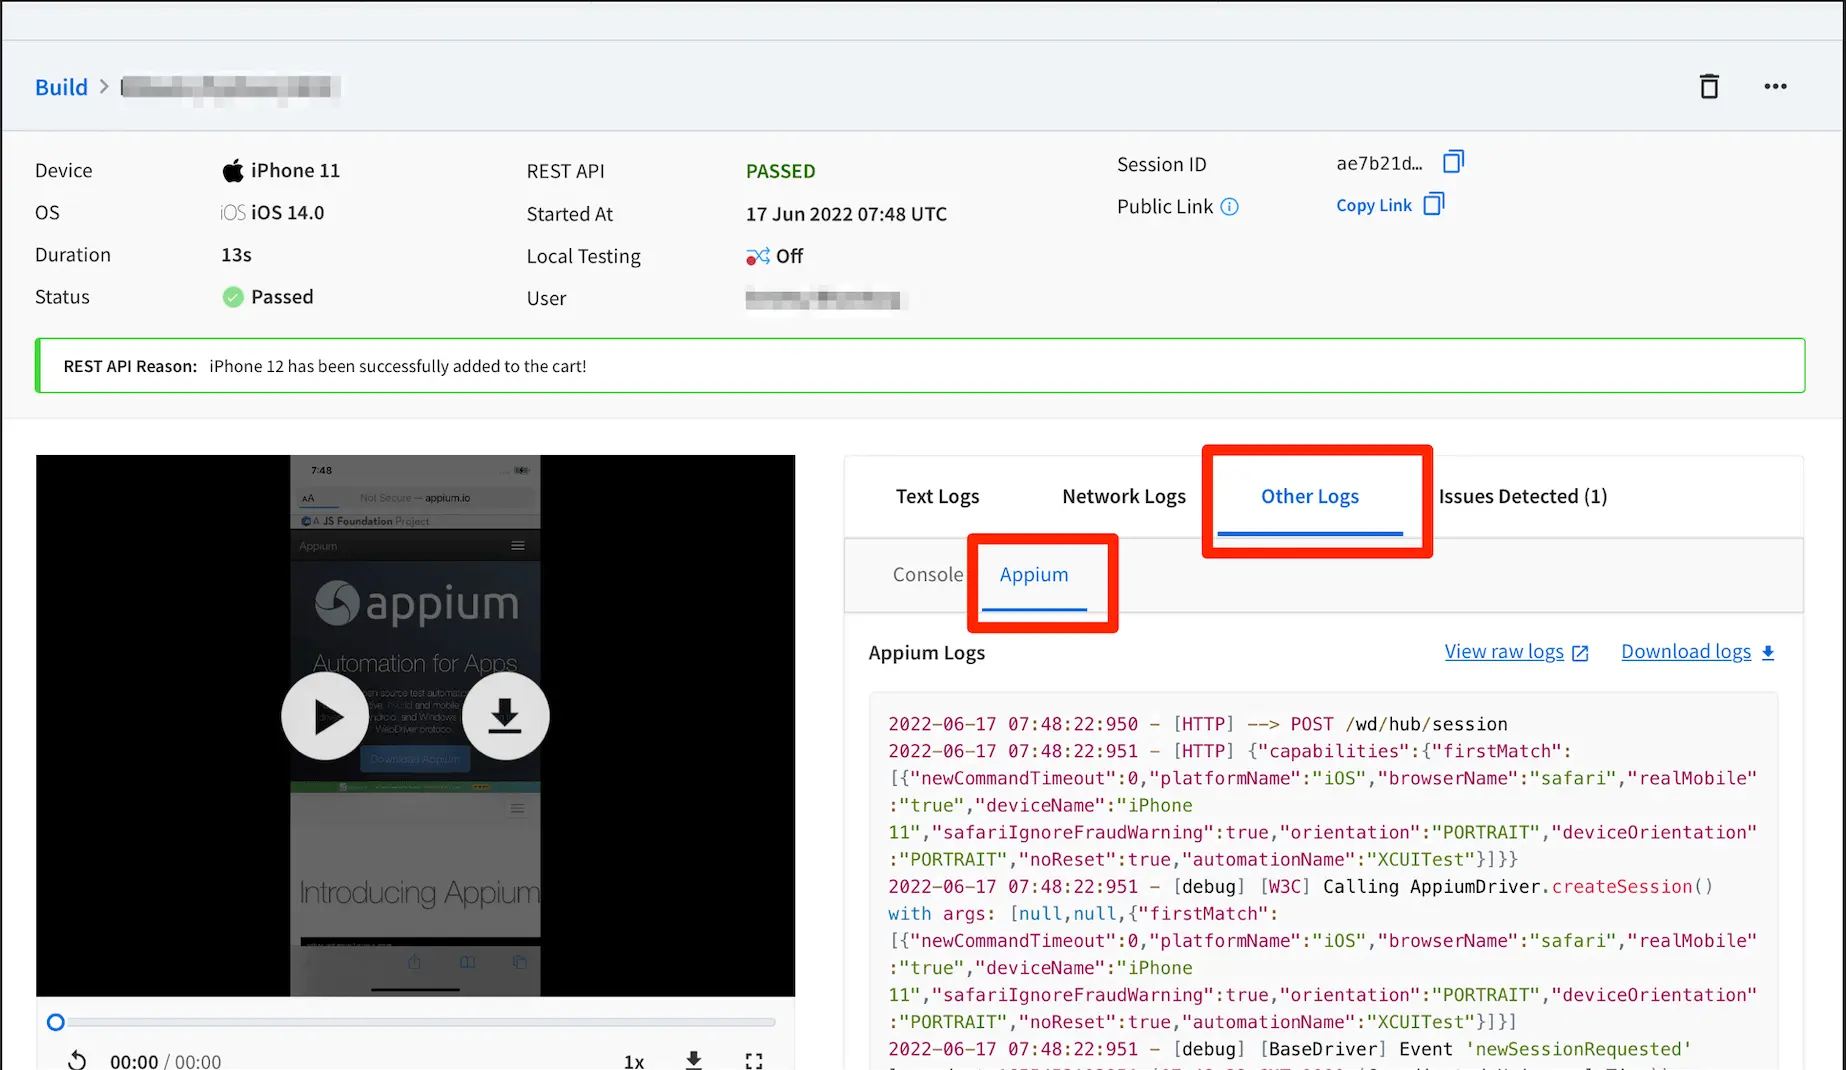
Appium logs are enabled by default. To disable Appium logs, set the appiumLogs capability to false.
Console logs
Console Logs capture the browser’s JS console output at various steps of the test to troubleshoot JavaScript issues. You can retrieve Console logs using both the Automate dashboard, as well as the REST API to access console logs. Currently, this works only for Chrome browsers, and we will roll this out to other browsers soon.
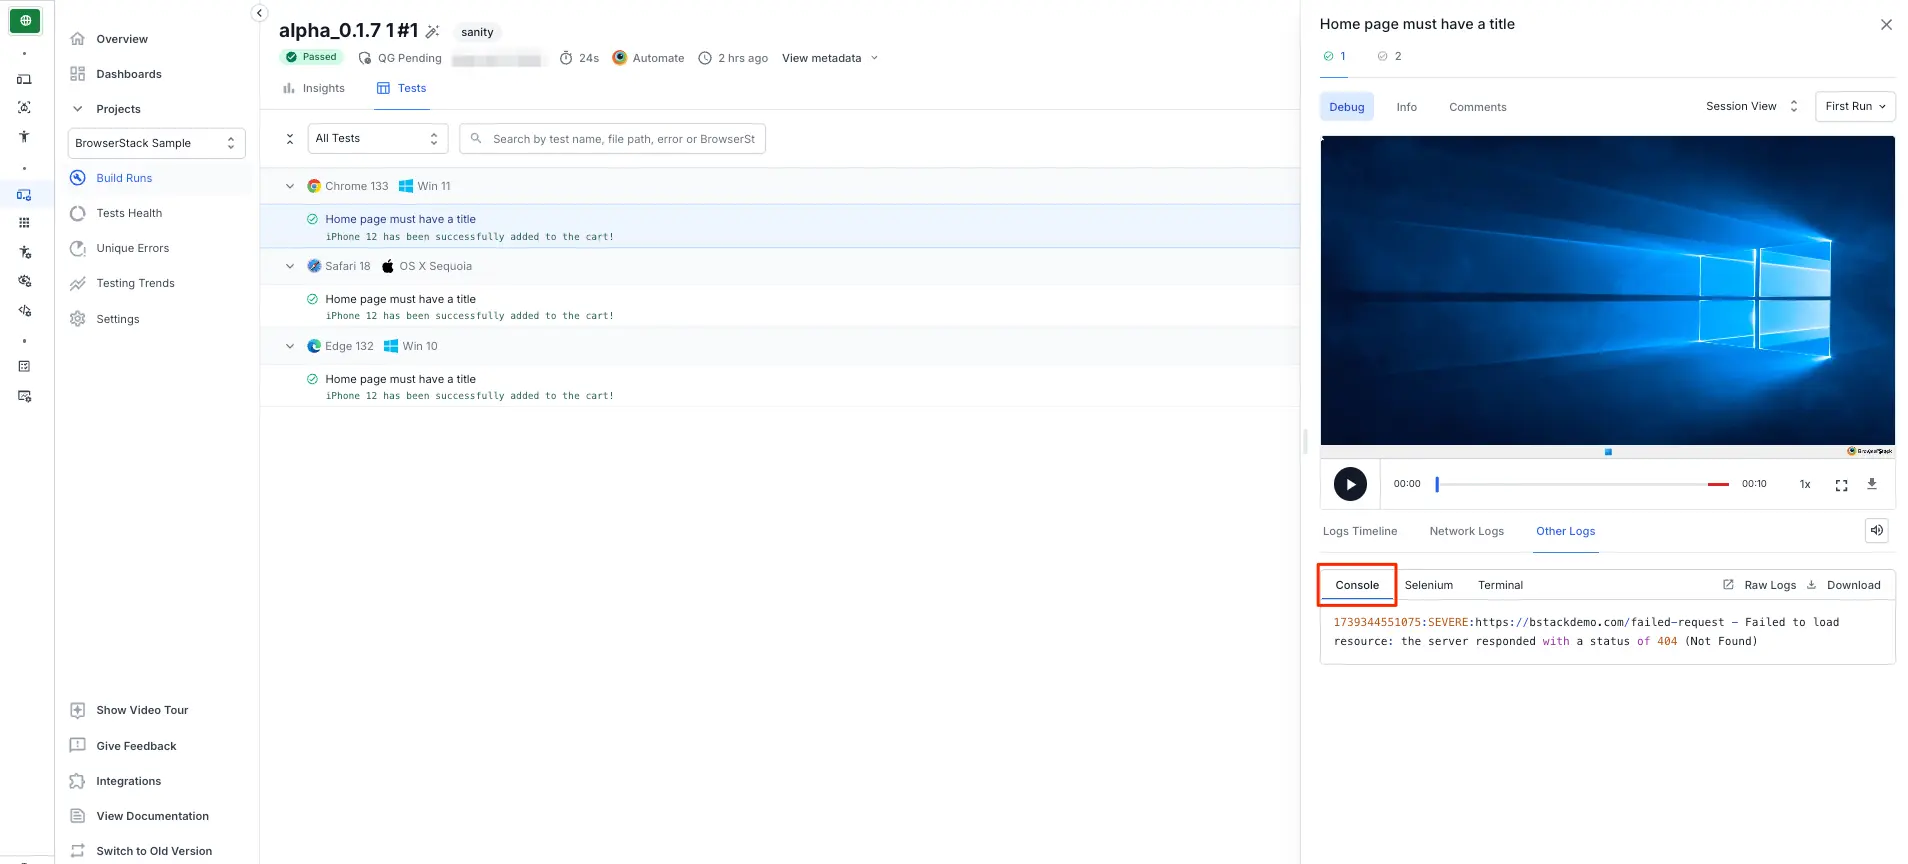
Console logs are enabled by default and are set to errors. You can disable them, or change verbosity options by using the console capability.
| Capability | Description | Expected values |
|---|---|---|
console |
Level of console logs to capture | A string. Defaults to errors disable to disable console logs. errors to capture errors. warnings to capture warnings and errors. info to capture info, warnings and errors. verbose to capture everything |
For example, this is how you disable console logs:
Console logs are not supported on macOS, iOS, and Safari. You can test this in the Capability Generator tool.
Network logs
Network Logs capture the browser’s performance data such as network traffic, latency, HTTP requests and responses in the HAR format. You can download network logs using both the Automate dashboard, as well as the REST API to access network logs. You can visualize HAR files using the HAR Viewer.
When you run a test without the Network log settings, the Network Logs tab on the dashboard shows the following message:
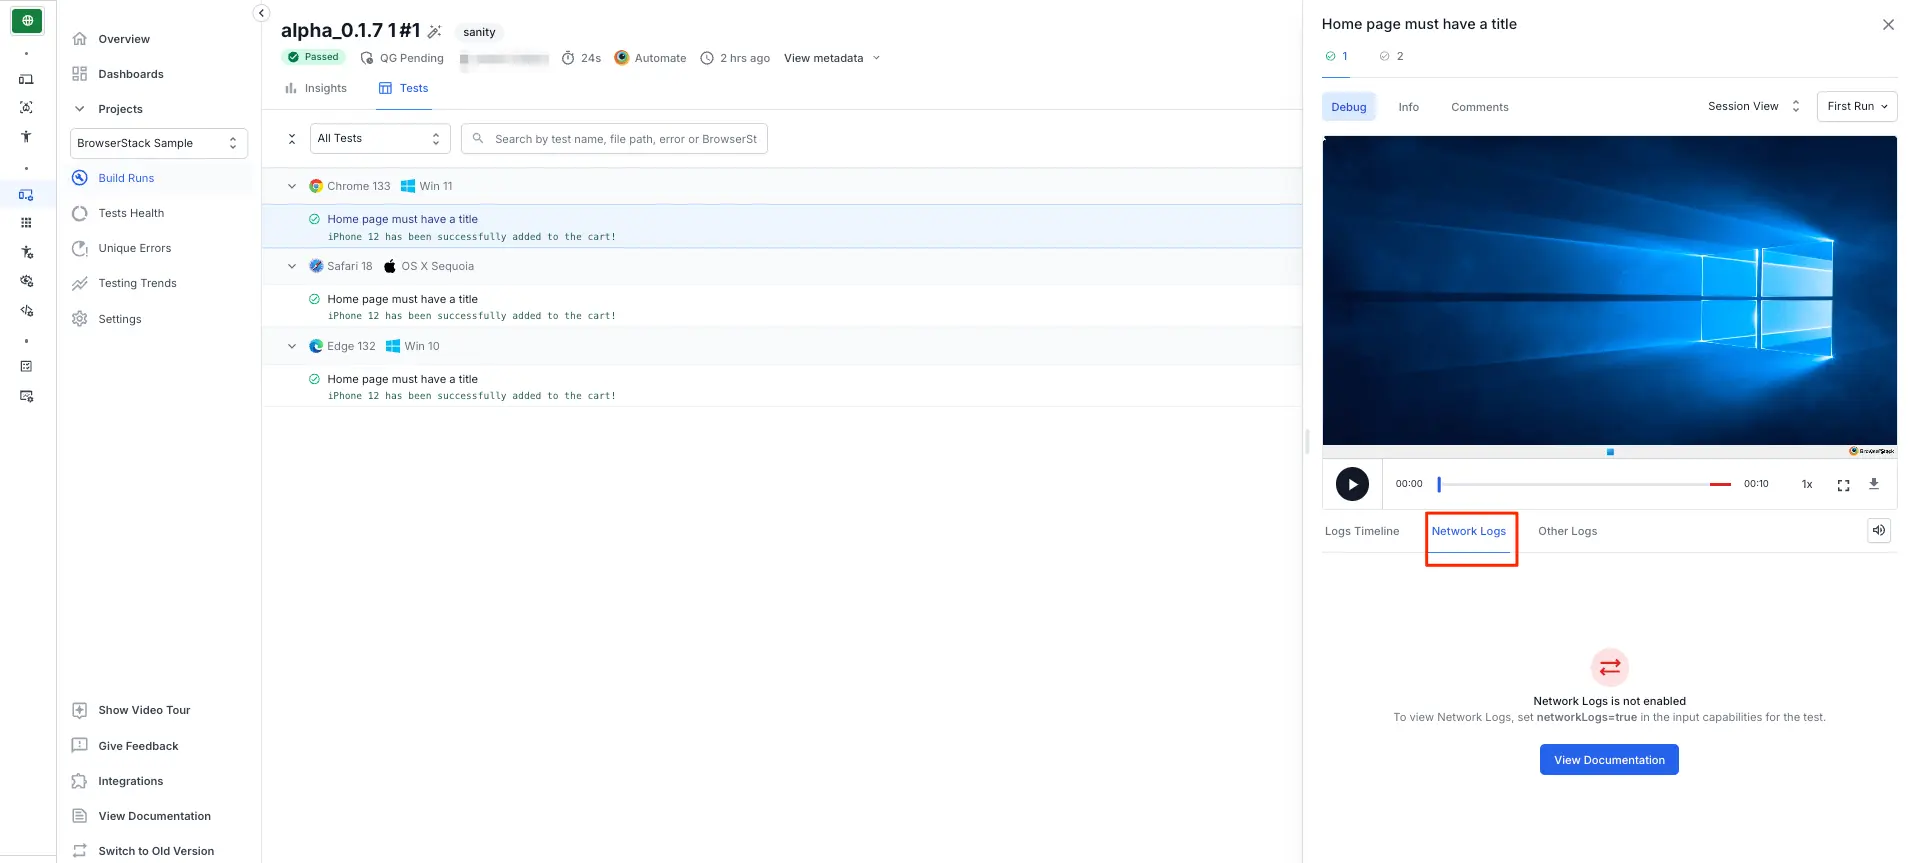
Enable Network Logs
To enable Network Logs use the networkLogs capability.
| Capability | Description | Expected values |
|---|---|---|
networkLogs |
Enable network logs | A string. Defaults to false true if you want to enable network logs. false otherwise. |
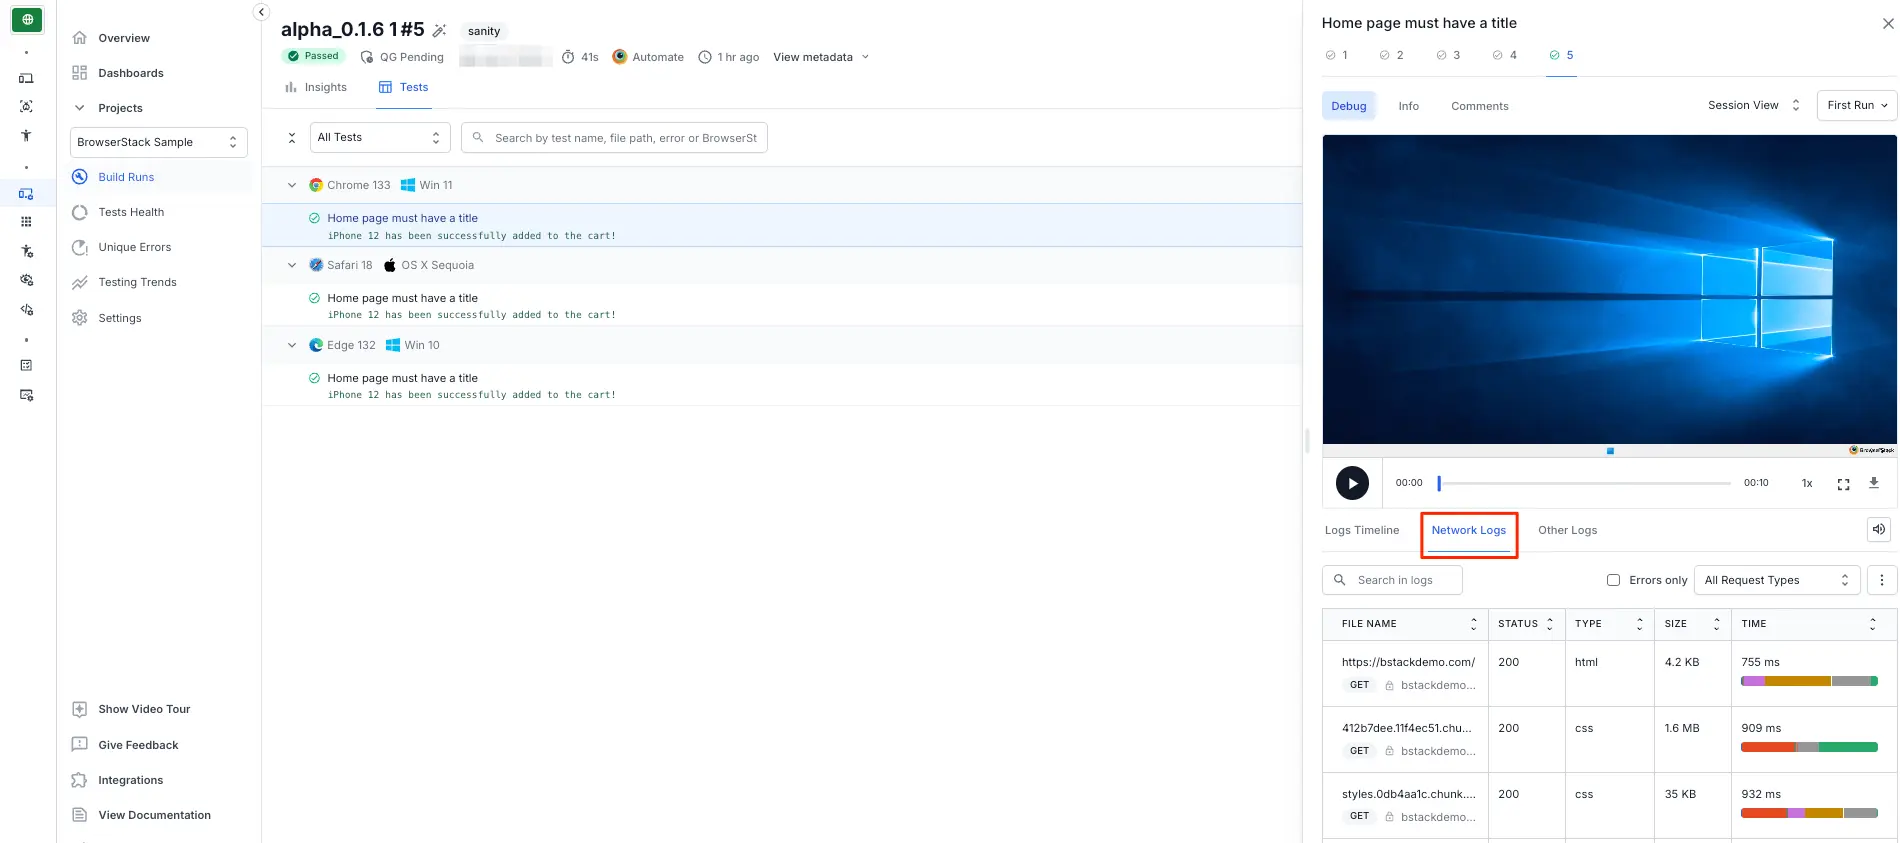
For example, this is how you enable network logs:
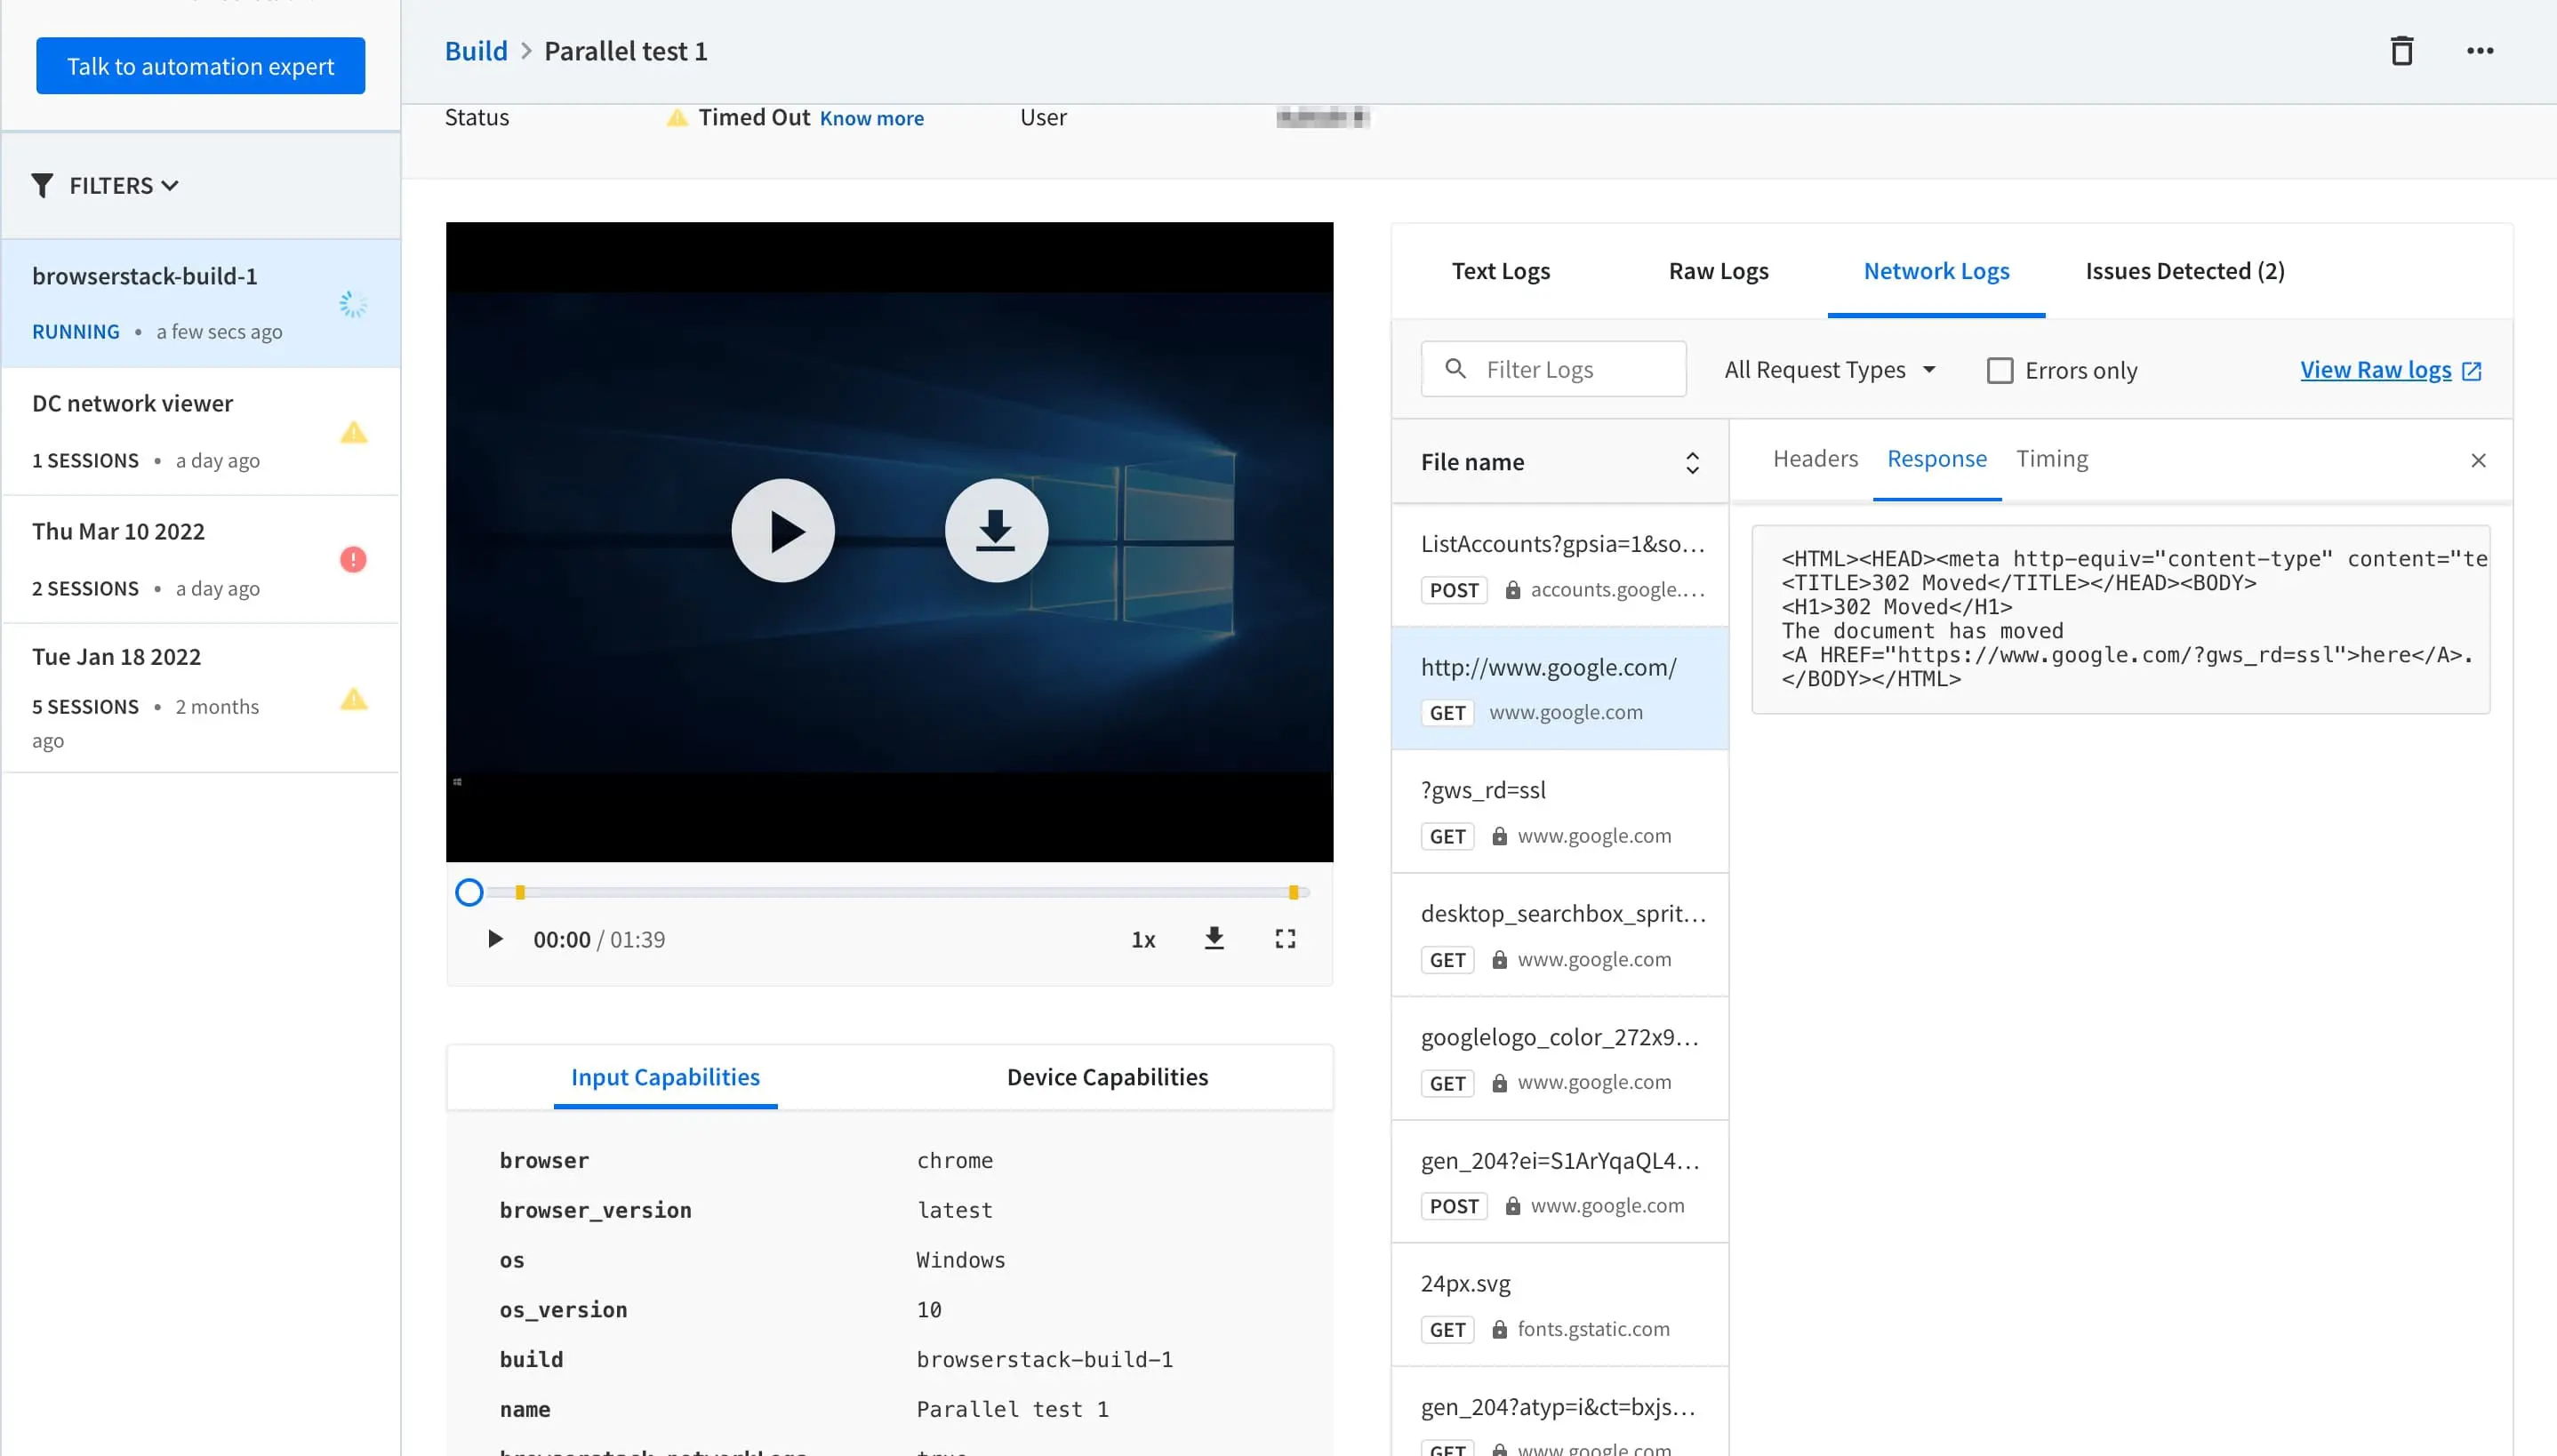
If you set the networkLogs capability to true, you will see the following result on the dashboard:
Network Log configurations
Apart from capturing the Network logs, you can also capture the request and response payload of your test session. You must set the networkLogsOptions capability and the captureContent configuration as true.
The response data is not captured for Android devices.
Use the following example code snippet to set the network log configurations:
The following table provides information about the capability:
| Capability | Configuration | Expected values |
|---|---|---|
networkLogsOptions |
captureContent |
Defaults to false. By default, network logs do not capture request and response payload. Set captureContent to trueNote: If the captureContent capability is set to false, the Response tab is not displayed. |
Handling excessive network logs in Automate sessions
When you run tests on BrowserStack Automate, each session generates detailed log data, including network logs. These logs are accessible through the Automate dashboard and REST APIs, and are often used for debugging test failures.
However, the volume of network logs can be excessively large, often exceeding 1 GB per session. This makes it difficult to open or analyze the logs using tools like standard text editors.
BrowserStack supports the following log filtering capabilities in Automate.
networkLogsExcludeHosts
For example, this will exclude capturing of logs for any requests made to google.com:
| Capability | Description | Value |
|---|---|---|
networkLogsExcludeHosts |
Use this capability to specify a list of certificate pinned hosts that should bypass BrowserStack MITM proxy while capturing network logs. By doing so, your tests can execute successfully while still capturing network logs for all other remaining hosts. | List of certificate pinned hosts (Array) or regex value (String) |
Only HTTPS URLs will be ignored for the specified hosts
networkLogsIncludeHosts
For example, this will capture logs only for network requests made to google.com
| Capability | Description | Value |
|---|---|---|
networkLogsIncludeHosts |
Use this capability if you wish to capture network logs only for specific hosts. Traffic for all other remaining hosts will bypass BrowserStack MITM proxy and won’t be captured in network logs. | List of hosts (Array) or regex value (String) |
Both HTTP and HTTPS URLs will be captured for the specified hosts
Network logs filtering is not supported for Internet Explorer versions 10 and 11.
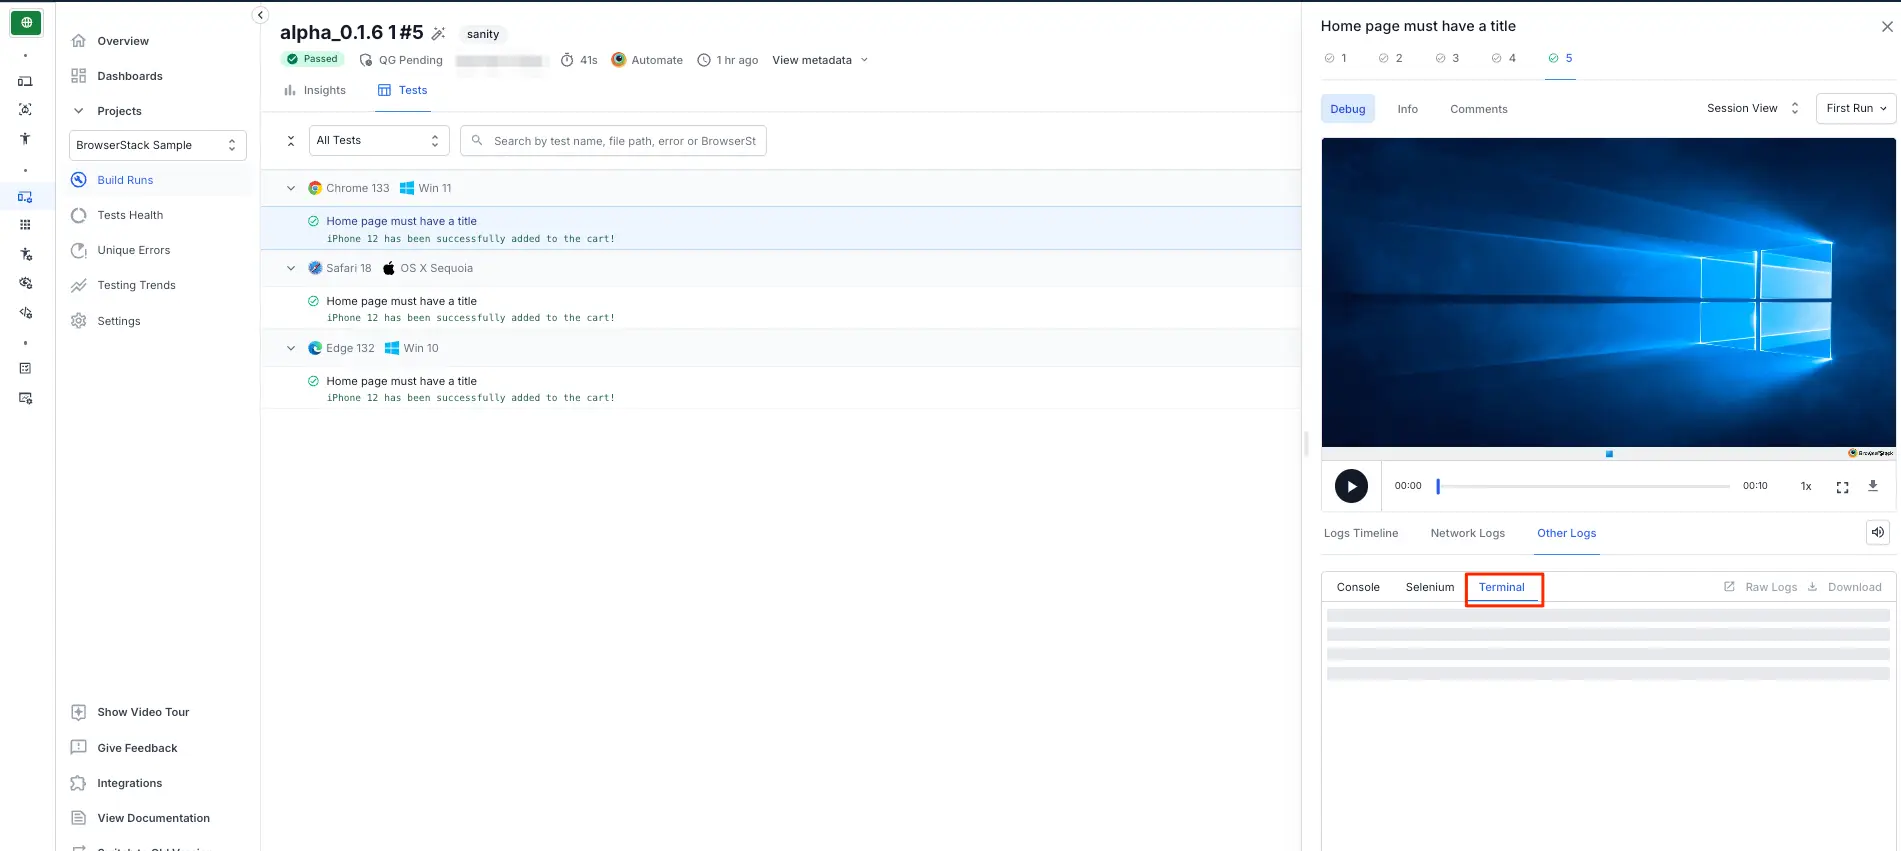
Terminal logs
BrowserStack allows you to upload and view your Selenium terminal logs using REST API. On the Automate dashboard, click the Other Logs tab to view the Selenium terminal logs.
You can upload the terminal logs for specific sessions or the entire build using the Session API or the Build API, respectively. When you upload terminal logs using build API, the terminal logs will be uploaded for all the sessions associated with the build.
For terminal logs, BrowserStack supports .txt, .json, .xml, and .log file formats. The maximum file size you can upload is 2 MB.
After you upload the logs, click the Other Logs tab on the Automate dashboard to view them.
Telemetry logs
BrowserStack provides access to the Selenium server in a standalone mode to run multiple tests in parallel, and each test may contain several requests. With Selenium 4 and OpenTelemetry support, you get greater visibility into the tracing of requests and event logs for each request. Tracing keeps track of the lifecycle of a request and stores information about the crucial operations performed by the request. You can use these insights to troubleshoot your sessions and improve performance.
Handling several requests, tracing logs, or troubleshooting any request failures becomes a complex task in the case of a distributed environment. For such complex scenarios, telemetry logs can be integrated with Jaeger to visualize and query the request traces. To learn how to visualize request traces using Jaeger, check out the Visualize telemetry logs using Jaeger section.
Supported Frameworks and OS
The following table lists the supported framework and OS where you can enable telemetry logs.
| Framework/OS | Version |
|---|---|
| Selenium | 4.0.0-alpha-6 and above |
| Windows | Windows 7 and above |
| macOS | OS X Sierra and above |
Enable Telemetry logs
Telemetry logs of your sessions in BrowserStack are disabled by default. To enable them, use the telemetryLogs capability and set it to true in your test script.
| Capability | Description | Expected values |
|---|---|---|
telemetryLogs |
Enable telemetry logs for a session. |
true, false Default: false
|
Use the following code snippets to set the telemetryLogs capability in your test script:
If you’re still unable to run your tests using BrowserStack SDK, validate your setup using the debug utility.
You can use either Selenium 4 or Selenium Legacy JSON to organize your tests.
BrowserStack SDK is a plug-n-play solution that takes care of all the integration steps for you. Using the BrowserStack SDK is the recommended integration method for your project. To know more, visit the SDK core concepts page.
Text logs
These are a comprehensive record of your test. They are used to identify all the steps executed in the test and troubleshoot errors for the failed step. Text Logs are accessible both from the Automate dashboard, as well as via our REST API to access text logs.
You don’t need to set any options for text logs, as these are enabled by default, and cannot be disabled.
Visual logs
These contain the screenshots that are auto-generated at every Selenium command that your code executes. Visual logs help with debugging the exact step and how the page was rendered when the failure occurred. They also help identify any layout or design related issues with your web pages on different browsers.
Visual logs are disabled by default. You can enable them by using the browserstack.debug capability.
| Capability | Description | Expected values |
|---|---|---|
browserstack.debug |
Enable visual logs | A string. Defaults to false true if you want to enable the visual logs. false otherwise. |
For example, this is how you enable visual logs:
// Enabling visual logs

DesiredCapabilities caps = new DesiredCapabilities();
caps.setCapability("browserstack.debug", "true");
// Enabling visual logs

var capabilities = {
 "browserstack.debug" : "true"
}
// Enabling visual logs

DesiredCapabilities caps = new DesiredCapabilities();
caps.SetCapability("browserstack.debug", "true");
# Enabling visual logs

$caps = array(
 "browserstack.debug" => "true"
);
# Enabling visual logs

capabilities = {
 "browserstack.debug" : "true"
}
# Enabling visual logs

caps = Selenium::WebDriver::Remote::Capabilities.new
caps["browserstack.debug"] = "true"
# Enabling visual logs

my $capabilities = {
 "browserstack.debug" => "true"
}
Video logs
Every test run on the BrowserStack Selenium grid is recorded exactly as it is executed on our remote machine. This feature is particularly helpful whenever a browser test fails, so you can see the entire test in action. You can access these videos from the Automate dashboard for each session. You can also download the videos from the Dashboard or retrieve a link to download the video using our REST API.
Video logs are enabled by default. Note that video recording increases the text execution time slightly. You can disable them by using the browserstack.video capability.
| Capability | Description | Expected values |
|---|---|---|
browserstack.video |
Enable video recording | A string. Defaults to true true if you want to enable the video recording. false otherwise. |
For example, this is how you disable video logs:
// Disabling video logs

DesiredCapabilities caps = new DesiredCapabilities();
caps.setCapability("browserstack.video", "false");
// Disabling video logs

var capabilities = {
 "browserstack.video" : "false"
}
// Disabling video logs

DesiredCapabilities caps = new DesiredCapabilities();
caps.SetCapability("browserstack.video", "false");
# Disabling video logs

$caps = array(
 "browserstack.video" => "false"
);
# Disabling video logs

capabilities = {
 "browserstack.video" : "false"
}
# Disabling video logs

caps = Selenium::WebDriver::Remote::Capabilities.new
caps["browserstack.video"] = "false"
# Disabling video logs

my $capabilities = {
 "browserstack.video" => "false"
}
Selenium logs
Selenium logs capture information about every Selenium command in your test script along with the browser preferences that you have configured. These logs provide insight into anything that might have led to your tests to fail. On the Automate dashboard, click the Other Logs tab to view the Selenium logs. You can also use the REST API to access Selenium logs.
Selenium logs are enabled by default. Set the browserstack.seleniumLogs capability to false to disable Selenium logs.
| Capability | Description | Expected values |
|---|---|---|
browserstack.seleniumLogs |
Enable Selenium logs | A string. Defaults to true. Set to false to disable Selenium logs. |
Appium logs
The Appium server generates Appium logs, which contain a detailed record of your Appium test session execution. If your test session fails, the logs can assist you in troubleshooting any errors. On the Automate dashboard, click the Other Logs tab to view the Appium logs. Appium logs can also be accessed via the REST API.
Appium logs are enabled by default. To disable Appium logs, set the browserstack.appiumLogs capability to false.
DesiredCapabilities desiredCapabilities = new DesiredCapabilities();
desiredCapabilities.setCapability("browserstack.appiumLogs", "false");
var capabilities = {
	'browserstack.appiumLogs': 'false',
}
DesiredCapabilities capability = new DesiredCapabilities();
capability.SetCapability("browserstack.appiumLogs", "false");
$capabilities = new DesiredCapabilities();
$capabilities->setCapability("browserstack.appiumLogs", "false");
desired_cap = {
	'browserstack.appiumLogs': 'false'
}
desired_caps = {
    'browserstack.appiumLogs': 'false'
}
Console logs
Console Logs capture the browser’s JS console output at various steps of the test to troubleshoot JavaScript issues. You can retrieve Console logs using both the Automate dashboard, as well as the REST API to access console logs. Currently, this works only for Chrome browsers, and we will roll this out to other browsers soon.
Console logs are enabled by default and are set to errors. You can disable them, or change verbosity options by using the browserstack.console capability.
| Capability | Description | Expected values |
|---|---|---|
browserstack.console |
Level of console logs to capture | A string. Defaults to errors disable to disable console logs. errors to capture errors. warnings to capture warnings and errors. info to capture info, warnings and errors. verbose to capture everything |
For example, this is how you disable console logs
// Disabling console logs

DesiredCapabilities caps = new DesiredCapabilities();
caps.setCapability("browserstack.console", "disable");
If you want to change the console logs level to info, this is how you do it:
// Setting console logs level to info

DesiredCapabilities caps = new DesiredCapabilities();
caps.setCapability("browserstack.console", "info");
// Disabling console logs

var capabilities = {
 "browserstack.console" : "disable"
}
If you want to change the console logs level to info, this is how you do it:
// Setting console logs level to info

var capabilities = {
 "browserstack.console" : "info"
}
// Disabling console logs

DesiredCapabilities caps = new DesiredCapabilities();
caps.SetCapability("browserstack.console", "disable");
If you want to change the console logs level to info, this is how you do it:
// Setting console logs level to info

DesiredCapabilities caps = new DesiredCapabilities();
caps.SetCapability("browserstack.console", "info");
# Disabling console logs

$caps = array(
 "browserstack.console" => "disable"
);
If you want to change the console logs level to info, this is how you do it:
# Setting console logs level to info

$caps = array(
 "browserstack.console" => "info"
);
# Disabling console logs

capabilities = {
 "browserstack.console" : "disable"
}
If you want to change the console logs level to info, this is how you do it:
# Setting console logs level to info

capabilities = {
 "browserstack.console" : "info"
}
# Disabling console logs

caps = Selenium::WebDriver::Remote::Capabilities.new
caps["browserstack.console"] = "disable"
If you want to change the console logs level to info, this is how you do it:
# Setting console logs level to info

caps = Selenium::WebDriver::Remote::Capabilities.new
caps["browserstack.console"] = "info"
# Disabling console logs

my $capabilities = {
 "browserstack.console" => "disable"
}
If you want to change the console logs level to info, this is how you do it:
# Setting console logs level to info

my $capabilities = {
 "browserstack.console" => "info"
}
Network logs
Network Logs capture the browser’s performance data such as network traffic, latency, HTTP requests and responses in the HAR format. You can download network logs using both the Automate dashboard, as well as the REST API to access network logs. You can visualize HAR files using the HAR Viewer.
When you run a test without the Network log settings, the Network Logs tab on the dashboard shows the following message:
Enable Network Logs
To enable Network Logs use the browserstack.networkLogs capability.
| Capability | Description | Expected values |
|---|---|---|
browserstack.networkLogs |
Enable network logs | A string. Defaults to false true if you want to enable network logs. false otherwise. |
If you set the browserstack.networkLogs capability to true, you will see the following result on the dashboard:
Network Log configurations
Apart from capturing the Network logs, you can also capture the request and response payload of your test session. You need to set the browserstack.networkLogsOptions capability to true along with setting the captureContent configuration as true.
Use the following example code snippet to set the network log configurations:
DesiredCapabilities caps = new DesiredCapabilities();
HashMap<String, Boolean> networkLogsOptions = new HashMap<>();
networkLogsOptions.put("captureContent", true);
caps.setCapability("browserstack.networkLogs", true);
caps.setCapability("browserstack.networkLogsOptions", networkLogsOptions);
var capabilities = {
 "browserstack.networkLogs" : "true",
 "browserstack.networkLogsOptions": {
   "captureContent": "true"
 }
}
DesiredCapabilities caps = new DesiredCapabilities();
Dictionary<string, bool> networkLogsOptions = new Dictionary<string, bool>();
networkLogsOptions.Add("captureContent", "true");
caps.SetCapability("browserstack.networkLogs", "true");
caps.SetCapability("browserstack.networkLogsOptions", networkLogsOptions);
$caps = array(
 "browserstack.networkLogs" => "true",
 "browserstack.networkLogsOptions" => array (
   "captureContent" => "true"
 )
);
"browserstack.networkLogs" : "true",
"browserstack.networkLogsOptions": {
    "captureContent": "true"
}
caps = Selenium::WebDriver::Remote::Capabilities.new
networkLogsOptions = Hash.new
networkLogsOptions["captureContent"] = "true"
caps["browserstack.networkLogs"] = "true"
caps["browserstack.networkLogsOptions"] = networkLogsOptions
my $capabilities = {
 "browserstack.networkLogs" => "true",
 "browserstack.networkLogsOptions" => {
   "captureContent" => "true"
 }
}
The following table provides information about the capability:
| Capability | Configuration | Expected values |
|---|---|---|
browserstack.networkLogsOptions |
captureContent |
Defaults to false. By default, network logs do not capture request and response payload. Set captureContent to trueNote: If the captureContent capability is set to false, the Response tab is not displayed. |
After you set the browserstack.networkLogsOptions capability, the Network Logs tab on the dashboard shows the following result:
Handling excessive network logs in Automate sessions
When you run tests on BrowserStack Automate, each session generates detailed log data, including network logs. These logs are accessible through the Automate dashboard and REST APIs, and are often used for debugging test failures.
However, the volume of network logs can be excessively large, often exceeding 1 GB per session. This makes it difficult to open or analyze the logs using tools like standard text editors.
BrowserStack supports the following log filtering capabilities in Automate.
browserstack.networkLogsExcludeHosts
| Capability | Description | Value |
|---|---|---|
networkLogsExcludeHosts |
Use this capability to specify a list of certificate pinned hosts that should bypass BrowserStack MITM proxy while capturing network logs. By doing so, your tests can execute successfully while still capturing network logs for all other remaining hosts. | List of certificate pinned hosts (Array) or regex value (String) |
For example, this will exclude capturing of logs for any requests made to api.example.com and google.com:
Example :
DesiredCapabilities capabilities = new DesiredCapabilities();
HashMap<String, Object> browserstackOptions = new HashMap<String, Object>();
browserstackOptions.put("networkLogsExcludeHosts", new String[]{"api.example.com", "google.com"});
capabilities.setCapability("bstack:options", browserstackOptions);
var capabilities = {
	'bstack:options' : {
		'networkLogsExcludeHosts': ['api.example.com', 'google.com'],
	}
}
AppiumOptions capabilities = new AppiumOptions();
Dictionary<string, object> browserstackOptions = new Dictionary<string, object>();
browserstackOptions.Add("networkLogsExcludeHosts", new[] {'api.example.com', 'google.com'});
capabilities.AddAdditionalCapability("bstack:options", browserstackOptions);
$caps = array(
	'bstack:options' => array(
		"networkLogsExcludeHosts" => ["api.example.com", "google.com"],
	),
)
desired_cap = {
	'bstack:options' : {
		'networkLogsExcludeHosts': ['api.example.com', 'google.com']
	}
}
capabilities = {
    'bstack:options' => {
        'networkLogsExcludeHosts': ['api.example.com', 'google.com']
    }
}
Instead of using an array, you can also pass a regex value as a string to dynamically match a list of hosts. For example, this will exclude capturing of logs for any requests made to example.com and its subdomains.
DesiredCapabilities capabilities = new DesiredCapabilities();
HashMap<String, Object> browserstackOptions = new HashMap<String, Object>();
browserstackOptions.put("networkLogsExcludeHosts", "^(.+\.)?example.com");
capabilities.setCapability("bstack:options", browserstackOptions);
var capabilities = {
	'bstack:options' : {
		'networkLogsExcludeHosts': '^(.+\.)?example.com',
	}
}
AppiumOptions capabilities = new AppiumOptions();
Dictionary<string, object> browserstackOptions = new Dictionary<string, object>();
browserstackOptions.Add("networkLogsExcludeHosts", "^(.+\.)?example.com");
capabilities.AddAdditionalCapability("bstack:options", browserstackOptions);
$caps = array(
	'bstack:options' => array(
		"networkLogsExcludeHosts" => "^(.+\.)?example.com",
	),
)
desired_cap = {
	'bstack:options' : {
		'networkLogsExcludeHosts': '^(.+\.)?example.com'
	}
}
capabilities = {
    'bstack:options' => {
        'networkLogsExcludeHosts': '^(.+\.)?example.com'
    }
}
| Capability | Description | Value |
|---|---|---|
browserstack.networkLogsExcludeHosts |
Use this capability to specify a list of certificate pinned hosts that should bypass BrowserStack MITM proxy while capturing network logs. By doing so, your tests can execute successfully while still capturing network logs for all other remaining hosts. | List of certificate pinned hosts (Array) or regex value (String) |
For example, this will exclude capturing of logs for any requests made to api.example.com and google.com:
Example :
DesiredCapabilities desiredCapabilities = new DesiredCapabilities();
desiredCapabilities.setCapability("browserstack.networkLogsExcludeHosts", new String[]{"api.example.com", "google.com"});
var capabilities = {
	'browserstack.networkLogsExcludeHosts': ['api.example.com', 'google.com'],
}
DesiredCapabilities capability = new DesiredCapabilities();
capability.SetCapability("browserstack.networkLogsExcludeHosts", new[] {'api.example.com', 'google.com'});
$capabilities = new DesiredCapabilities();
$capabilities->setCapability("browserstack.networkLogsExcludeHosts", ["api.example.com", "google.com"]);
desired_cap = {
	'browserstack.networkLogsExcludeHosts': ['api.example.com', 'google.com']
}
desired_caps = {
    'browserstack.networkLogsExcludeHosts': ['api.example.com', 'google.com']
}
Instead of using an array, you can also pass a regex value as a string to dynamically match a list of hosts. For example, this will exclude capturing of logs for any requests made to example.com and its subdomains.
DesiredCapabilities desiredCapabilities = new DesiredCapabilities();
desiredCapabilities.setCapability("browserstack.networkLogsExcludeHosts", "^(.+\.)?example.com");
var capabilities = {
	'browserstack.networkLogsExcludeHosts': '^(.+\.)?example.com',
}
DesiredCapabilities capability = new DesiredCapabilities();
capability.SetCapability("browserstack.networkLogsExcludeHosts", "^(.+\.)?example.com");
$capabilities = new DesiredCapabilities();
$capabilities->setCapability("browserstack.networkLogsExcludeHosts", "^(.+\.)?example.com");
desired_cap = {
	'browserstack.networkLogsExcludeHosts': '^(.+\.)?example.com'
}
desired_caps = {
    'browserstack.networkLogsExcludeHosts': '^(.+\.)?example.com'
}
Only HTTPS URLs will be ignored for the specified hosts
browserstack.networkLogsIncludeHosts
| Capability | Description | Value |
|---|---|---|
networkLogsIncludeHosts |
Use this capability if you wish to capture network logs only for specific hosts. Traffic for all other remaining hosts will bypass BrowserStack MITM proxy and won’t be captured in network logs. | List of hosts (Array) or regex value (String) |
For example, this will capture logs only for network requests made to api.example.com and google.com
DesiredCapabilities capabilities = new DesiredCapabilities();
HashMap<String, Object> browserstackOptions = new HashMap<String, Object>();
browserstackOptions.put("networkLogsIncludeHosts", new String[]{"api.example.com", "google.com"});
capabilities.setCapability("bstack:options", browserstackOptions);
var capabilities = {
	'bstack:options' : {
		'networkLogsIncludeHosts': ['api.example.com', 'google.com'],
	}
}
AppiumOptions capabilities = new AppiumOptions();
Dictionary<string, object> browserstackOptions = new Dictionary<string, object>();
browserstackOptions.Add("networkLogsIncludeHosts", new[] {'api.example.com', 'google.com'});
capabilities.AddAdditionalCapability("bstack:options", browserstackOptions);
$caps = array(
	'bstack:options' => array(
		"networkLogsIncludeHosts" => ["api.example.com", "google.com"],
	),
)
desired_cap = {
	'bstack:options' : {
		'networkLogsIncludeHosts': ['api.example.com', 'google.com']
	}
}
desired_caps = {
    'bstack:options' => {
        'networkLogsIncludeHosts': ['api.example.com', 'google.com']
    }
}
Instead of using an array, you can also pass a regex value as a string to dynamically match a list of hosts. For example, this will capture logs for any network requests made to example.com and its subdomains.
DesiredCapabilities capabilities = new DesiredCapabilities();
HashMap<String, Object> browserstackOptions = new HashMap<String, Object>();
browserstackOptions.put("networkLogsIncludeHosts", "^(.+\.)?example.com");
capabilities.setCapability("bstack:options", browserstackOptions);
var capabilities = {
	'bstack:options' : {
		'networkLogsIncludeHosts': '^(.+\.)?example.com',
	}
}
AppiumOptions capabilities = new AppiumOptions();
Dictionary<string, object> browserstackOptions = new Dictionary<string, object>();
browserstackOptions.Add("networkLogsIncludeHosts", "^(.+\.)?example.com");
capabilities.AddAdditionalCapability("bstack:options", browserstackOptions);
$caps = array(
	'bstack:options' => array(
		"networkLogsIncludeHosts" => "^(.+\.)?example.com",
	),
)
desired_cap = {
	'bstack:options' : {
		'networkLogsIncludeHosts': '^(.+\.)?example.com'
	}
}
desired_caps = {
    'bstack:options' => {
        'networkLogsIncludeHosts': '^(.+\.)?example.com'
    }
}
| Capability | Description | Value |
|---|---|---|
browserstack.networkLogsIncludeHosts |
Use this capability if you wish to capture network logs only for specific hosts. Traffic for all other remaining hosts will bypass BrowserStack MITM proxy and won’t be captured in network logs. | List of hosts (Array) or regex value (String) |
For example, this will capture logs only for network requests made to api.example.com and google.com
DesiredCapabilities desiredCapabilities = new DesiredCapabilities();
desiredCapabilities.setCapability("browserstack.networkLogsIncludeHosts", new String[]{"api.example.com", "google.com"});
var capabilities = {
	'browserstack.networkLogsIncludeHosts': ['api.example.com', 'google.com'],
}
DesiredCapabilities capability = new DesiredCapabilities();
capability.SetCapability("browserstack.networkLogsIncludeHosts", new[] {'api.example.com', 'google.com'});
$capabilities = new DesiredCapabilities();
$capabilities->setCapability("browserstack.networkLogsIncludeHosts", ["api.example.com", "google.com"]);
desired_cap = {
	'browserstack.networkLogsIncludeHosts': ['api.example.com', 'google.com']
}
desired_caps = {
    'browserstack.networkLogsIncludeHosts': ['api.example.com', 'google.com']
}
Instead of using an array, you can also pass a regex value as a string to dynamically match a list of hosts. For example, this will capture logs for any network requests made to example.com and its subdomains.
DesiredCapabilities desiredCapabilities = new DesiredCapabilities();
desiredCapabilities.setCapability("browserstack.networkLogsIncludeHosts", "^(.+\.)?example.com");
var capabilities = {
	'browserstack.networkLogsIncludeHosts': '^(.+\.)?example.com',
}
DesiredCapabilities capability = new DesiredCapabilities();
capability.SetCapability("browserstack.networkLogsIncludeHosts", "^(.+\.)?example.com");
$capabilities = new DesiredCapabilities();
$capabilities->setCapability("browserstack.networkLogsIncludeHosts", "^(.+\.)?example.com");
desired_cap = {
	'browserstack.networkLogsIncludeHosts': '^(.+\.)?example.com'
}
desired_caps = {
    'browserstack.networkLogsIncludeHosts': '^(.+\.)?example.com'
}
Both HTTP and HTTPS URLs will be captured for the specified hosts
Network logs filtering is not supported for Internet Explorer versions 10 and 11.
Terminal logs
BrowserStack allows you to upload and view your Selenium terminal logs using REST API. On the Automate dashboard, click the Other Logs tab to view the Selenium terminal logs.
You can upload the terminal logs for specific sessions or the entire build using the Session API or the Build API, respectively. When you upload terminal logs using build API, the terminal logs will be uploaded for all the sessions associated with the build.
For terminal logs, BrowserStack supports .txt, .json, .xml, and .log file formats. The maximum file size you can upload is 2 MB.
After you upload the logs, click the Other Logs tab on the Automate dashboard to view them.
Telemetry logs
BrowserStack provides access to the Selenium server in a standalone mode to run multiple tests in parallel, and each test may contain several requests. With Selenium 4 and OpenTelemetry support, you get greater visibility into the tracing of requests and event logs for each request. Tracing keeps track of the lifecycle of a request and stores information about the crucial operations performed by the request. You can use these insights to troubleshoot your sessions and improve performance.
Handling several requests, tracing logs, or troubleshooting any request failures becomes a complex task in the case of a distributed environment. For such complex scenarios, telemetry logs can be integrated with Jaeger to visualize and query the request traces. To learn how to visualize request traces using Jaeger, check out the Visualize telemetry logs using Jaeger section.
Supported Frameworks and OS
The following table lists the supported framework and OS where you can enable telemetry logs.
| Framework/OS | Version |
|---|---|
| Selenium | 4.0.0-alpha-6 and above |
| Windows | Windows 7 and above |
| macOS | OS X Sierra and above |
Enable Telemetry logs
Telemetry logs of your sessions in BrowserStack are disabled by default. To enable them, use the telemetryLogs capability and set it to true in your test script.
| Capability | Description | Expected values |
|---|---|---|
telemetryLogs |
Enable telemetry logs for a session. |
true, false Default: false
|
Use the following code snippets to set the telemetryLogs capability in your test script:
HashMap<String, Object> browserstackOptions = new HashMap<String, Object>();
// set the Selenium version to a minumum of 4.0.0-alpha-6
browserstackOptions.put("seleniumVersion", "4.0.0");
//enable the Telemetry logs
browserstackOptions.put("telemetryLogs", "true");
'bstack:options' : {
...
// set the Selenium version. Minimum value is 4.0.0-alpha-6
"seleniumVersion" : "4.0.0",
// enable the Telemetry logs
"telemetryLogs" : "true",
...
},
Dictionary<string, object> browserstackOptions = new Dictionary<string, object>();
// set the Selenium version. Minimum value is 4.0.0-alpha-6
browserstackOptions.Add("seleniumVersion", "4.0.0");
// enable the Telemetry logs
browserstackOptions.Add("telemetryLogs", "true");
desired_cap = {
    'bstack:options' : {
        # set the Selenium version. Minimum value is 4.0.0-alpha-6
        "seleniumVersion" : "4.0.0",
        # enable the Telemetry logs
        "telemetryLogs" : "true",
        }
    }
capabilities = {
    'bstack:options' => {
        # set the Selenium version. Minimum value is 4.0.0-alpha-6
        "seleniumVersion" => "4.0.0",
        # enable the Telemetry logs
        "telemetryLogs" => "true",
        }
    }
Visualize telemetry logs using Jaeger
Jaeger is a distributed tracing system that enables you to visualize the request traces of your BrowserStack test session.
Complete the following steps to integrate and visualize your telemetry logs with Jaeger:
- Download Jaeger on your machine. A compressed (
.tar.gzor.zip) file is downloaded. - Extract the downloaded Jaeger compressed file to the directory where your test script is located. Your test script’s directory now contains several Jaeger files such as
jaeger-query,jaeger-collector, etc. - Edit your test script to add logic that performs the following actions:
- Downloads telemetry logs of the current test session in a compressed file using the following command:
curl -u YOUR_USERNAME:YOUR_ACCESS_KEY -s https://api.browserstack.com/automate/sessions/<session_id>/telemetrylogs > <file_name>.tar.gzYou can also download telemetry logs of your session from the Raw Logs tab of your Automate dashboard.
- Extracts the compressed file containing telemetry logs using the following command.
tar -xf <file_name>.tar.gzThe extracted folder contains two sub-folders, namely
ValueDirandDir. - Starts the Jaeger UI to visualize the telemetry logs using the following command:
- For macOS/Unix-based machine:
SPAN_STORAGE_TYPE=badger ./jaeger-query --badger.directory-key=<path_of_extracted_folder>/Dir --badger.directory-value=<path_of_extracted_folder>/ValueDir --badger.ephemeral=false - For Windows-based system:
set SPAN_STORAGE_TYPE=badger&& jaeger-query.exe --badger.directory-key=<path_of_extracted_folder>/Dir --badger.directory-value=<path_of_extracted_folder>/ValueDir --badger.ephemeral=false
- For macOS/Unix-based machine:
Note: Ensure these commands are run where your test script and Jaeger files (
jaeger-query,jaeger-collector, etc.) exist.Use the following sample Ruby test script to understand how to download and extract telemetry logs folder, start the Jaeger UI, check whether telemetry logs exist on the Jaeger UI page, and mark the test accordingly:
sample-test.rbrequire 'rubygems' require 'selenium-webdriver' require 'date' require 'fileutils' puts "--------------------------------------------" # Configurations puts "Getting configurations" USER_KEY = "YOUR_USERNAME" ACCESS_KEY = "YOUR_ACCESS_KEY" HUB_URL = 'hub.browserstack.com/wd/hub' API_URL = 'https://api.browserstack.com/automate/sessions' OS = 'OS X' OS_VERSION = 'Big Sur' BROWSER = 'Chrome' SELENIUM_VERSION = '4.0.0' TELEMETRY_LOGS = true # Input capabilities puts "Setting capabilities" caps = Selenium::WebDriver::Remote::Capabilities.new caps["os"] = OS caps["os_version"] = OS_VERSION caps["browser"] = BROWSER caps["project"] = "Telemetry Logs" caps["build"] = "Telemetry Logs #{Date.today}" caps["name"] = "#{SELENIUM_VERSION} - #{TELEMETRY_LOGS} - #{Time.now}" caps["browserstack.debug"] = "true" caps["browserstack.console"] = "verbose" caps["browserstack.networkLogs"] = "true" caps["browserstack.selenium_version"] = SELENIUM_VERSION caps["browserstack.telemetryLogs"] = TELEMETRY_LOGS puts "Starting session" driver = Selenium::WebDriver.for( :remote, :url => "https://#{USER_KEY}:#{ACCESS_KEY}@#{HUB_URL}", :capabilities => caps ) # start of a sample test script that searches 'BrowserStack' on wikipedia.org driver.navigate.to "https://www.wikipedia.org" element = driver.find_element(:name, "search") element.send_keys "BrowserStack" element.submit # end of the sample test script # get session ID and store it in the 'session_id' variable response = driver.execute_script('browserstack_executor: {"action": "getSessionDetails"}') session_details = JSON.parse(response) session_id = session_details["hashed_id"] # quit the driver driver.quit # script to get telemetry logs begin puts "Verifying results" # check whether the Jaeger files exists in the current directory system("ps -ef | grep jaeger-query | grep -v grep | awk {'print $2'} | xargs kill") # create the 'data' folder in your current directory FileUtils.mkdir_p('data') # get telemetry logs of your current test session in a compressed file, for example 'badger.tar.gz' system("curl -u #{USER_KEY}:#{ACCESS_KEY} -s #{API_URL}/#{session_id}/telemetrylogs > data/badger.tar.gz") # extract the compressed file system("cd data; tar -xf badger.tar.gz") # start the Jaeger UI system("SPAN_STORAGE_TYPE=badger ./jaeger-query --badger.directory-key=data/badger/Dir --badger.directory-value=data/badger/ValueDir --badger.ephemeral=false 1>/dev/null 2>&1 &") # wait for 100 seconds for the Jaeger UI to load completely sleep 100 # get title of the Jaeger UI page is_title = `curl -s "http://localhost:16686/api/traces?service=selenium-browserstack" | grep -o '/session/[a-z0-9]*/title'` raise "Verification Failed" if is_title.empty? puts "Verification Success" # mark test as 'passed' if browser title exists on the Jaeger UI page system("curl -u #{USER_KEY}:#{ACCESS_KEY} -X PUT -H \"Content-Type: application/json\" -d \"{\\\"status\\\":\\\"passed\\\", \\\"reason\\\":\\\"Yaay! Telemetry Logs Verified!\\\"}\" -s \"#{API_URL}/#{session_id}.json\" > /dev/null") rescue Exception => e puts e.message # mark test as 'failed' if browser title is null on the Jaeger UI page system("curl -u #{USER_KEY}:#{ACCESS_KEY} -X PUT -H \"Content-Type: application/json\" -d \"{\\\"status\\\":\\\"failed\\\", \\\"reason\\\":\\\"Hmmm! Telemetry Logs Verification Failed\\\"}\" -s \"#{API_URL}/#{session_id}.json\" > /dev/null") ensure puts "--------------------------------------------" endAfter the test script runs successfully, open the Jaeger UI page at http://localhost:16686/search.
Note: The
16686port is the default port of the Jaeger UI page. It may vary based on what you set. - Downloads telemetry logs of the current test session in a compressed file using the following command:
- On the Jaeger UI page, from the Service drop-down, select selenium-browserstack, and click Find Traces. The request traces of your BrowserStack sessions appear on the Jaeger UI page.
You can now filter traces and analyze request traces of your BrowserStack session.
Related topics
Check our list of various JavaScript Executors that BrowserStack offers.
We're sorry to hear that. Please share your feedback so we can do better
Contact our Support team for immediate help while we work on improving our docs.
We're continuously improving our docs. We'd love to know what you liked
We're sorry to hear that. Please share your feedback so we can do better
Contact our Support team for immediate help while we work on improving our docs.
We're continuously improving our docs. We'd love to know what you liked
Thank you for your valuable feedback!