Debug failed tests
BrowserStack provides a range of debugging tools to help you quickly identify and fix bugs discovered through your automated tests.
If you are still using the older dashboard, see the documentation for the old dashboard.
This document explores the various ways for debugging your tests on the BrowserStack Automate Dashboard or for downloading logs using the REST APIs. Learn how to enable the debugging options.
Interactive Session
The interactive session feature helps you take control of the test while it is executing on the remote browser.
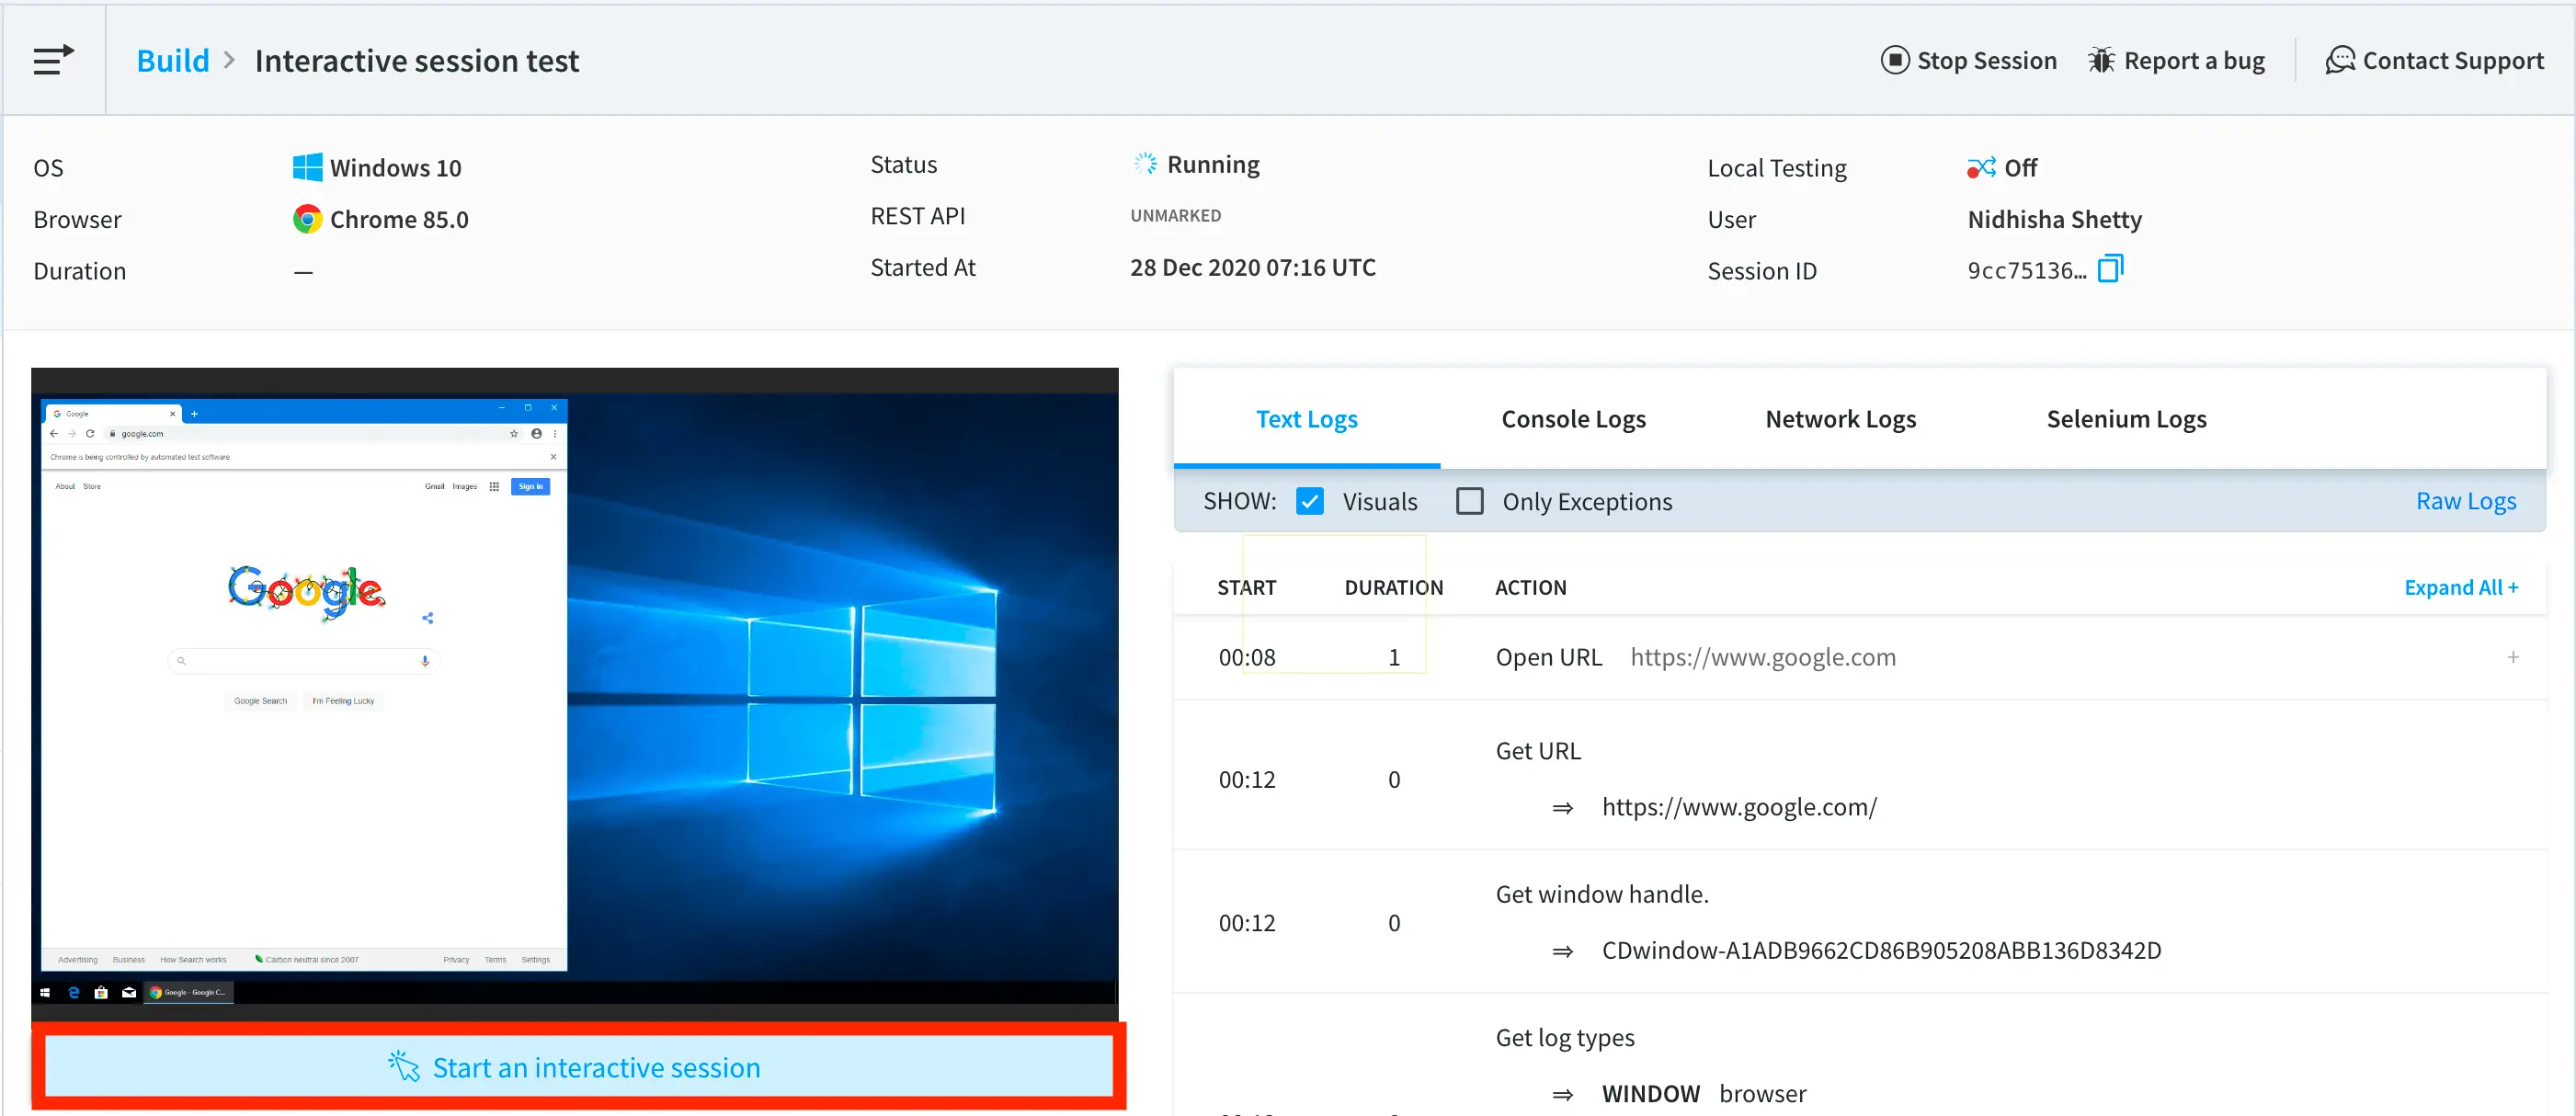
You can start the interactive session by clicking on Start an interactive session link that appears in the video recording area as you execute your test script. Refer the following screenshot:

To take control of the session in the interactive mode at specific points you can add breakpoints in the test script as mentioned below:
- Add breakpoints in the test script using your IDE.
- Execute the test, you will find the session running on the BrowserStack Automate dashboard.
- Click on the Start an interactive session link that appears in the video recording area. (refer to the screenshot above).
-
Once the interactive session starts, it will pause at the breakpoint you provided in the test script, thus allowing you to debug your session.
You can debug the session at a breakpoint for a maximum of 90 seconds (default
IDLE_TIMEOUTsetting), else the session will result inBROWSERSTACK_IDLE_TIMEOUTerror. - Proceed to the next breakpoint, and perform debugging similarlly, or exit debugging.
In the following sections, you will require the session-id and build-id to retrieve the logs using the Automte REST API.
- You can find the
build-idby hitting the API for getting build details. - You can get the
session-idby executing the code mentioned in the documentation for getting Session ID.
Video Recording
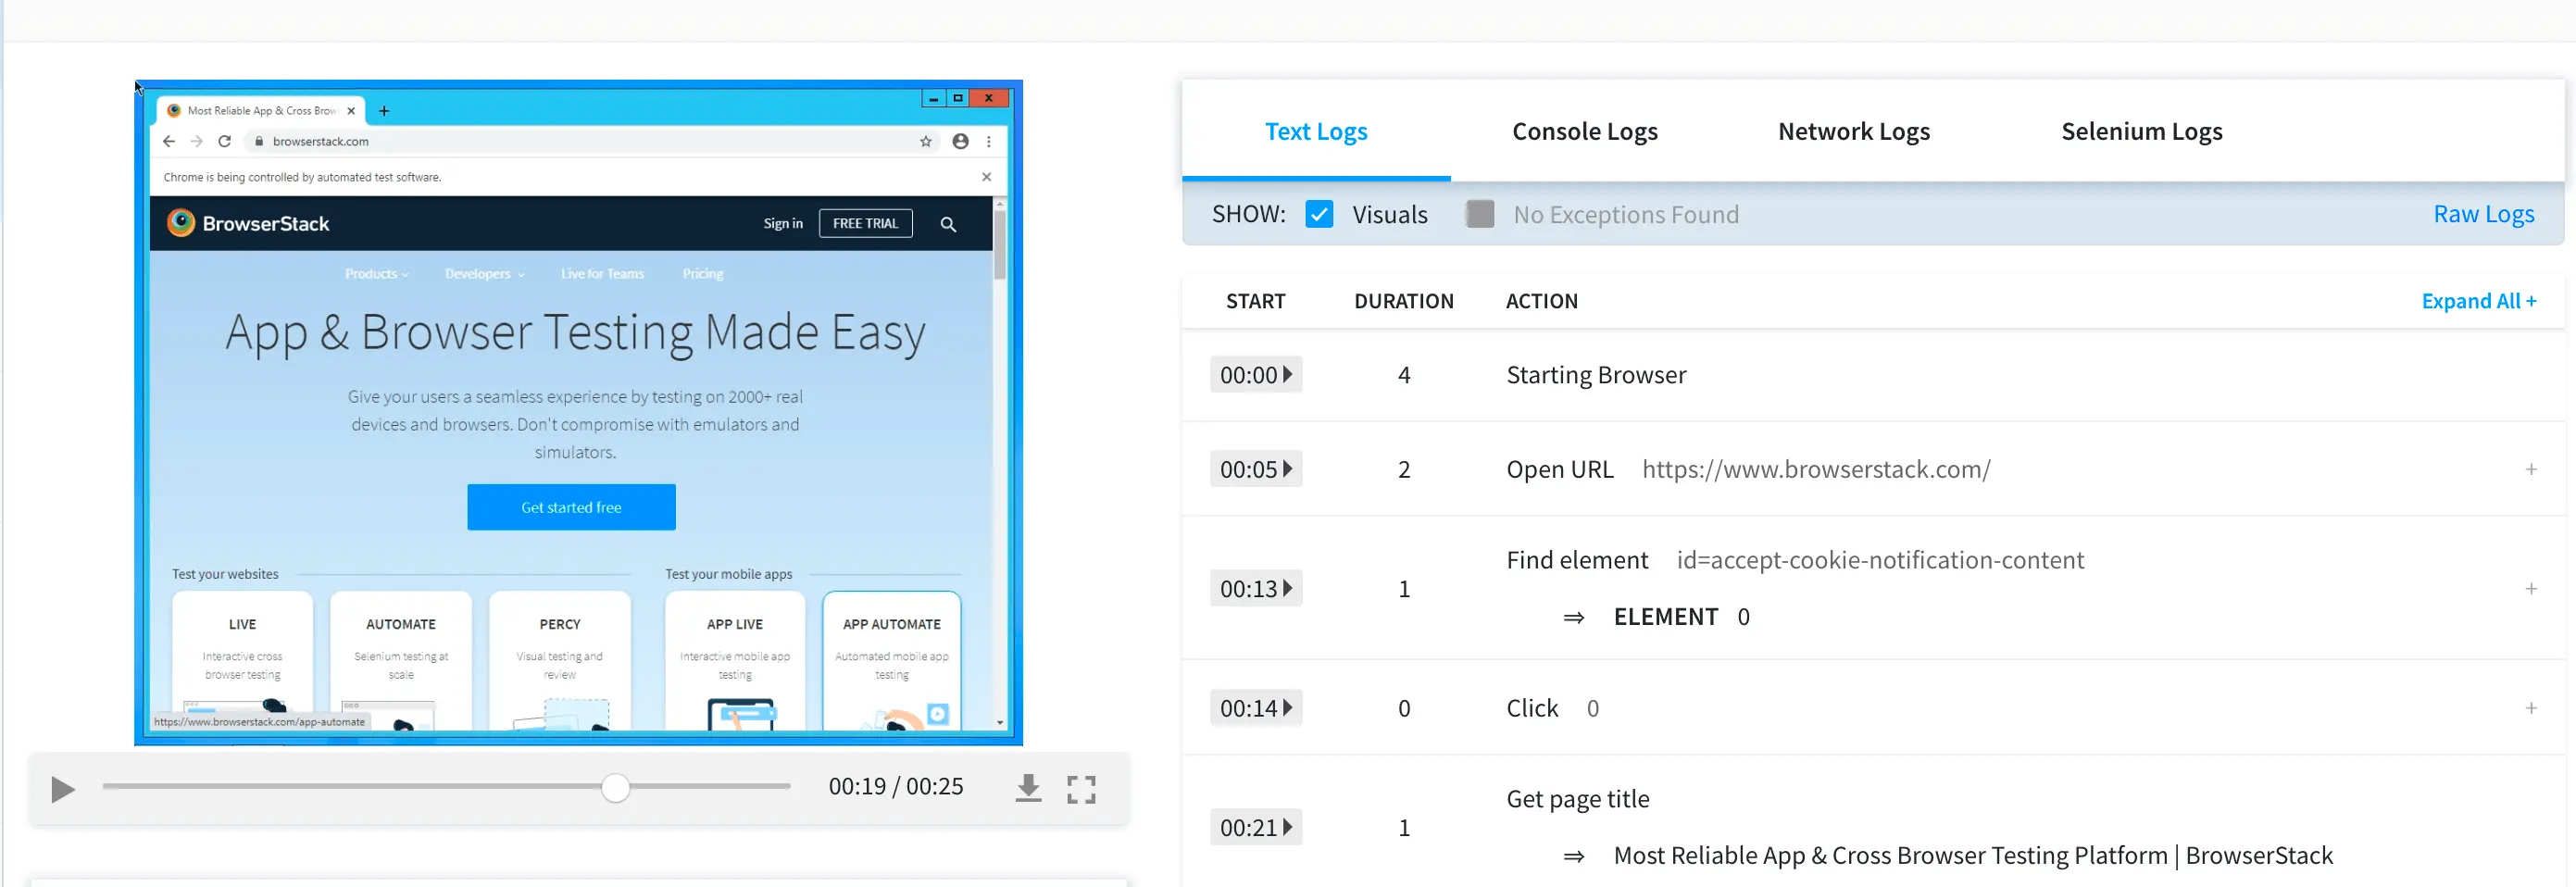
Every Selenium or JavaScript test run on BrowserStack is recorded exactly as it is executed on our remote machine. Video recordings are particularly helpful whenever a browser test fails as they help you retrace the steps which led to the failure. You can access the video recordings from Automate Dashboard for each session. You can also download the videos from the Dashboard or retrieve a link to download the video using our REST API for sessions.
Access video from Automate Dashboard:

Retrieve video link from session information using REST API:
curl -u "YOUR_USERNAME:YOUR_ACCESS_KEY" https://api.browserstack.com/automate/sessions/<session-id>.json
Raw Selenium Logs
Raw Logs capture all the details of your Selenium or JavaScript test, including the capabilities you passed, the timestamps of every event/action which occurred in the test and details of every Selenium command you executed during your test.
You can download raw Selenium Logs using the Raw Logs link available inside a session on Automate Dashboard.
You can also retrieve a link to download the Raw Logs by using REST API for sessions:
curl -u "YOUR_USERNAME:YOUR_ACCESS_KEY" https://api.browserstack.com/automate/sessions/<session-id>.json
Text Logs
Text Logs are a comprehensive record of your Selenium or JavaScript test. They are used to identify all the steps executed in the test and troubleshoot errors for the failed step.
You can access Text Logs in a session on Automate Dashboard.
You can also download Text Logs using the REST API:
curl -u "YOUR_USERNAME:YOUR_ACCESS_KEY" https://api.browserstack.com/automate/builds/<build-id>/sessions/<session-id>/logs
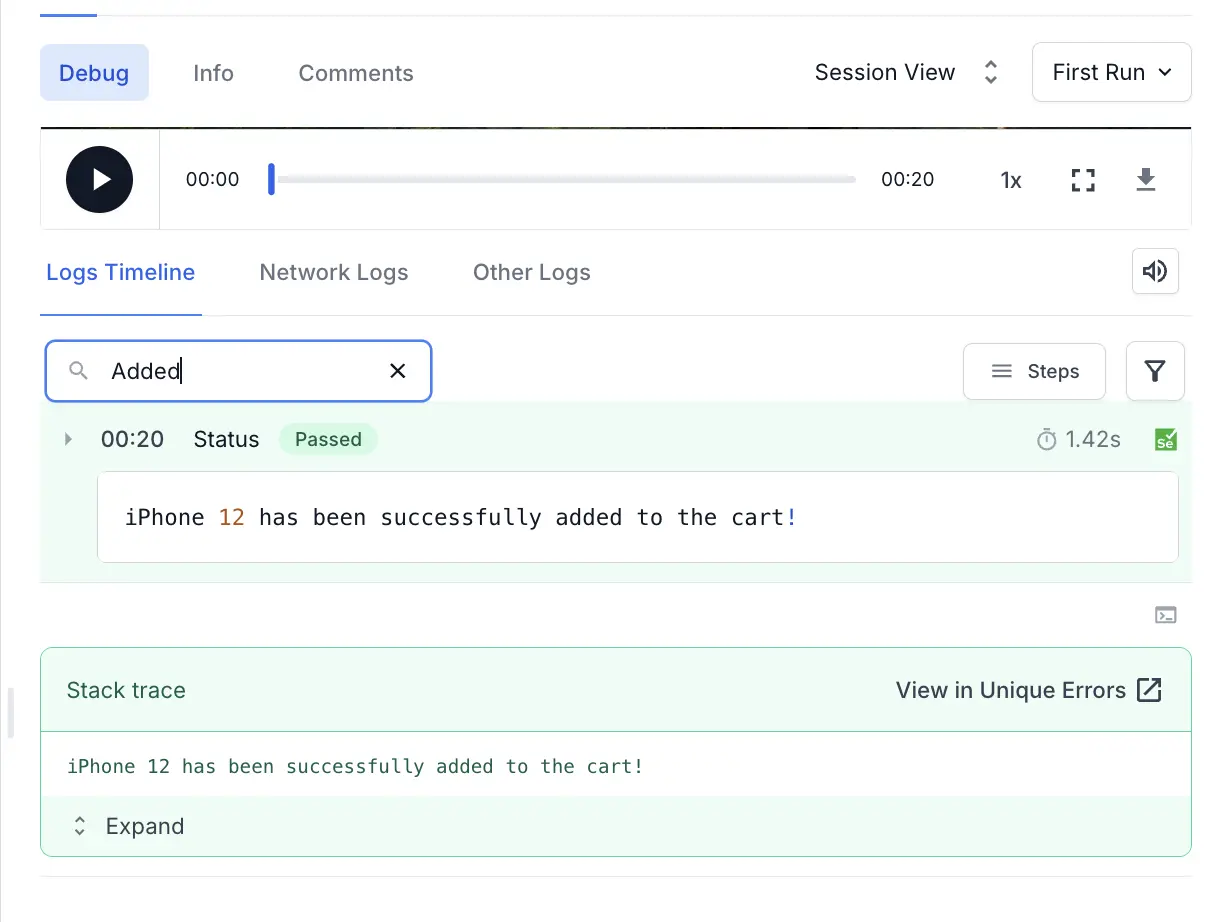
You can search within text logs using Find in Logs to jump to a specific section of the logs. It highlights all occurrences while performing the search in real time. Furthermore, you can conveniently navigate through each occurrence using the Enter key or the Up/Down arrow keys.

Durations of commands in text logs that are less than 0 second are shown in milliseconds.
Visual Logs
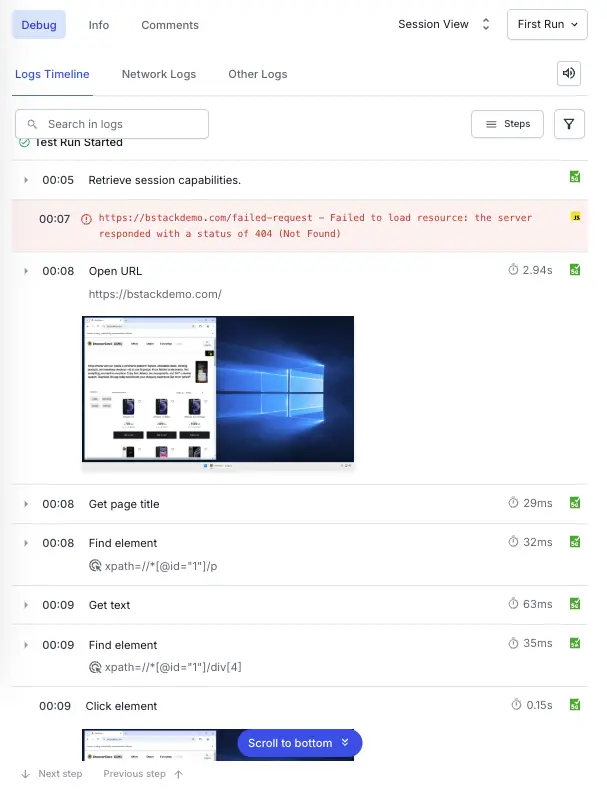
Visual Logs automatically capture screenshots at every Selenium command executed during your test. They help debug issues detected through your Selenium tests. Visual Logs help with debugging the exact step and the page where the failure occurred. They also help identify any layout or design related issues with your web pages on different browsers.
Visual Logs are disabled by default. In order to enable Visual Logs you will need to set browserstack.debug capability to true.
Access Visual Logs from Automate Dashboard:

Console Logs
Console Logs capture the browser’s console output at various steps of the test to troubleshoot JavaScript issues.
Console Logs are by default enabled in tests, with log level set to errors.
To set different log levels, you need to use the capability browserstack.console with possible values:
disableerrorswarningsinfoverbose
You can access Console Logs in a session on Automate Dashboard.
You can also download logs using the REST API:
curl -u "YOUR_USERNAME:YOUR_ACCESS_KEY" https://api.browserstack.com/automate/builds/<build-id>/sessions/<session-id>/consolelogs
Currently, console logs are available only for Selenium tests on Chrome browser running on Windows, macOS and Android platforms.
Network Logs
Network Logs capture the browser’s performance data such as network traffic, latency, HTTP requests and responses in the HAR(HTTP Archive) format. You can leverage Network logs to get a clear picture of all the requests your web page is making, and the time taken for each of these requests. You can download network logs using the REST API or via the Automate Dashboard. You can visualize HAR files using the HAR Viewer.
Network Logs are disabled by default. To enable Network Logs use the capability browserstack.networkLogs with the value true.
Retrieve Network Logs using REST API:
curl -u "YOUR_USERNAME:YOUR_ACCESS_KEY" https://api.browserstack.com/automate/builds/<build-id>/sessions/<session-id>/networklogs
Network response data may not be collected during the session when using non-Chromium browsers, such as Firefox and Safari. This issue is caused by the BrowserMob proxy used to capture network responses, which does not support Brotli-encoded responses in these browsers.
Selenium Logs
Selenium Logs captures the raw logs of Selenium JAR for your test execution. With Selenium logs you can debug the test in case of any exceptions.
You can access Selenium Logs in a session on Automate Dashboard.
You can also download logs using the REST API:
curl -u "YOUR_USERNAME:YOUR_ACCESS_KEY" https://api.browserstack.com/automate/builds/<build-id>/sessions/<session-id>/seleniumlogs
Appium Logs
Appium Logs captures the raw Appium Logs for your test execution. With Appium logs you can debug the test in case of any exceptions.
You can access Appium Logs in a session on Automate Dashboard.
You can also download logs using the REST API:
curl -u "YOUR_USERNAME:YOUR_ACCESS_KEY" https://api.browserstack.com/automate/builds/<build-id>/sessions/<session-id>/appiumlogs
Learn more about Automate REST API to access information about your test, build, or project.
We're sorry to hear that. Please share your feedback so we can do better
Contact our Support team for immediate help while we work on improving our docs.
We're continuously improving our docs. We'd love to know what you liked
We're sorry to hear that. Please share your feedback so we can do better
Contact our Support team for immediate help while we work on improving our docs.
We're continuously improving our docs. We'd love to know what you liked
Thank you for your valuable feedback!

