
Debug using an interactive session
An interactive session lets you view, interact, and debug any ongoing test session on the App Automate platform.
If you are still using the older dashboard, see the documentation for the old dashboard.
When running test scripts for website or application testing, you may encounter bugs. Debugging typically involves verbose logging to identify issues. However, this approach may not work in all cases. For instance, if a test fails due to a missing or unexpected visual element not covered in the script, logs may provide little insight. Similarly, during exploratory testing, you might add a breakpoint to transition into manual testing.
Using an interactive session, you can:
- View live test execution on BrowserStack to observe how an Application Under Test (AUT) behaves during test execution. For example, observing how a test script adds product entries to your database app.
- Interact with the application to click buttons, pop-ups, or any other application element while the test is running. For example, adding multiple product entries to your database app in the middle of test execution to check end-user functionality.
Supported OS and Frameworks
The following table lists the supported OS and framework where you can use interactive sessions.
| Component | Versions |
|---|---|
| Android platform | All versions |
| iOS platform | v13.4 and above |
| Appium Framework | - iOS: Default Appium version - Android OS: All Appium versions |
Interactive debugging
The interactiveDebugging capability allows you to debug interactively while a session is in progress.
video and interactiveDebugging capabilities both have to be set to true to enable interactive debugging.
BrowserStack does not support interactive debugging on the following devices:
- Samsung Galaxy S25 Ultra
- Google Pixel 9 Pro XL
- Google Pixel 9
- Realme 8
- Oppo Reno 6
- Oppo Reno 3 pro
If you are using BrowserStack SDK, you can set the following capabilities in the browserstack.yml file:
| Platform | Accepted value |
|---|---|
| Desktop | Default: true. Set false to disable. |
| iOS | Default: true. Set false to disable. |
| Android | Default: false. Set true to enable. |
Example:
userName: YOUR_USERNAME
accessKey: YOUR_ACCESS_KEY
app: bs://sample.app
platforms:
  - platformName: ios
    deviceName: iPhone 14 Pro Max
    platformVersion: 16
  - platformName: ios
    deviceName: iPhone XS
    platformVersion: 15
  - platformName: ios
    deviceName: iPhone 11
    platformVersion: 14
interactiveDebugging: true
video: true
buildName: bstack-demo
projectName: BrowserStack Sample-
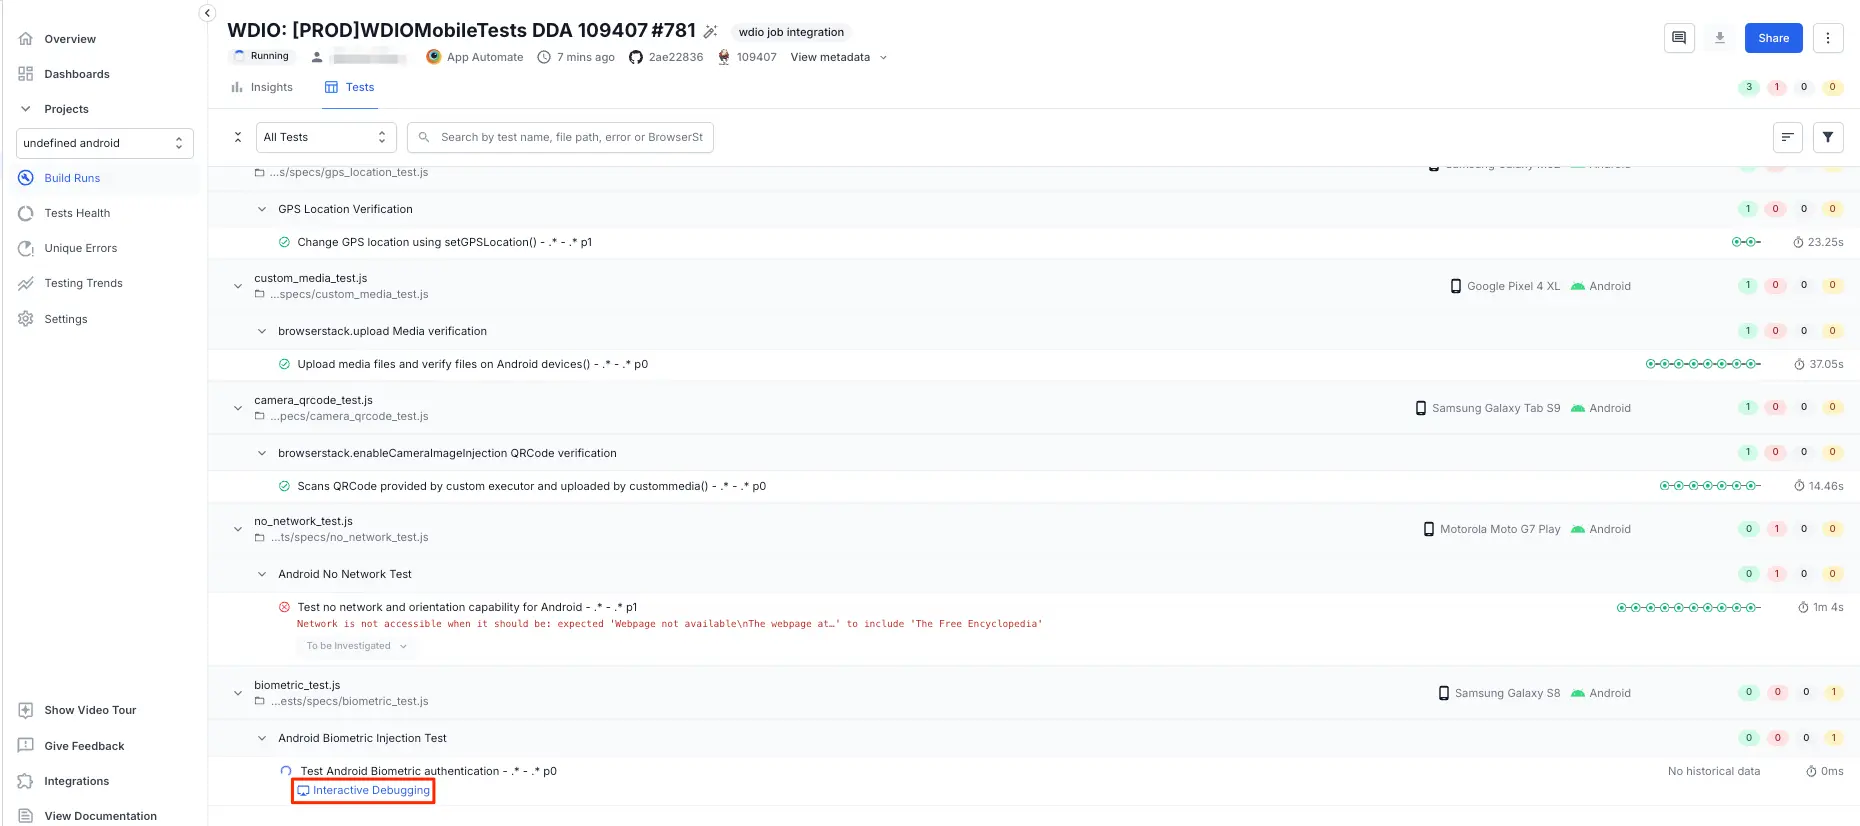
Navigate to your App Automate dashboard and go to the ongoing session.
-
On your ongoing session page, click Interactive Debugging to start an interactive session.
We're sorry to hear that. Please share your feedback so we can do better
Contact our Support team for immediate help while we work on improving our docs.
We're continuously improving our docs. We'd love to know what you liked

We're sorry to hear that. Please share your feedback so we can do better
Contact our Support team for immediate help while we work on improving our docs.
We're continuously improving our docs. We'd love to know what you liked
Thank you for your valuable feedback!