Integrate Jenkins with Quality Engineering Insights
Install our plugin to capture insights about different pipelines and jobs from your CI environment.
Install and configure the BrowserStack Jenkins plugin
The BrowserStack Jenkins plugin helps you monitor all job runs. Once the job run is complete, the plugin sends run metadata to the Quality Engineering Insights. This section explains how to:
Step 1: Install the BrowserStack Plugin
To install the BrowserStack plugin, complete the following steps:
- Go to your Jenkins page, running by default on
http://localhost:8080/, and click Manage jenkins in the left navigation bar. - On the Manage Jenkins page, click Manage Plugins.
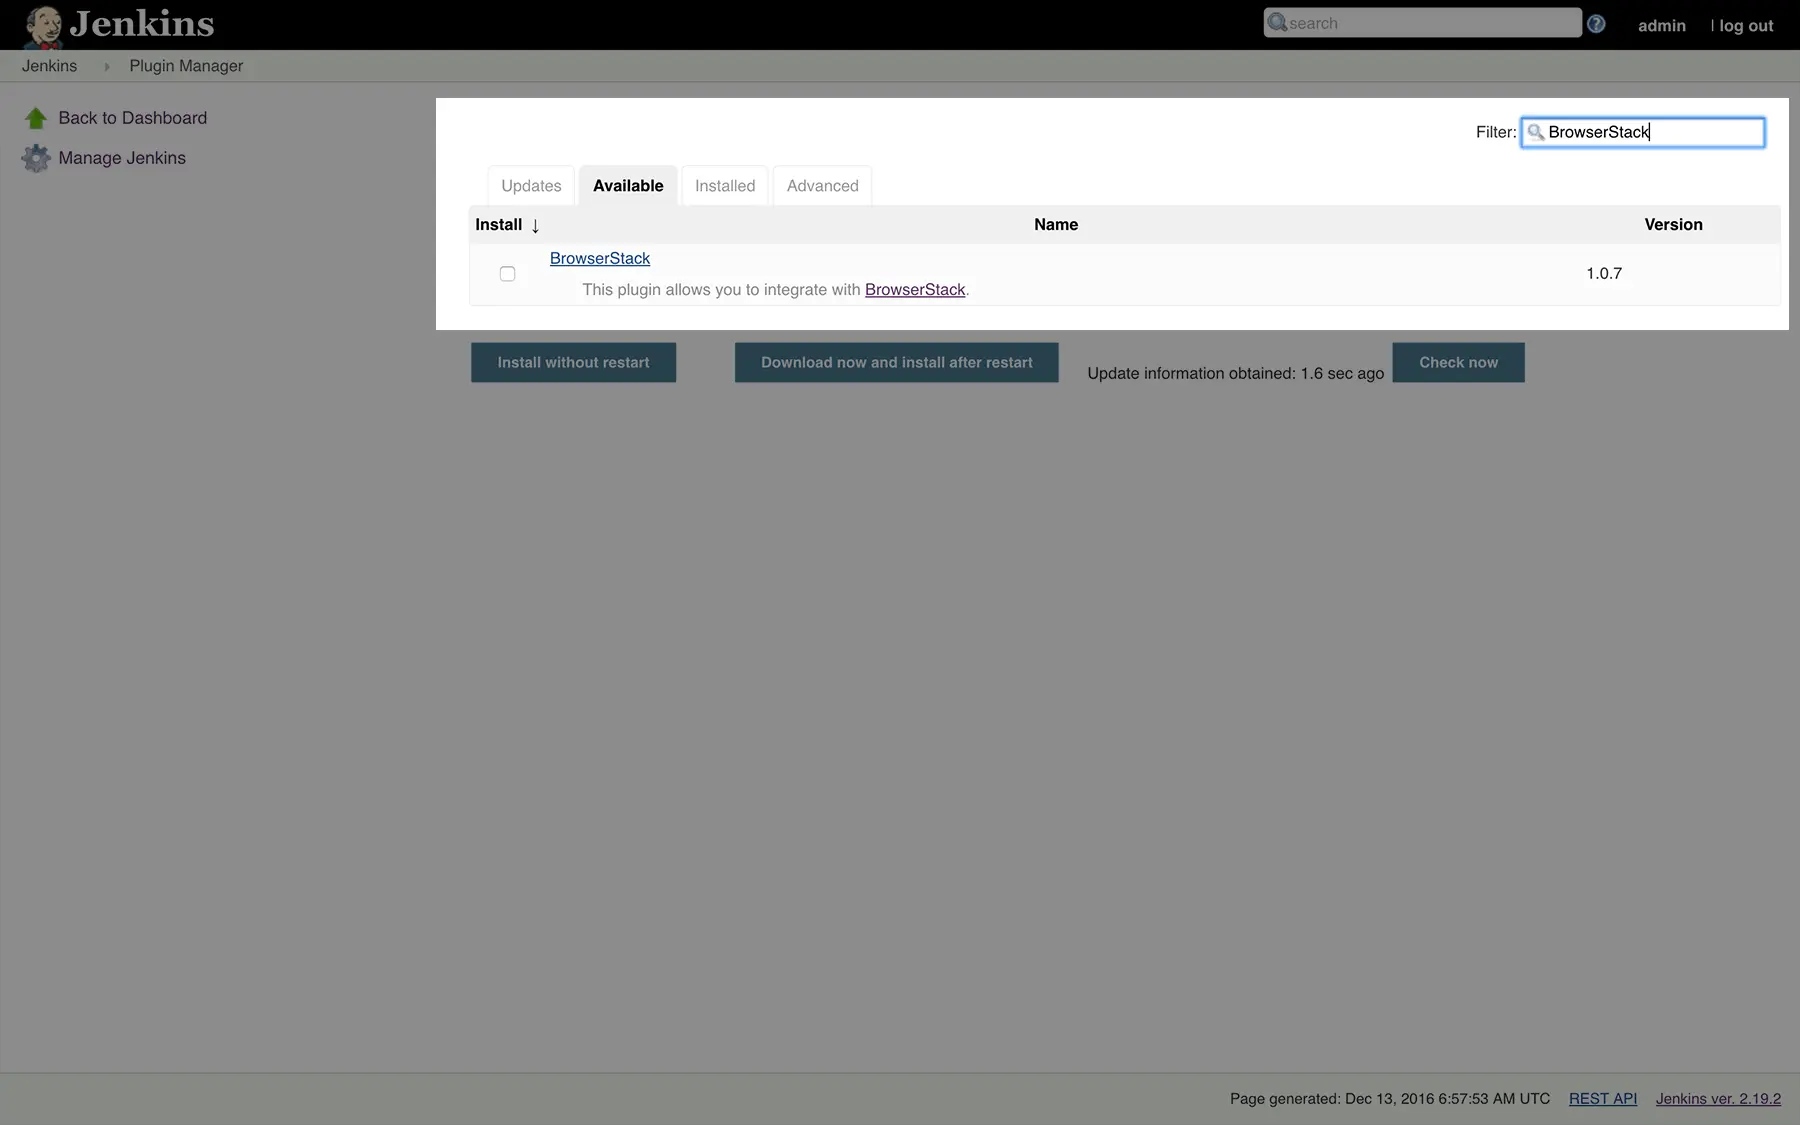
- On the Plugin Manager page, click the Available tab.
- Search for BrowserStack in the search box.

- Select BrowserStack and click either Install without restart or Download now and install after restart, depending on your preference.
- On the Installing Plugins/Upgrades page, view the installation status of the plugin.
- After installation is successful, click Go back to the top page to configure the plugin.
Step 2: Configure BrowserStack credentials in Jenkins
After you’ve installed the plugin, complete the following steps to configure your BrowserStack credentials in the plugin:
- On your Jenkins page (
http://localhost:8080/), click Manage Jenkins > Configure System. - Under the BrowserStack Credentials section, click Add > Jenkins.
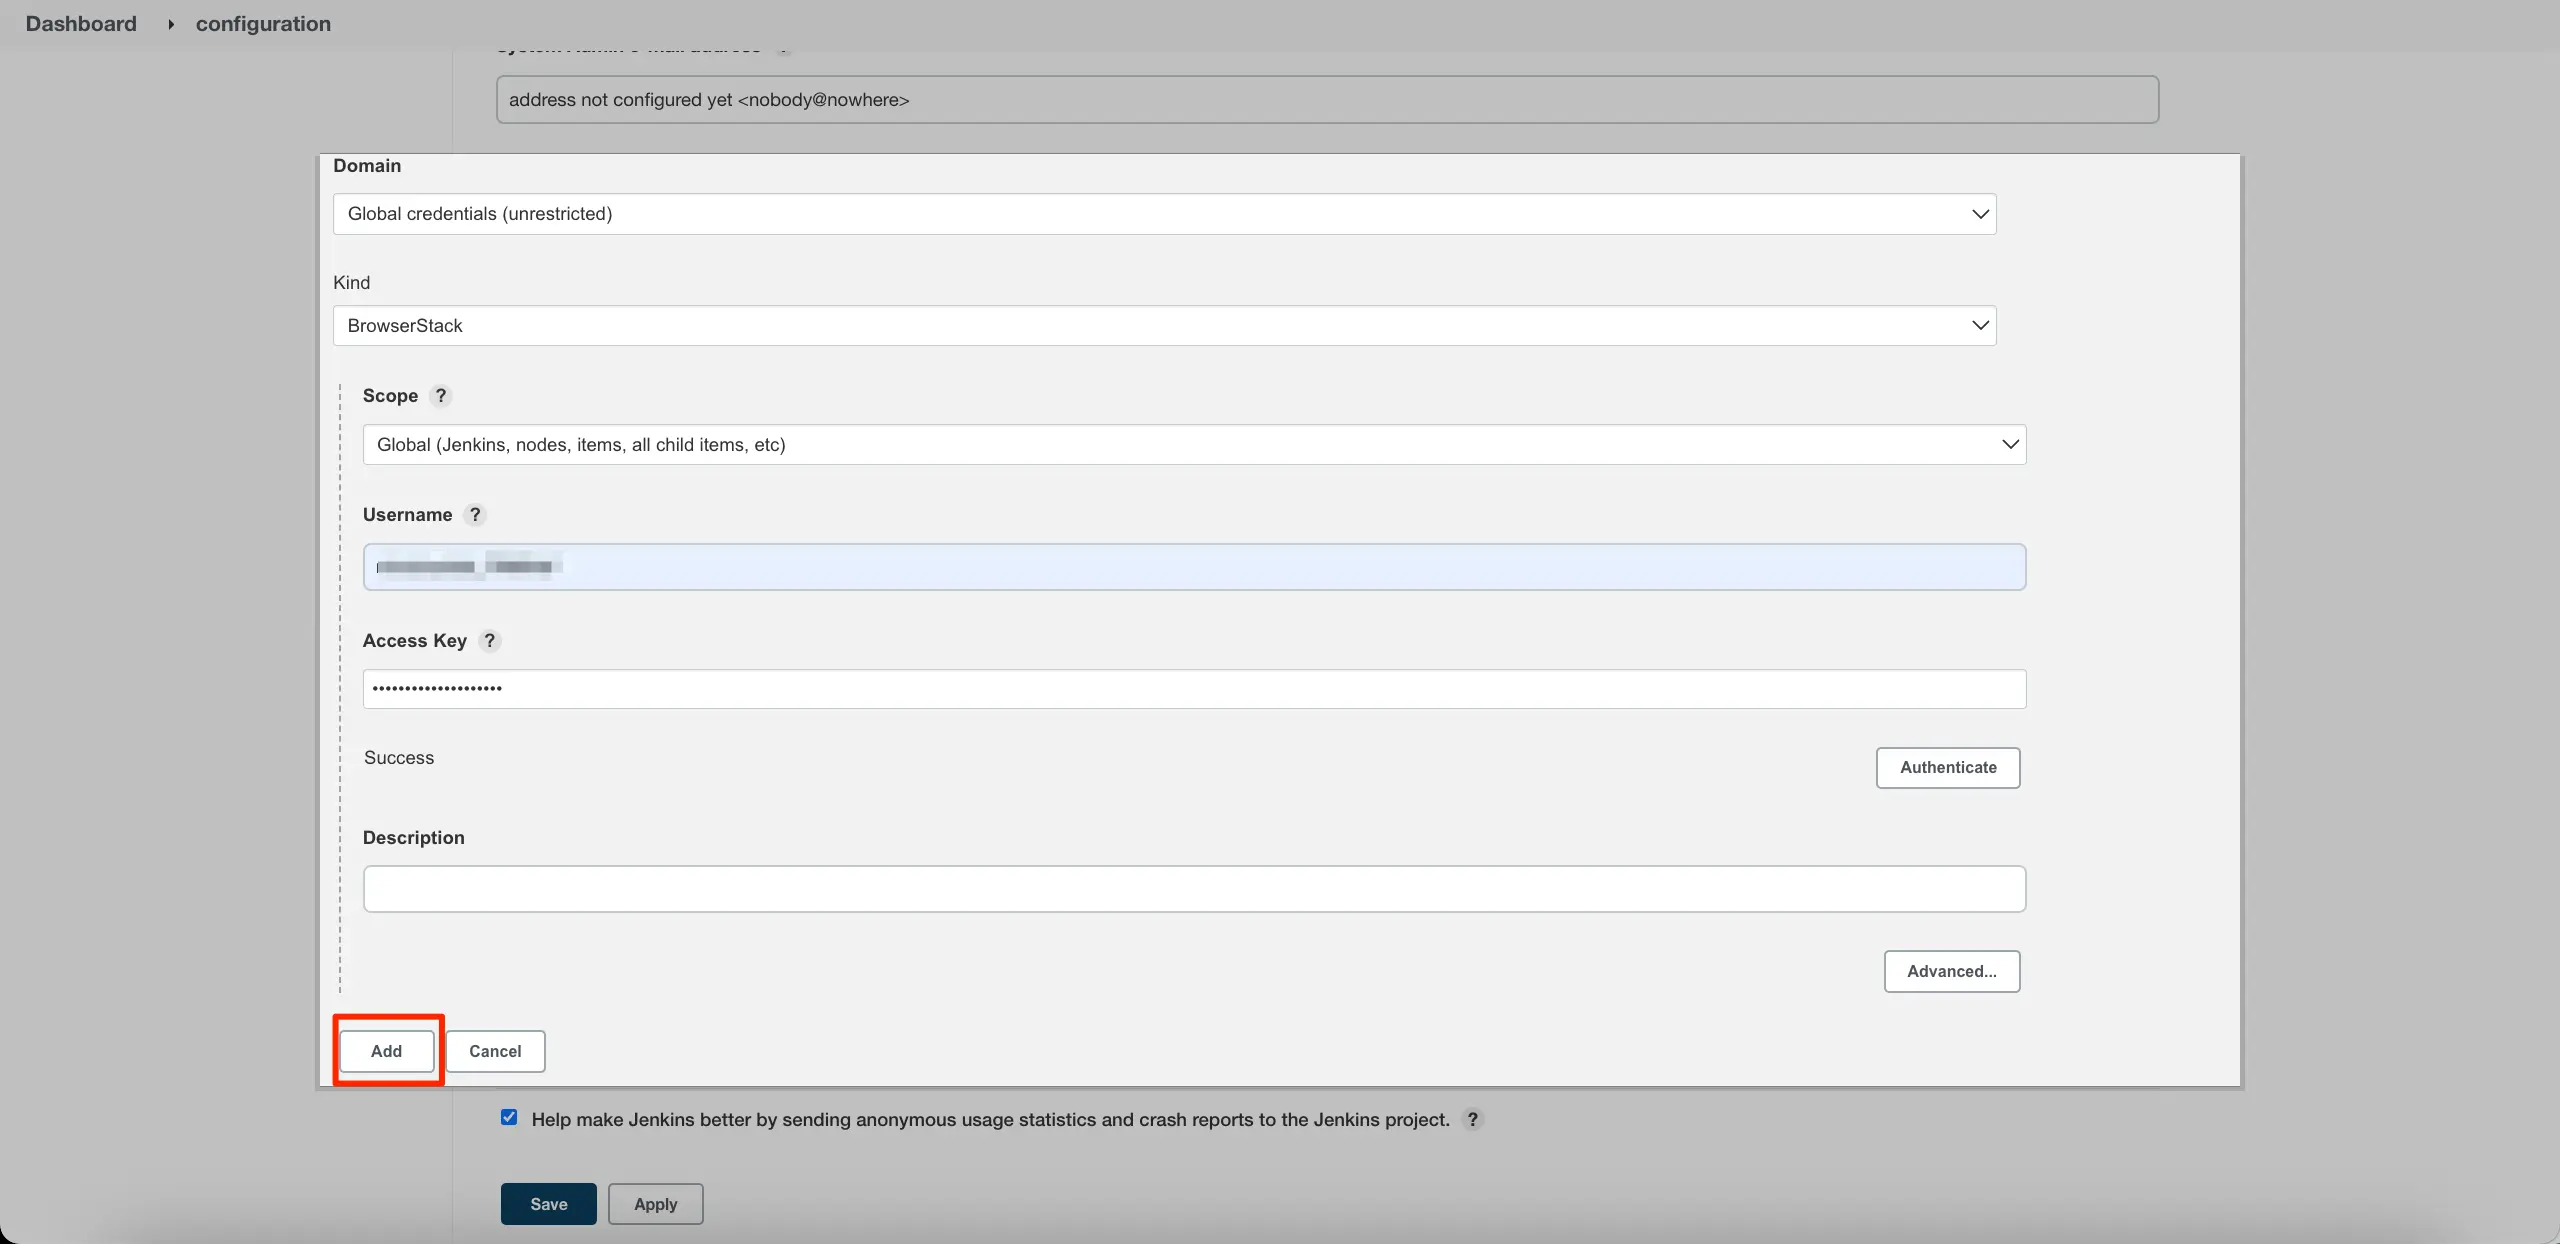
- In the Jenkins Credentials Provider: Jenkins window, enter your Username and Access Key.
- Click Authenticate. After the plugin verifies your BrowserStack credentials, a Success text appears.
- Click Add at the bottom of the Jenkins Credentials Provider: Jenkins window. You will be redirected to the configuration page.

- On the configuration page, click Save.
Setting up Automation Metrics Dashboard
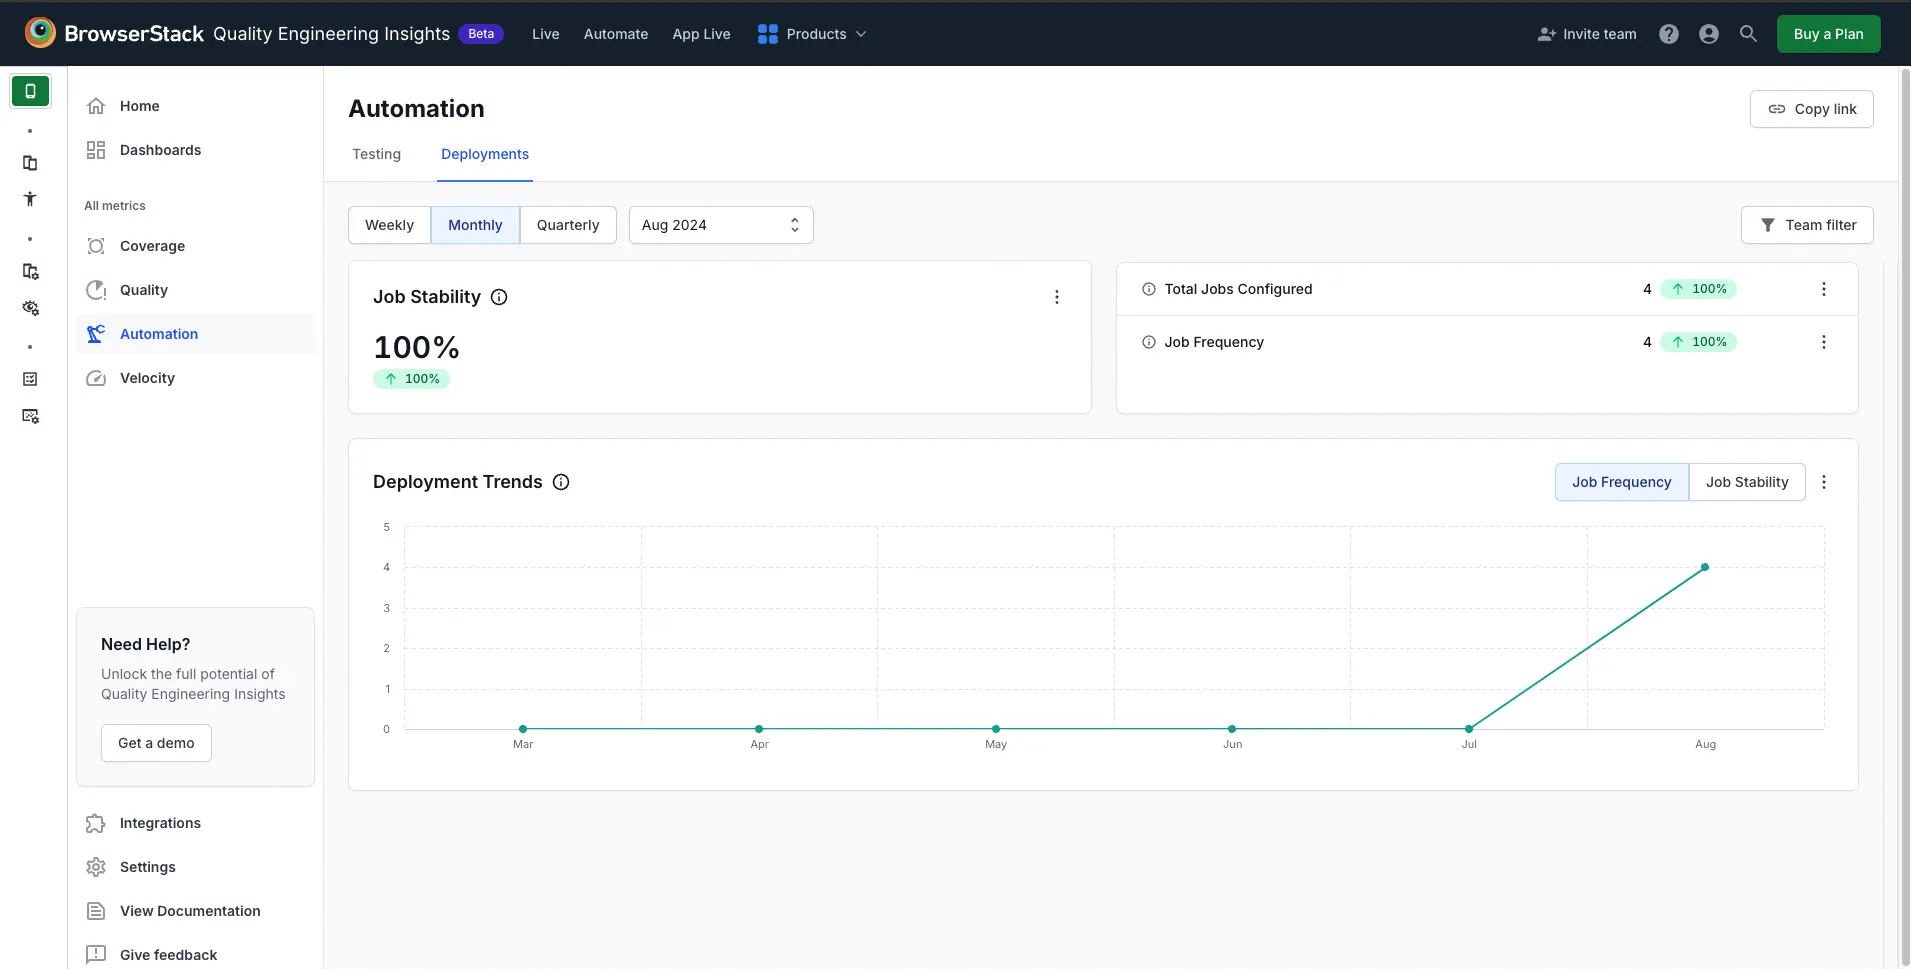
The Automation Metrics Dashboard provides insights into different CI Automation metrics like job frequency, stability and historical trends. Once testing jobs are tagged correctly, you get visibility into additional metrics like test-suite stability, and flakiness for a given build.
Configure your Testing Jobs
The Automation Metric Dashboard provides visibility into both Testing and Deployment jobs. Configure them to unlock the full potential of these dashboards.
Configure Job Type for Testing jobs
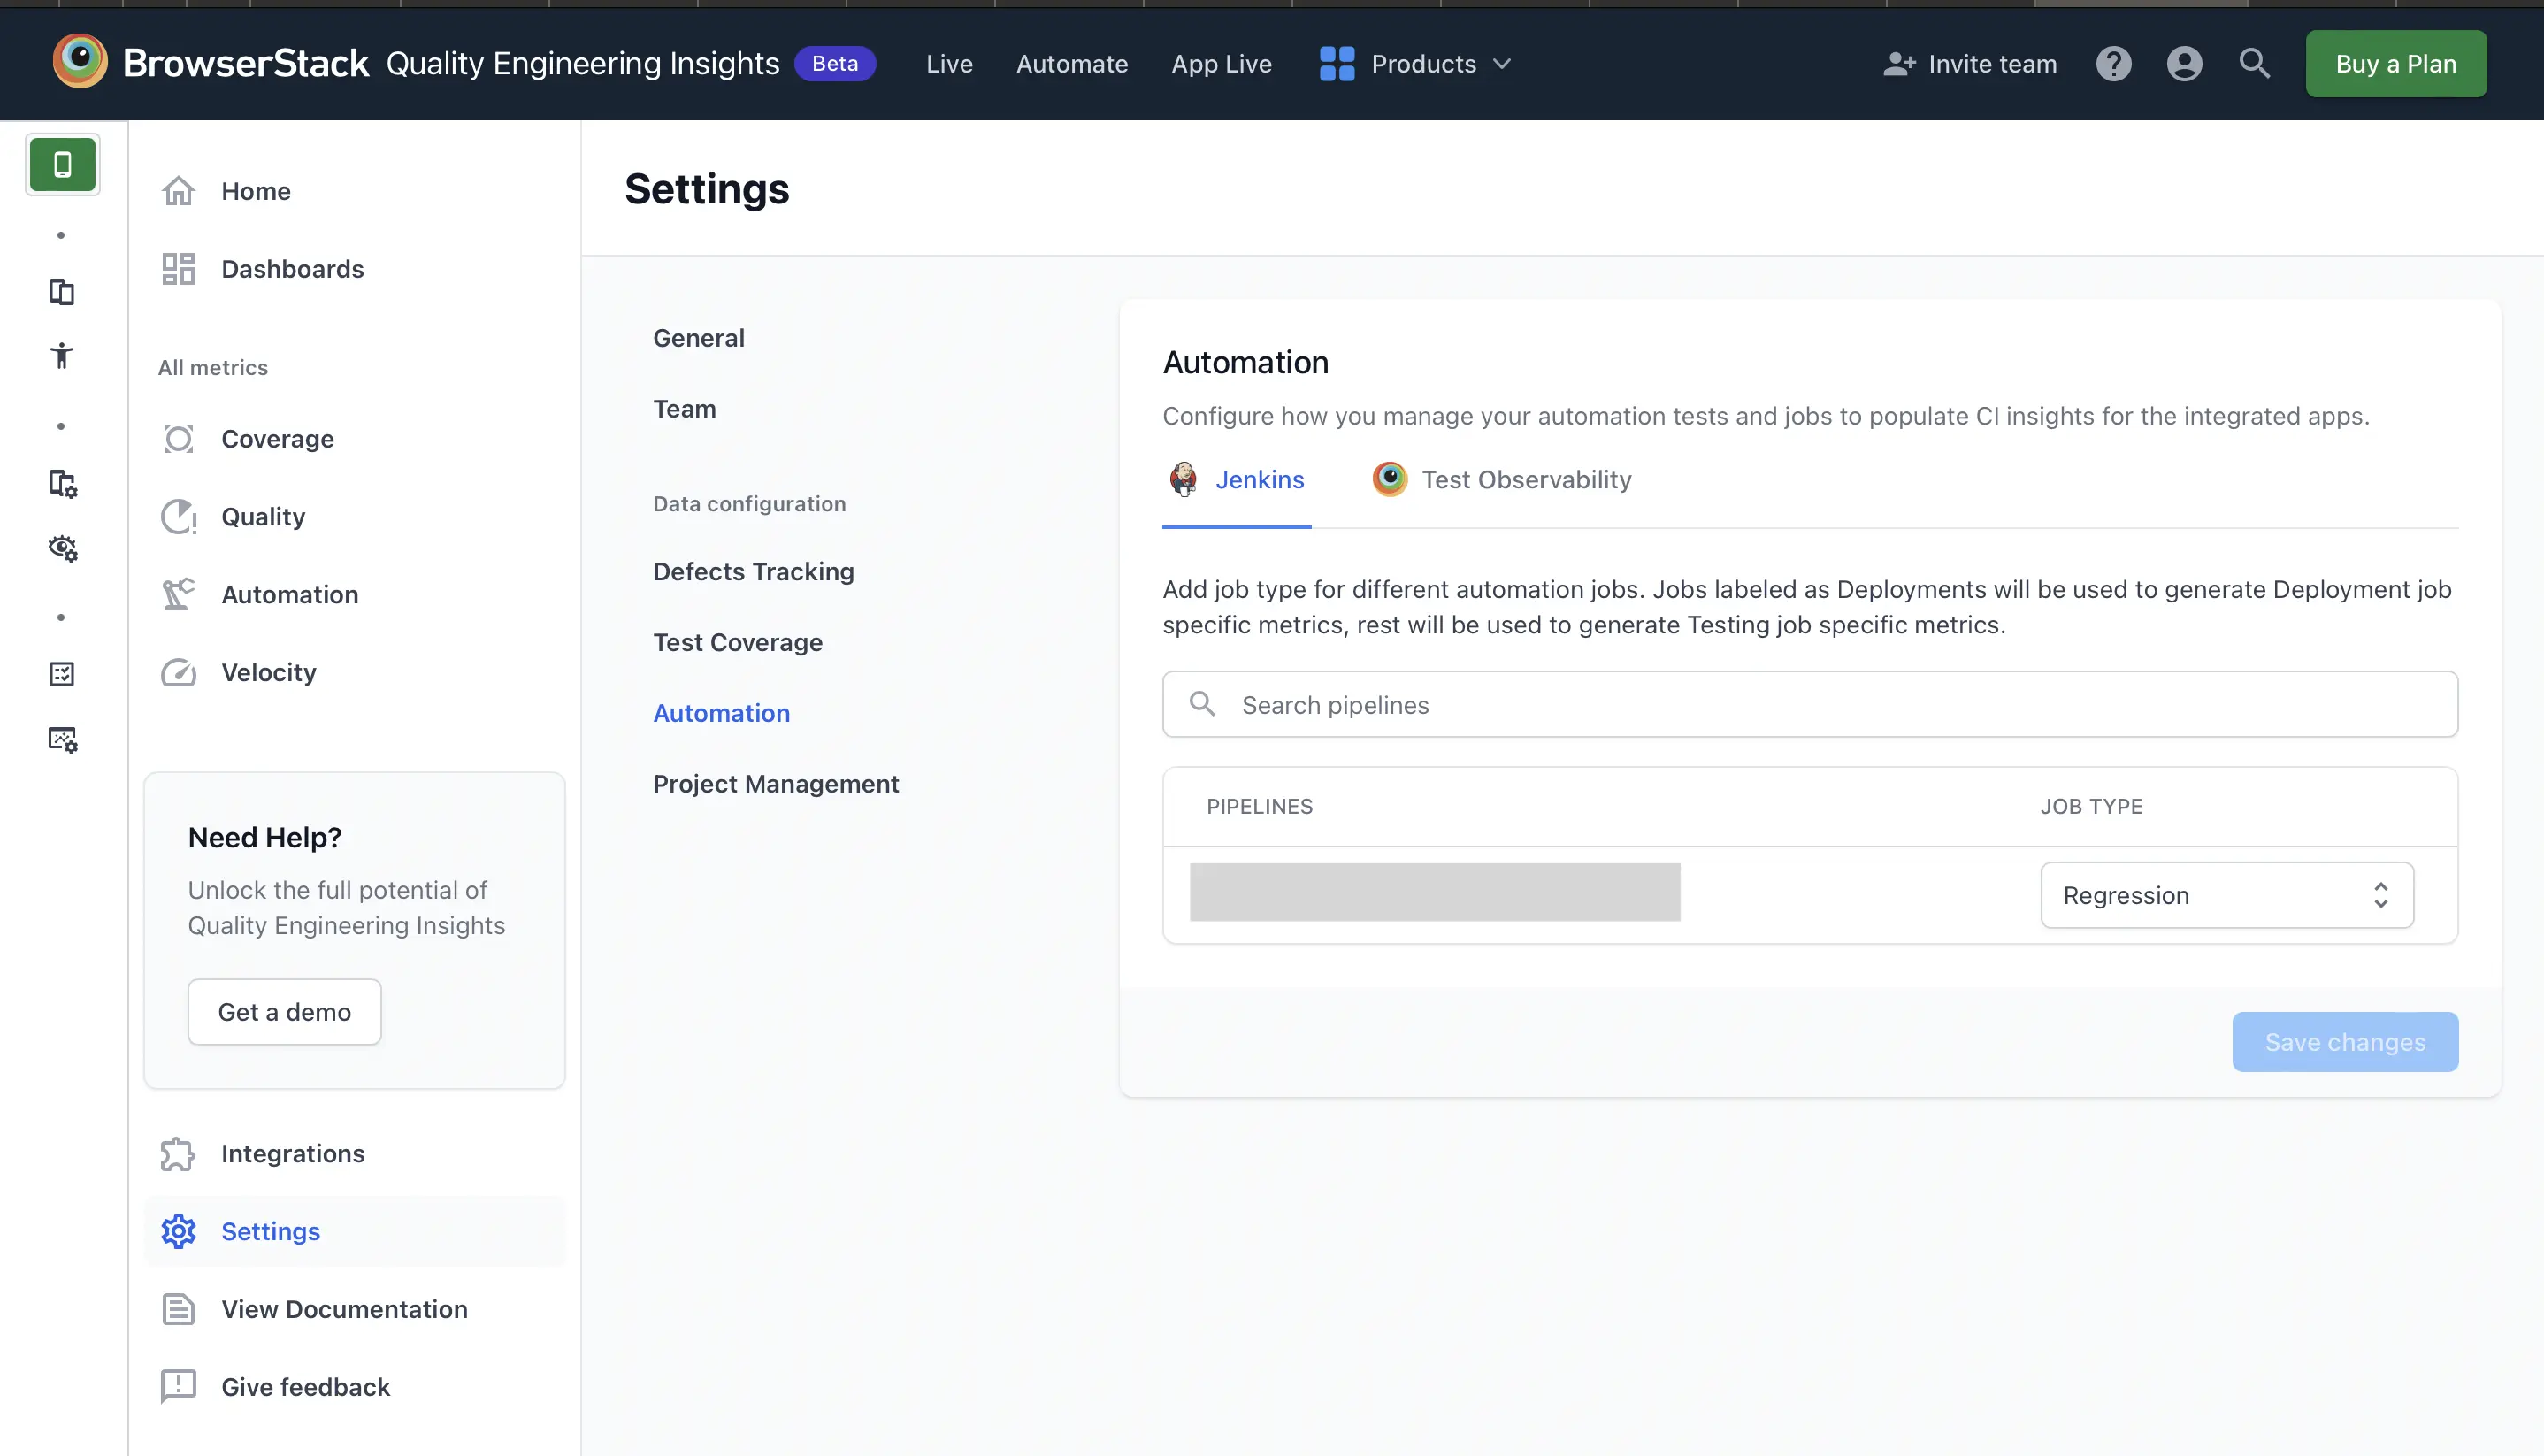
You can configure the job type for all the jobs and pipelines fetched from your CI environment or Test reporting tool. You can tag your jobs as per testing type like regression, functional or sanity using the Automation tab available in settings.

Handling Job Output results
For testing Jobs, you can configure the path to the job’s test results folder to allow the BrowserStack plugin to read the job output. The plugin fetches job results and calculates test-suite-related metrics like build stability and build flakiness.
For example, if a particular testing job generates test reports or output results in path http://localhost:8080/view/ProdSanity/job/ProdSanity/job/ComponentProdSanity/TestReport/, configure the output field for the respective job as /var/jenkins/workspace/job/ProdSanity/job/ComponentProdSanity/TestReport/%build_number%/ on Quality Engineering Insights.
The plugin dynamically picks up the build number from the CI environment. For static test result output paths, appending %build_number% is not mandatory.
- We currently support parsing of JUnit test reports in XML Format.
- You can find additional information on the supported JUnit XML format in this writeup by the Testmo team.
- If the Output or Test Report Folder is not configured, the plugin calculates the metrics based on results found in the job’s Archive folder.
Setting up your Deployment Jobs
With Quality Engineering Insights, you can build visibility into all of your deployment jobs on your CI environment. For the relevant deployment jobs, configure the Job Type to Deployment and BrowserStack’s plugin will start calculating key deployment metrics.

Troubleshooting
Need help? Reach out to us here.
We're sorry to hear that. Please share your feedback so we can do better
Contact our Support team for immediate help while we work on improving our docs.
We're continuously improving our docs. We'd love to know what you liked
We're sorry to hear that. Please share your feedback so we can do better
Contact our Support team for immediate help while we work on improving our docs.
We're continuously improving our docs. We'd love to know what you liked
Thank you for your valuable feedback!
