Apple’s innovative products, from the Mac to the iPad, have consistently set industry standards and captivated users worldwide.
However, Apple’s tightly controlled ecosystem often presents challenges for developers looking to test and debug apps on iPads. Navigating these restrictions requires specific tools and techniques to ensure seamless functionality.
This article explores the best approaches for debugging web and native apps on an iPad.
Why should one perform iPad debugging?
Debugging on iPads is essential to ensure seamless performance, given their widespread adoption across industries. Here’s why iPad debugging is crucial:
- Dominance in the Tablet Market: The iPad remains a leading choice across various industries, including education, finance, healthcare, and hospitality.
- Ensuring App Performance: With widespread usage, iPad applications must function seamlessly across different models and iOS versions.
- Apple’s Development Ecosystem: Since iOS development is centered around Xcode, understanding its debugging tools is crucial for optimizing app performance.
- Testing Beyond Xcode: While Xcode is essential, real-world testing on actual devices ensures better accuracy and reliability.
For teams looking to streamline iPad testing and debugging, cloud-based solutions provide an effective way to test apps on real devices without requiring an extensive in-house setup.
Also Read: How to test App on iPhone using Xcode?
Pre-requisites for iPad Debugging
Below are the pre-requisites that you need for iPad debugging:
- To begin, you need access to a development machine which in this case has to be a Mac-based computer.
- Next, you need to install the latest version of Xcode, from the app store or their website.
- Once you have Xcode set up on your computer, you are ready to start working.
- Xcode has the option to spin up iPad simulators.
- If you don’t have a physical device you can debug using BrowserStack Live and App Live platforms. You can sign up for free or purchase a plan to begin.
Debugging Websites and Web Apps
Debugging websites and web apps on an iPad ensures smooth functionality, responsiveness, and cross-browser compatibility. Safari’s Web Inspector is a key tool for efficient debugging, while real device testing helps identify touch, performance, and layout issues missed on emulators.
Below are the steps:
Debug Websites on a Physical iPad
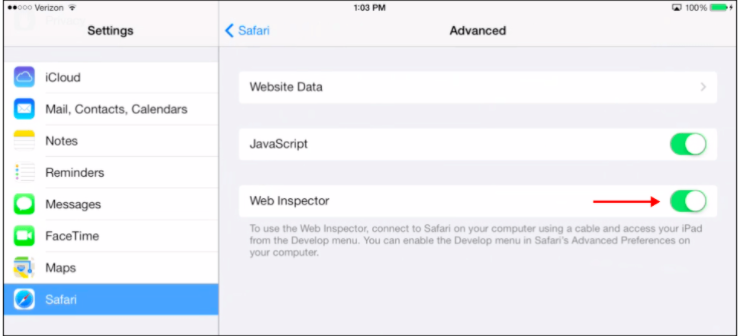
To debug website on iPad, the first step would be to enable web debugging on the device:
- Go to Setting > Safari on the device.
- Scroll to the bottom and click on the Advanced menu.
- Enable the Web inspector option
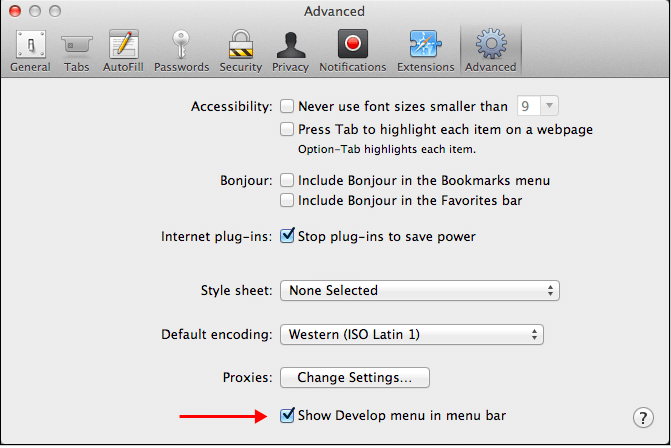
After enabling web inspector, you need to now enable developer mode on the computer:
- Open the Safari browser.
- From the Safari menu on the top left corner of the screen open preferences.
- Go to the advanced section in the preferences Window.
- Check the show develop menu in the menu bar option.
After enabling developer mode on the computer:
- Connect the device to the computer using an appropriate cable.
- Open the web application in a Safari window on the mobile device.
- On the computer, with safari open click on the Develop menu on the top bar.
- In the develop menu you should be able to see the device listed.
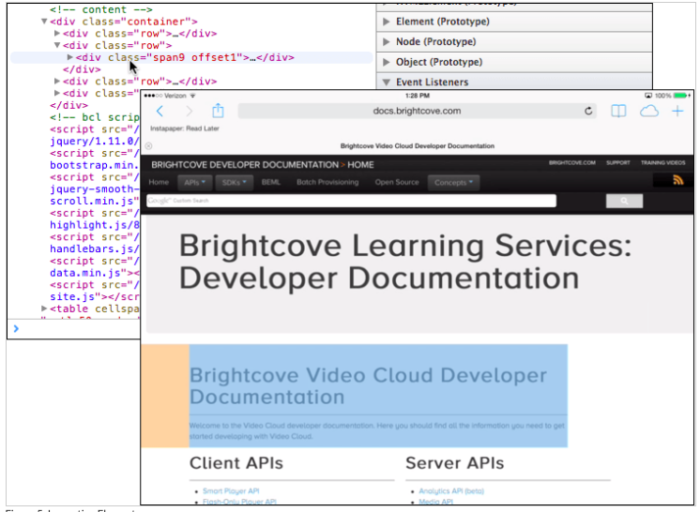
- Clicking on the device name will open a small window listing the page name and URL.
- Click on the URL and you should see the develop window on the computer.
Debug Website on iPad with BrowserStack Live
To debug website on iPad through BrowserStack Live is a much simpler and straightforward process. All you need is a BrowserStack account to get started. If you are using a free account and the device you want to test on is not enabled, you will have to upgrade your account to access it.
- Log in to the BrowserStack live dashboard
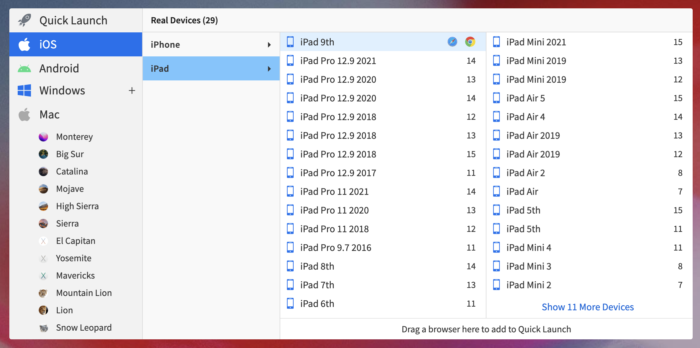
- Hover over the device that you want to test on and it should show you options for available browsers.
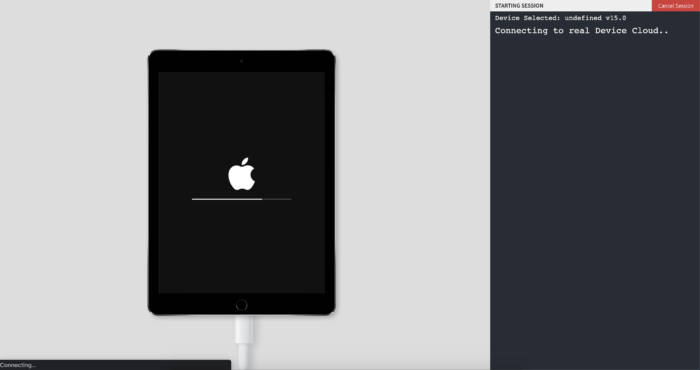
- Click on the browser of your choice and the session will start.
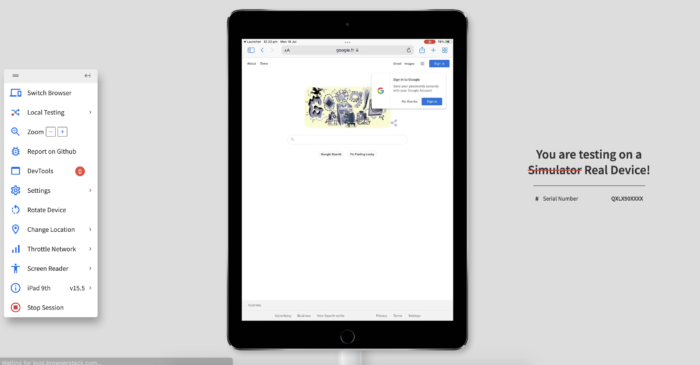
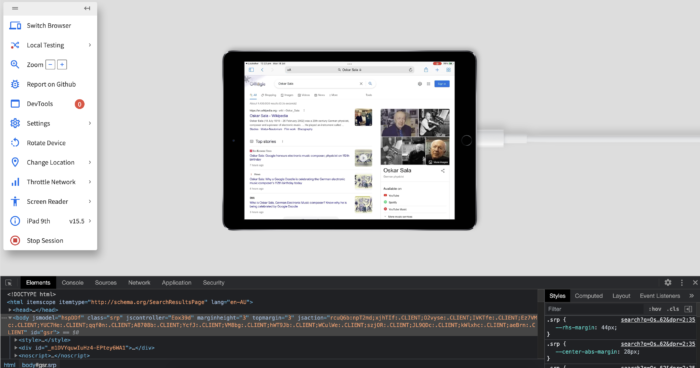
- Once your session is successfully started you can simply access any link through the browser and perform an in-depth analysis.
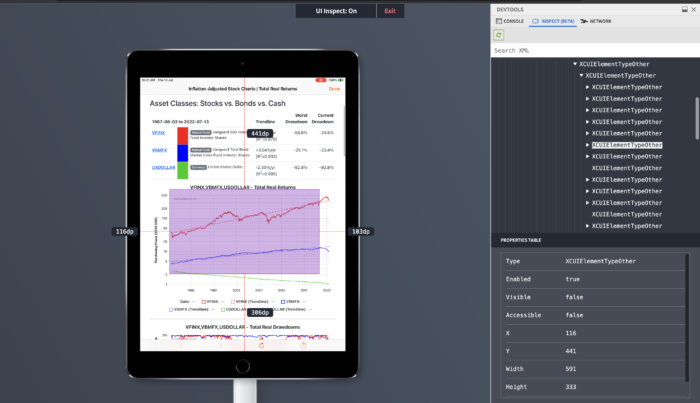
- To access the developer tools you just need to click on the DevTools option in the toolbar on the left-hand side.
Latest Devices & iPadOS: iPad 9th & iPadOS 15, now available on Real Device Cloud to debug website on iPad
Debugging Native Apps
Debugging native apps on an iPad is crucial to ensure optimal performance, stability, and a seamless user experience across different iOS versions.
Testing on real devices helps catch hardware-specific bugs and performance bottlenecks that emulators may overlook.
Below are the steps:
Debug Native Apps on a physical iPad
Debugging a native iOS app with a development setup running Xcode with app code accessible through the navigator, you can simply use the built-in tools.
Enable Developer Mode on the iPad:
- On the device, go to Settings > Security & Privacy
- Scroll to bottom of the section and select Developer Mode
- Enable the Developer Mode toggle
- It will show a security warning prompting for another confirmation.
- Restart after confirmation
- After the device is restarted, it will ask for your password to enable the ability to install apps from Xcode.
- This is the final confirmation and you can install apps through Xcode now.
Configure Build Settings:
- Access the application code in Xcode Navigator.
- Under the Project Navigator select the project you want to configure.
- Click on the Build Settings tab on the project area.
- Update the Architecture setting to the device you are building for.
Set Debug Points
The word debug in the context of application development means analyzing the application execution in a controlled environment. Monitoring the overall flow and state of various application parameters at different stages.
To do this you need to define Breakpoints, which are triggers for the code execution to pause. There are a number of different types of debug points you can set in the Xcode environment:
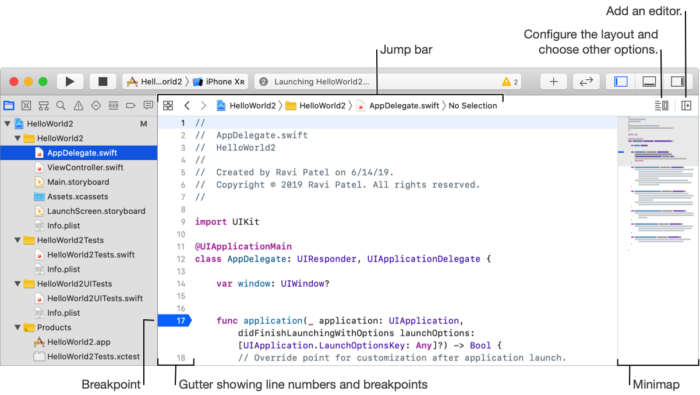
- To set the breakpoint on a line of code, click on the gutter area on the left of the code line number.
- Highlighted on click means the breakpoint is active.
- You can move, disable or set breakpoint options on individual breakpoints.
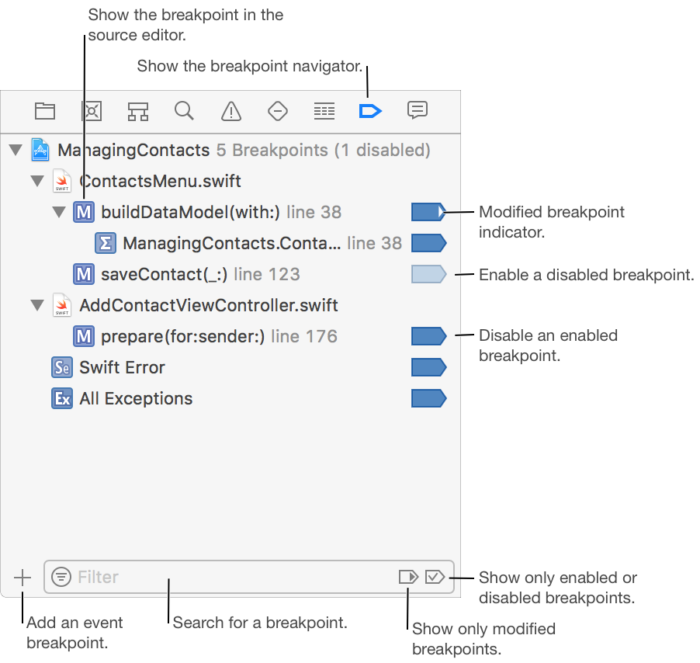
You can use the breakpoint navigator to set breakpoints on various events:
- At the bottom of the breakpoint navigator click on the Add button (+)
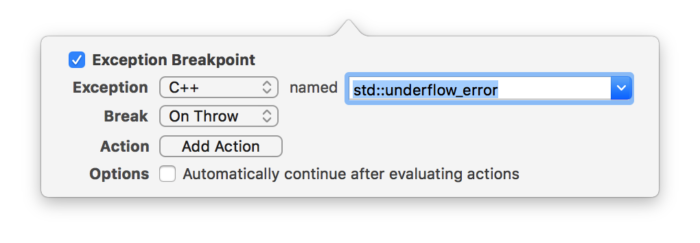
- To set breakpoint on exception event select the Exception Breakpoint checkbox
- You can set breakpoints on specific language and error name.
- You can also set a breakpoint on a Swift exception by checking the Swift Error checkbox
- Select the Symbolic Breakpoint checkbox to set a breakpoint on method executions
- Type the method name under the symbol field
- If more than one modules have the same method, you can enter the module name under the symbol field to specify
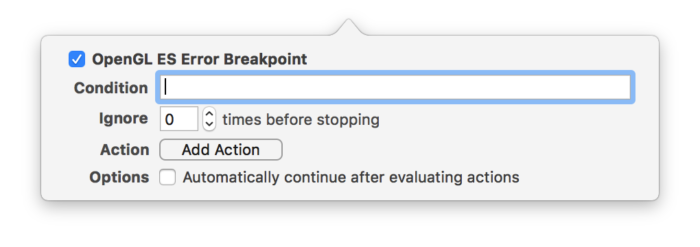
- You can set breakpoint actions with different breakpoints to execute scripts, log messages or play sounds when a breakpoint is hit.
With proper breakpoints set up we can now move to the next step to create an executable binary for the application and run it.
Build the binary and run on the device:
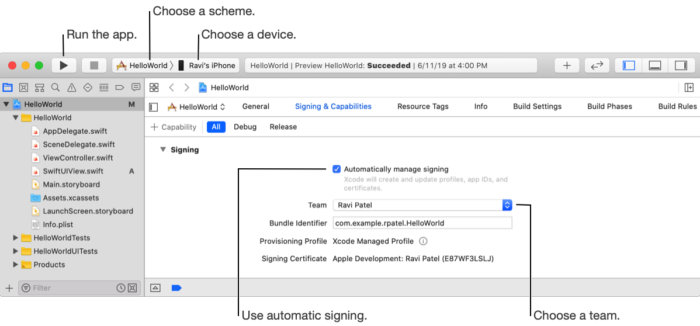
- Go to the Toolbar and open the scheme pop-up menu
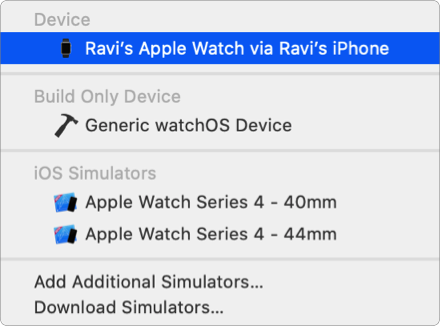
- If you have enabled developer mode and successfully connected your device to the computer, it should show up in the list of devices.
- If your device shows up under the Unavailable Devices list, hovering the mouse over the device will show the reason for the problem, which can help you resolve connectivity.
- In the Signing & Capabilities section, you need to register the device and link to your developer account in order to proceed.
Xcode also provides the ability to pair and run apps on a wireless device.
Debug Native iPad Apps On BrowserStack App Live
To debug iPad app on BrowserStack App live:
- Log in to App live Dashboard with your BrowserStack credentials.
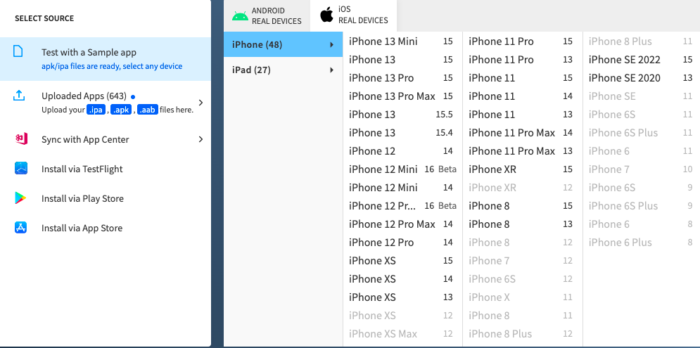
- You can upload your app as a binary (.ipa file) or download it from the App store.
- Select the Device version to launch your session
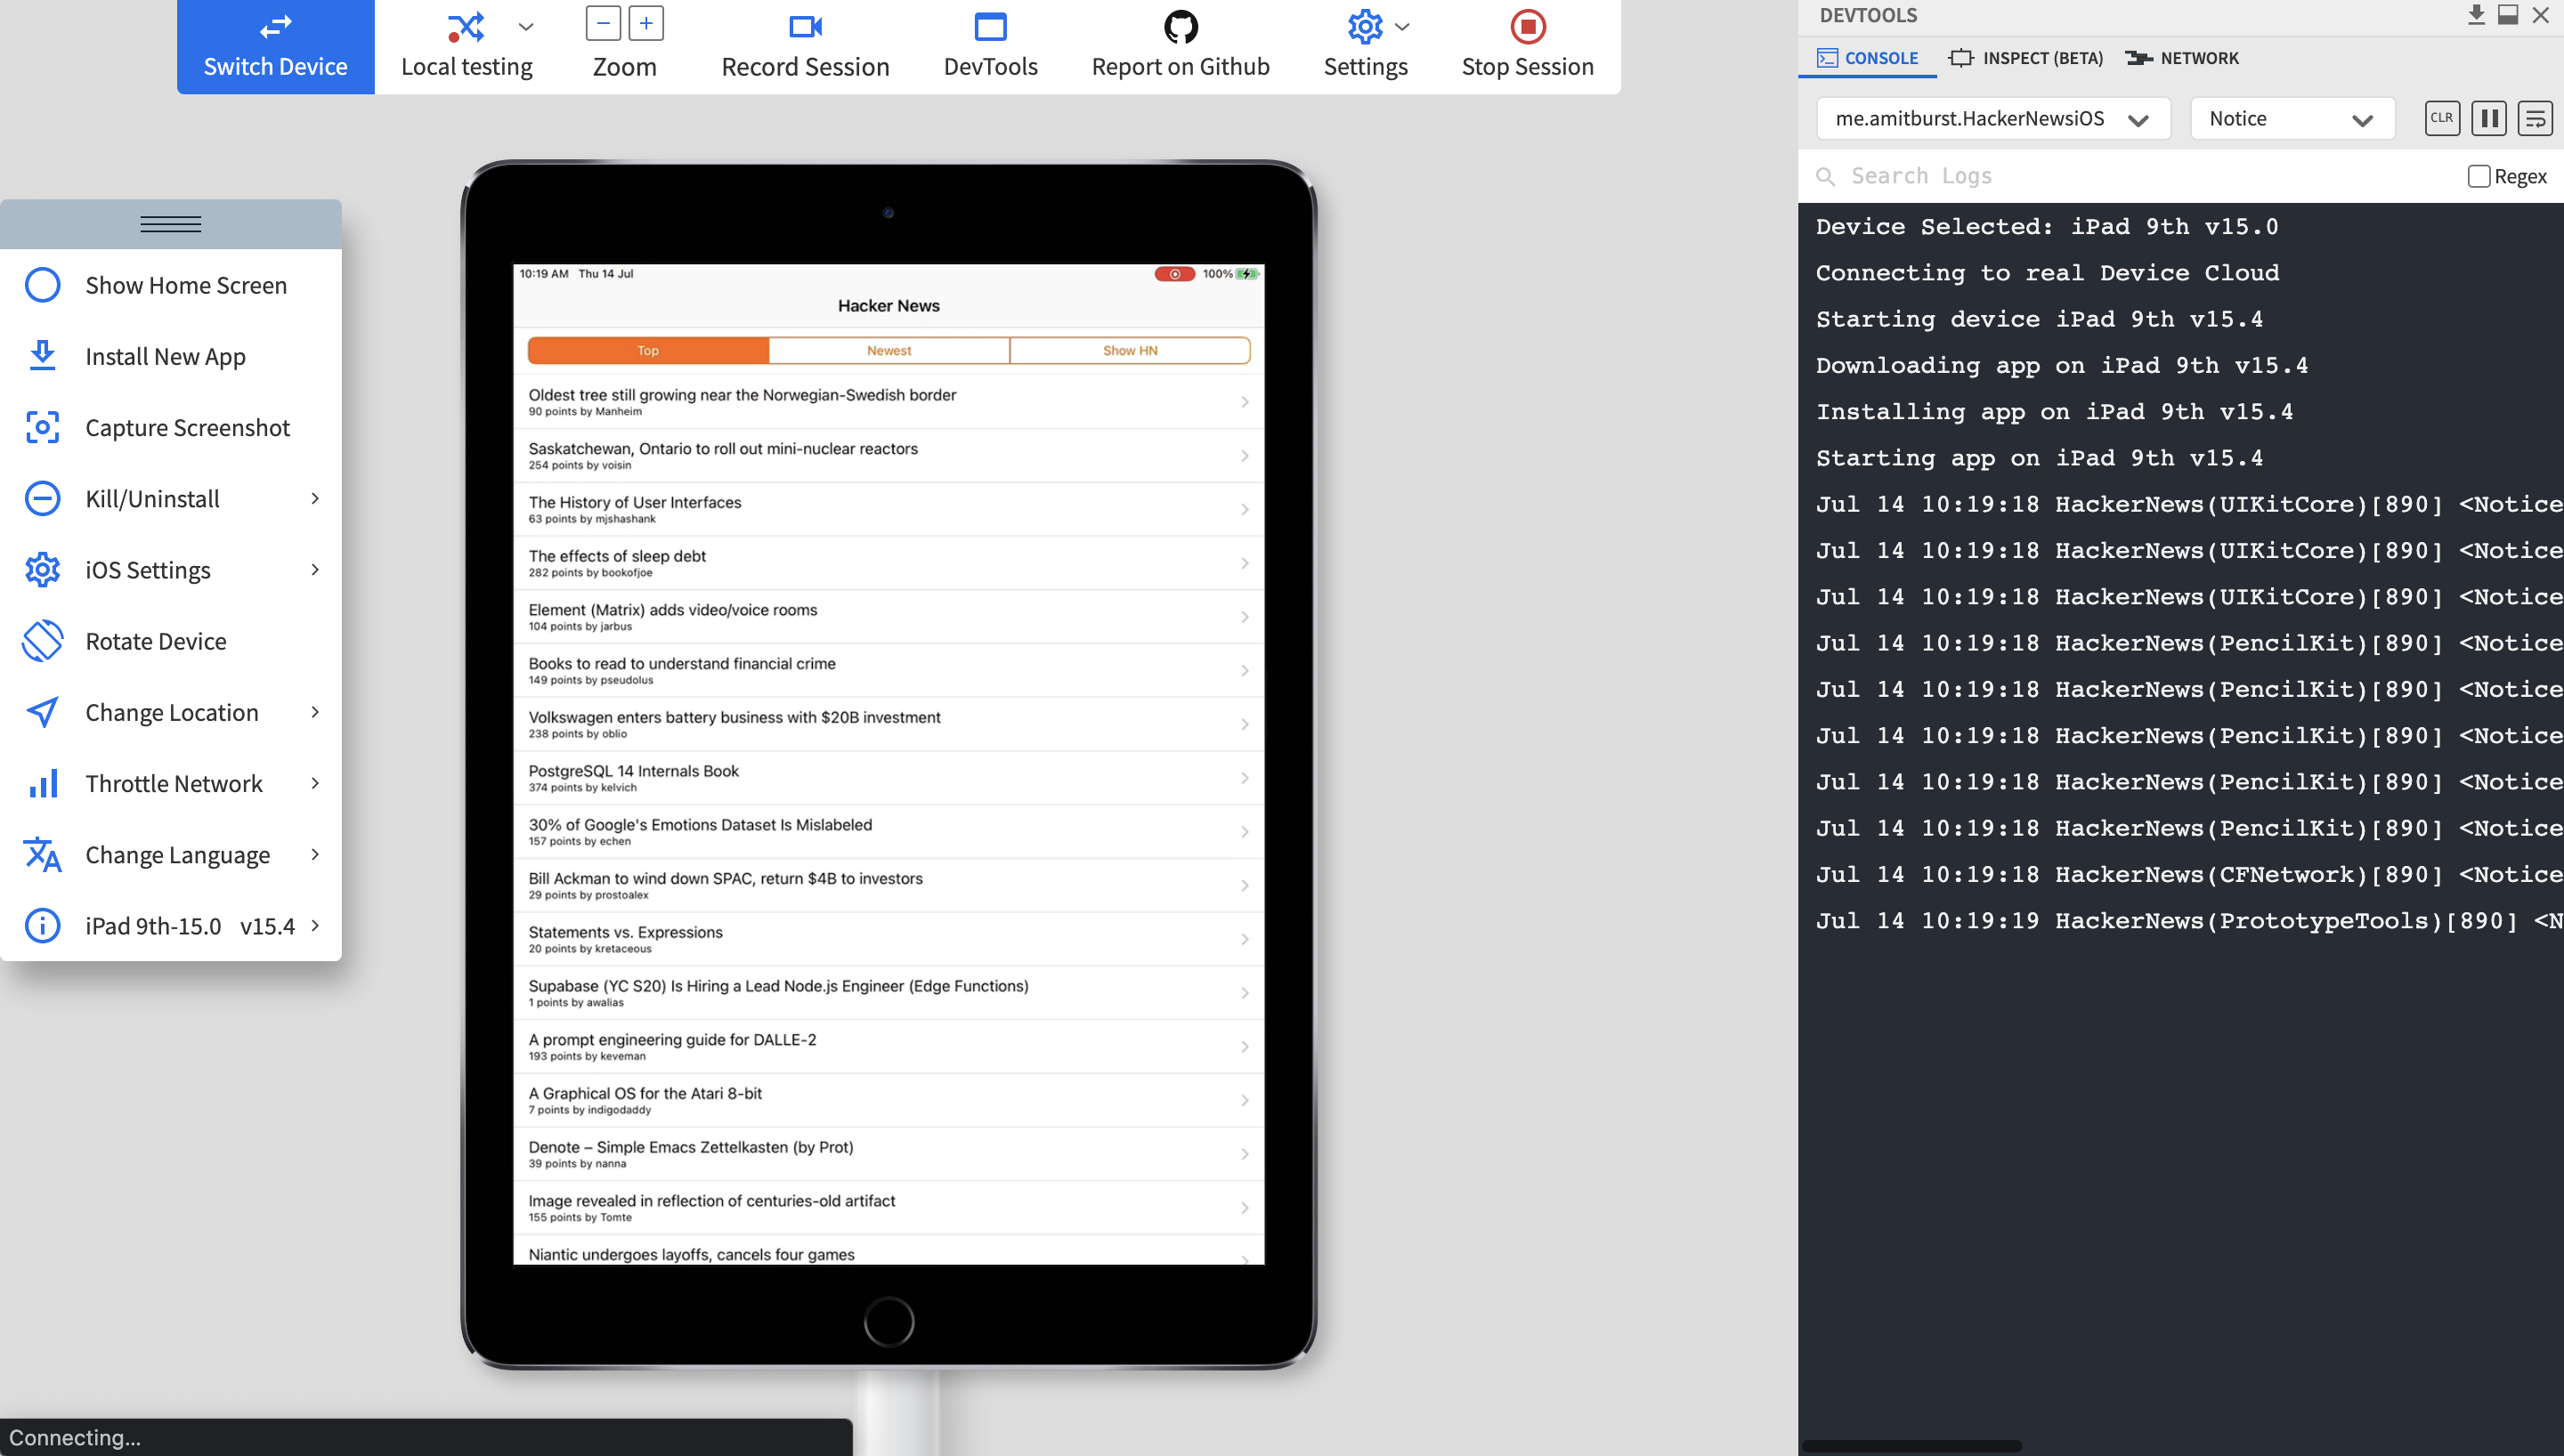
- After the connection is complete you will be presented with a live device with your app running on it
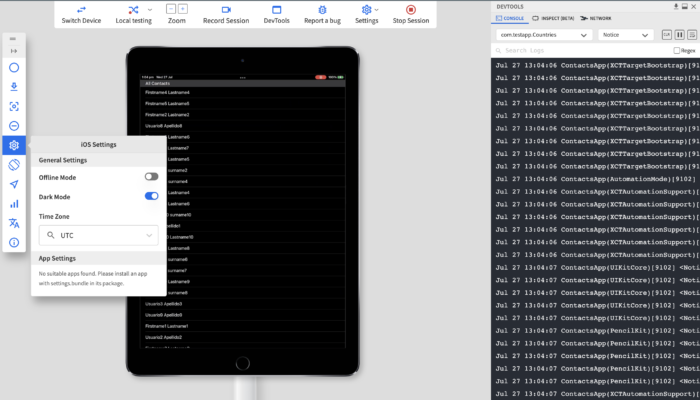
- At the top is the session control bar, from where you can manage your session including, device, local testing, session recording and more.
- Clicking on the DevTools window will launch a section that shows logs.
- The Devtools section can be used to monitor console, network logs, and UI inspection.
- A search bar with built-in RegEx search allows you to find relevant entries amongst the logs.
- On the left side you see another floating toolbar that controls many in-device features and functions.
- If you have integrations with your BrowserStack account, you can directly log bugs from your App live session and share them with your team.
Latest Devices & iPadOS: iPad 9th & iPadOS 15, now available on Real Device Cloud to debug website on iPad
Conclusion
Although it is possible to debug iOS applications and devices in depth using their native tools, you can clearly see that by having access to BrowserStack Live and App Live, even non-coding team members can easily debug application and device behavior on a real-device cloud.
- Debugging to find the root cause of an issue is only part of the larger defect identification and resolution workflow.
- Data visualization with BrowserStack can speed up processes by sharing access across teams, record sessions/logs, and log defects directly from the BrowserStack portal.
- Regardless of the method used for testing iOS Apps, the primary goal is to prevent maximum bugs or issues from occurring in the production stage.
- This can be only achieved when iOS apps are comprehensively tested on real devices.
Whether your company opts to debug website on iPad or debug iPad app, testing them on real iOS devices on the BrowserStack cloud is the most ideal method as it helps QAs to yield accurate test results and resolve critical bugs faster.
BrowserStack being the testing ecosystem’s frontrunners, new iOS devices, and operating systems are added and updated routinely, so you can rest easy knowing that your test environment stack will stay up to date.
