
Log contextual information using console annotations
Use console annotators to customize logs that you send to BrowserStack from the test script for debugging or tracking.
Your test script contains contextual information related to the test, such as description of the test, start and end of scenarios, or any other data that you want to print on the console for debugging and tracking. Using console annotations, you can add configurations in your tests that will log this information on BrowserStack. These logs are available on the App Automate Dashboard along with the other text logs. These logs provide a way for you to quickly search and go to a specific section of the test and troubleshoot any failed tests.
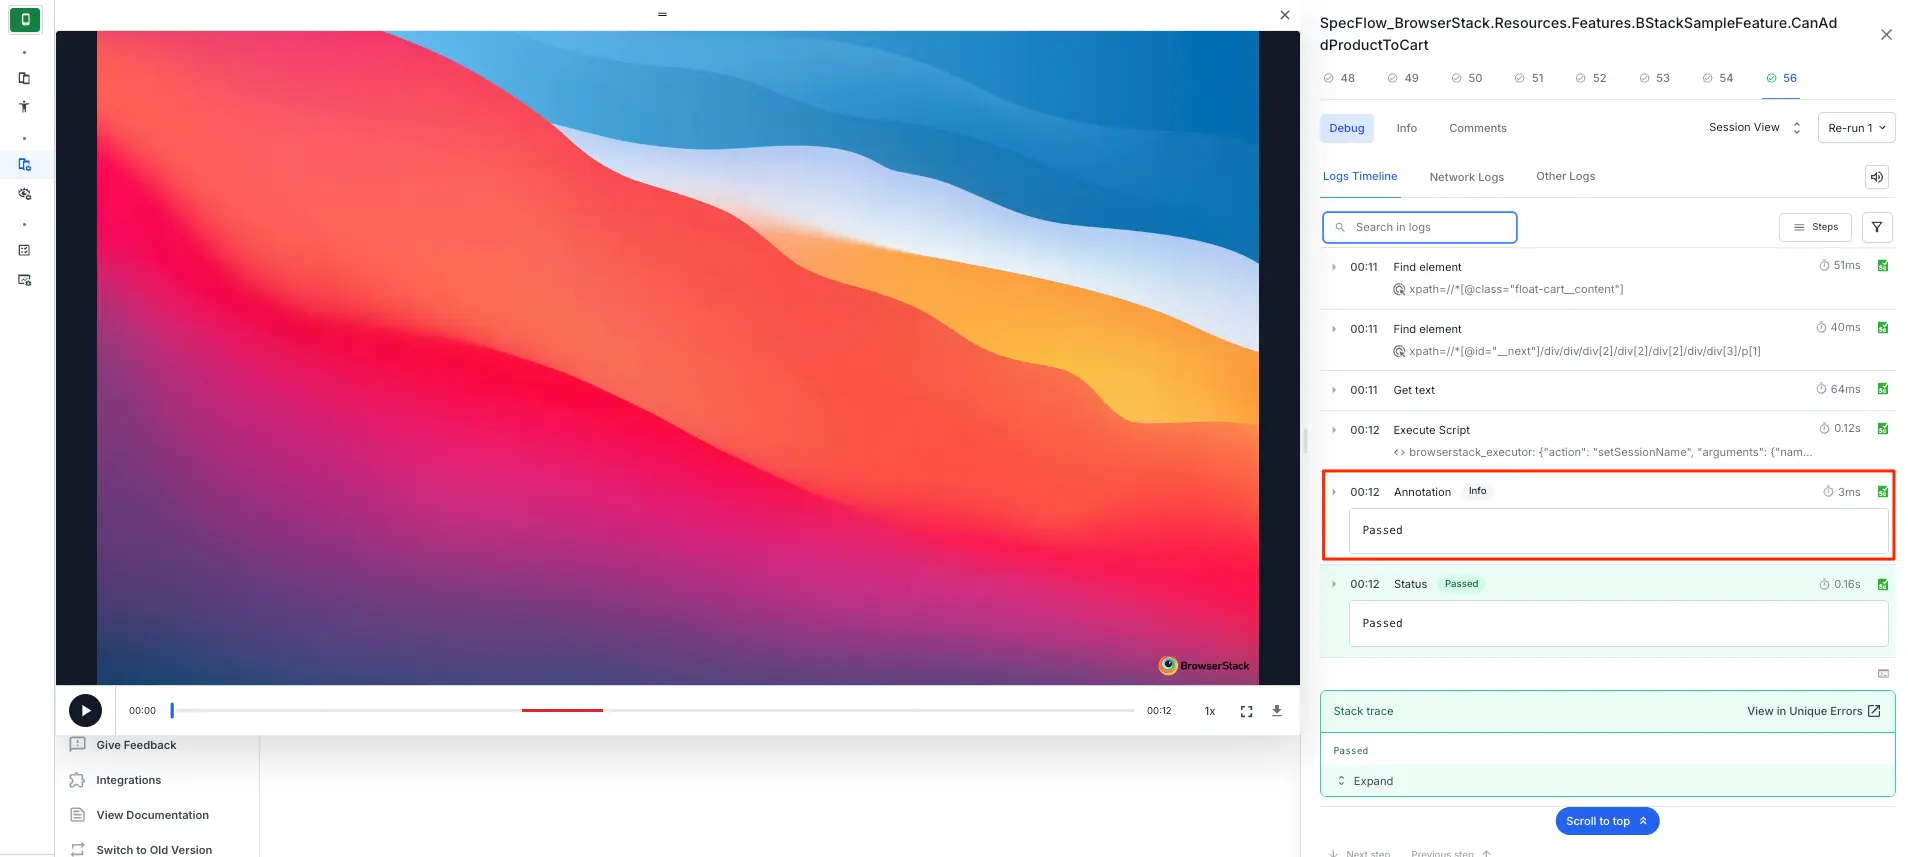
After you run a test that includes console annotations, you can view these logs with the annotations on the App Automate Dashboard as shown in the following example:
Send logs to BrowserStack using JavascriptExecutor
You can send annotations to BrowserStack within the test script using the the annotate action implemented through the JavascriptExecutor as shown in the following snippets:
JavascriptExecutor jse = (JavascriptExecutor)driver;
jse.executeScript("browserstack_executor: {\"action\": \"annotate\", \"arguments\": {\"data\": \"<any string>\", \"level\": \"<info/warn/debug/error>\"}}");
driver.executeScript('browserstack_executor: {"action": "annotate", "arguments": {"data":"<any string>","level": "<info/warn/debug/error>"}}');
((IJavaScriptExecutor)driver).ExecuteScript("browserstack_executor: {\"action\": \"annotate\", \"arguments\": {\"data\":\"<any string>\", \"level\": \" <info/warn/debug/error> \"}}");
$web_driver->executeScript('browserstack_executor: {"action": "annotate", "arguments": {"data":"<any string>", "reason": "<info/warn/debug/error>"}}' );
driver.execute_script('browserstack_executor: {"action": "annotate", "arguments": {"data":"<any string>", "level": "<info/warn/debug/error>"}}')
caps["javascriptEnabled"] = "true" #Additionally, include this capability for JavaScript Executors to work

driver.execute_script('browserstack_executor: {"action": "annotate", "arguments": {"data":"<any string>", "reason": "<info/warn/debug/error>"}}')
The arguments passed in the JavaScript method for setting the status and the corresponding reason for the test are data and level.
-
dataaccepts a value in string data-type. -
levelaccepts the standard log severity levels, namelyinfo,debug,warn, anderror. This argument is optional with the default value ofinfo.
Searching and Filtering
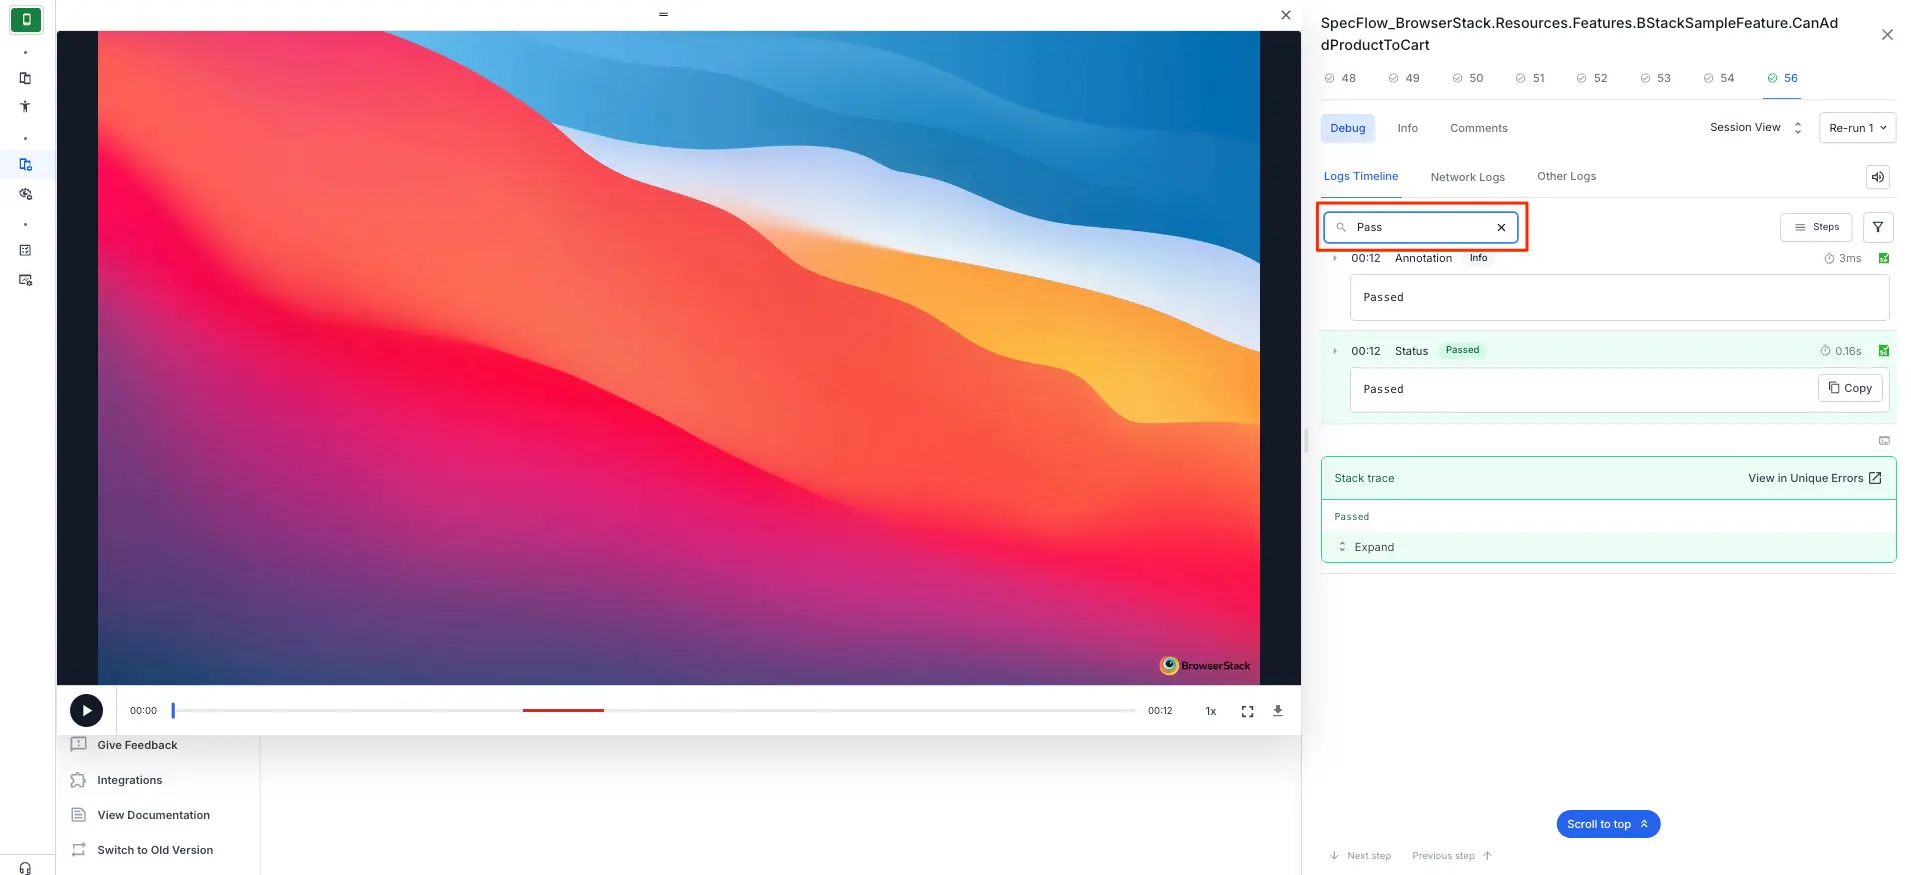
After your test script has sent console annotations to BrowserStack, you can find all the annotations pushed to the logs in the Text Logs tab on the App Automate dashboard.
You can either search with the logged text in the searchbar or directly navigate to the section of test execution where you want to troubleshoot. This search feature is particularly helpful when your test sessions run for a long duration.
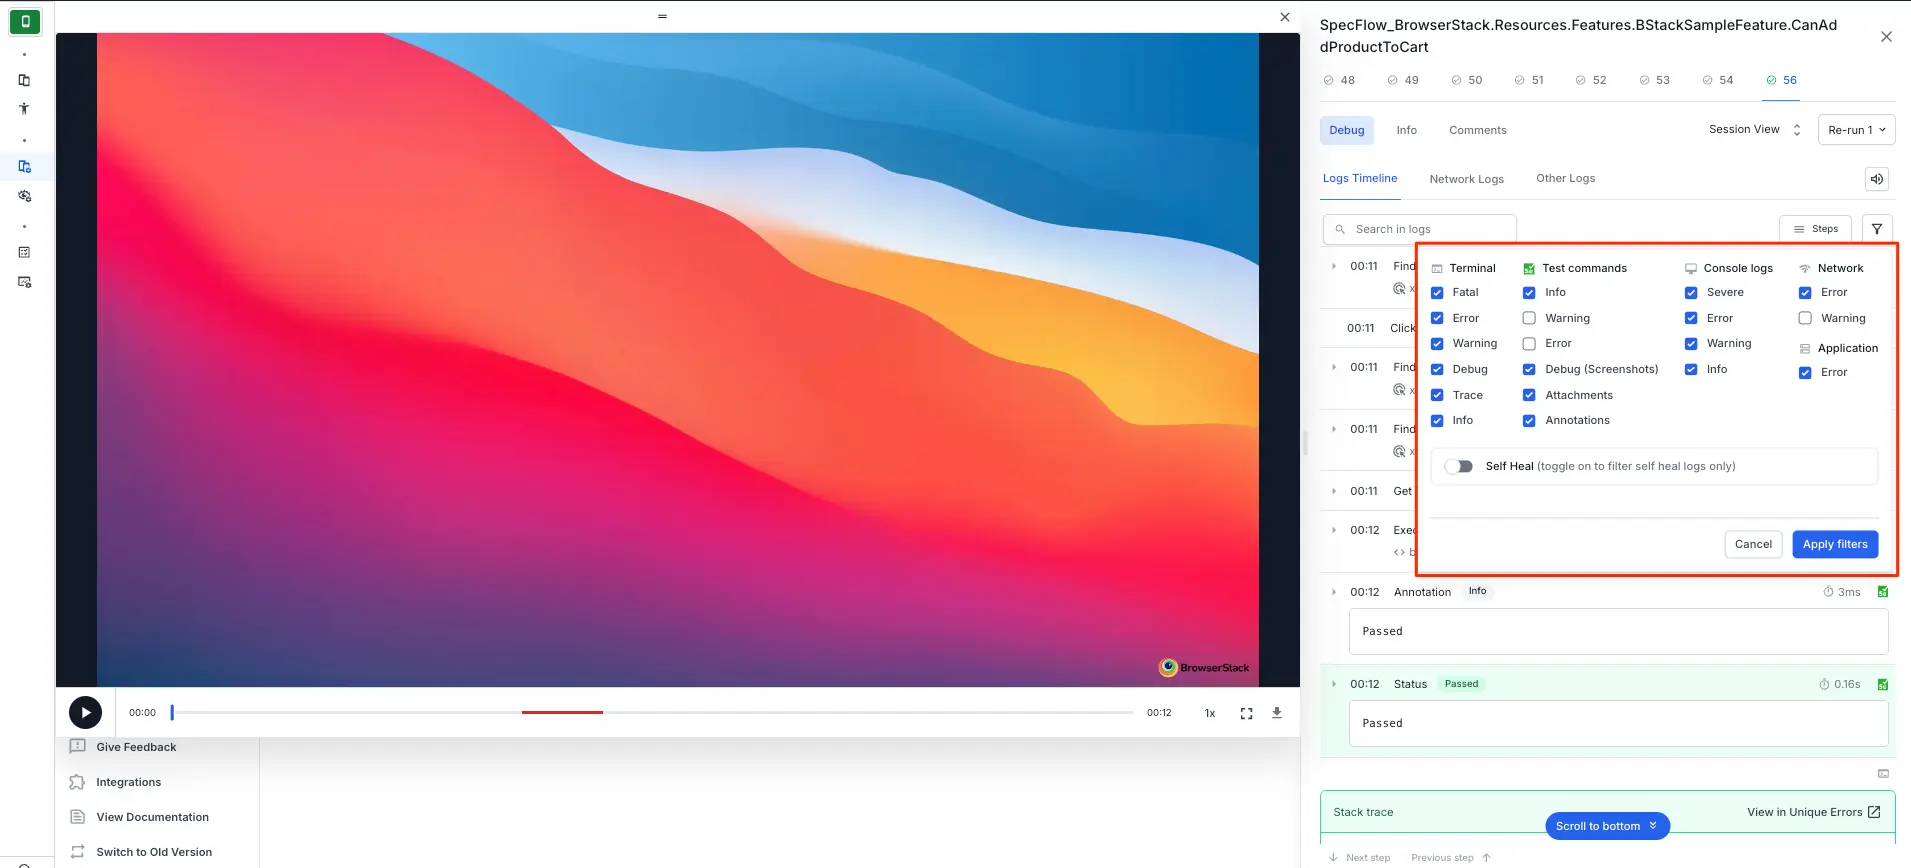
You can also filter these annotated logs based on the severity levels and customize the selection based on your logging patterns.
Related topics
Check this page for a list of various JavaScript Executors that BrowserStack offers.
We're sorry to hear that. Please share your feedback so we can do better
Contact our Support team for immediate help while we work on improving our docs.
We're continuously improving our docs. We'd love to know what you liked

We're sorry to hear that. Please share your feedback so we can do better
Contact our Support team for immediate help while we work on improving our docs.
We're continuously improving our docs. We'd love to know what you liked
Thank you for your valuable feedback!