Mobile browser debugging is essential for ensuring seamless user experiences across different devices and browsers.
From screen freezes to crashes and broken functionality, most issues stem from underlying bugs in the code. Identifying and fixing these bugs efficiently requires the right debugging techniques and tools.
This guide explores the importance of mobile browser debugging, common errors, and effective debugging methods using Chrome DevTools and BrowserStack.
What is Mobile Browser Debugging?
Mobile Browser Debugging is the process by which a developer detects and rectifies erroneous pieces of code (known as bugs) for websites running on mobile browsers.
Bugs can cause the software application to behave unexpectedly, stop working, or crash suddenly. In simple terms, debugging is resolving bugs in a software application so that it works perfectly.
A simple debugging process involves the following steps:
- Identify the defect or bug.
- Reproduce the error caused by the bug.
- Seek input from the application to locate the part of the code causing the error.
- Try to record the problem caused by the bug visually.
- Analyze and identify the exact part of the code causing the error.
- Fix the code or bug.
- Test to ensure that no new bugs occur due to the changes made in the code.
Sometimes, people confuse debugging and testing – Debugging involves fixing bugs and errors, whereas testing helps a developer learn the impact of an error on an application.
Importance of Mobile Browser Debugging
Mobile browser debugging ensures seamless functionality, enhances user experience, and reduces long-term costs.
Here’s why it matters:
- Delivers a Bug-Free Product: Debugging helps detect and fix issues before the software reaches users, ensuring a smooth experience.
- Reduces Cost of Fixing Bugs: The cost of fixing a bug increases significantly at later stages of development, making early debugging essential.
- Enhances Software Quality: Debugging ensures the final product meets performance, security, and usability standards.
- Improves Developer Skills: Identifying and resolving bugs allows developers to gain insights and prevent similar issues in future projects.
- Speeds Up Future Debugging: With experience, developers become more efficient in identifying and resolving issues quickly.
- Optimizes Performance: Debugging helps eliminate inefficiencies, reduce load times, and improve responsiveness.
- Prevents Post-Release Failures: Catching bugs early prevents major issues that could impact user trust and business reputation.
- Supports Cross-Browser Compatibility: Ensures applications work seamlessly across different mobile browsers and devices.
Also Read: How to Perform Remote Debugging in Chrome
Types of Errors in Websites running on Mobile Browsers
Below are some common types of errors that developers come across while developing software:
- Syntax Errors: These are very common coding errors that can be caused due by spelling mistakes, the addition of extra brackets, etc. These are generally recognized by the compiler while running a software code. For example, if the developer forgets to put simple parentheses in a line of code, it can cause a syntax error.
- Run-time Errors: These errors generally occur while executing a software code. These errors can occur even after the developer has completed an initial debugging of the software because of the device’s incorrect interpretation of the new code. To fix this, the developer must provide all the information needed to execute the software. For example, suppose your application takes its input from a form, and the app capitalizes the first letter of all the input names. Then, the app will experience a runtime error if the form doesn’t have the first name in any of the fields.
- Logic Errors: These are algorithmic issues in a software code. These errors cause the application to produce an unexpected output or crash unexpectedly. These errors can be caused when you interchange mathematical symbols in a code. For example, confusing the American Units and English Units can cause logical errors or calculation offsets in the output.
- Interface Errors: These errors involve a missing link in an Application Programming Interface (API). These errors can be present due to incorrect code in just one or both the coding languages in the API. For example, suppose that an API requires certain parameters to be defined in order to work, but if those parameters aren’t defined, then an interface error will occur.
- Compatibility Errors: These errors occur when a user uses different versions of the same software or similar software for activity, and those cannot communicate with each other properly. For example, a compatibility error occurs when a word document compiled in the 2016 version is opened in Word 2010, and certain features like embedded videos don’t work in the 2010 version.
How to Debug Mobile Browser in Desktop
Debugging mobile browsers on a desktop can significantly streamline the process of testing and optimizing websites for mobile devices.
Below are two methods on how to debug mobile browser in desktop.
Method 1: Debug Mobile Browser Using Mobile Chrome DevTools
Below are the steps to debug mobile browser using Mobile Chrome DevTools
Step 1: Enable Developer Options and USB Debugging on the Android device.
Step 2: Connect the device to the computer using a USB cable and approve the connection.
Step 3: Open Chrome DevTools on the computer by pressing F12.
Step 4: In DevTools Settings, enable Discover USB devices and open Remote Devices under More Tools.
Step 5: Go to chrome://inspect#devices in Chrome on the computer to detect the connected phone.
Step 6: Open Chrome on the mobile device and load the webpage to be debugged.
Step 7: Click Inspect next to the webpage in DevTools to start debugging.
Method 2: Perform Mobile Browser Debugging using BrowserStack
Learn how to perform debugging on real mobile devices using BrowserStack. Follow the steps below to understand the process of mobile browser debugging using BrowserStack Live:
- Signup and create a free account on BrowserStack Live.
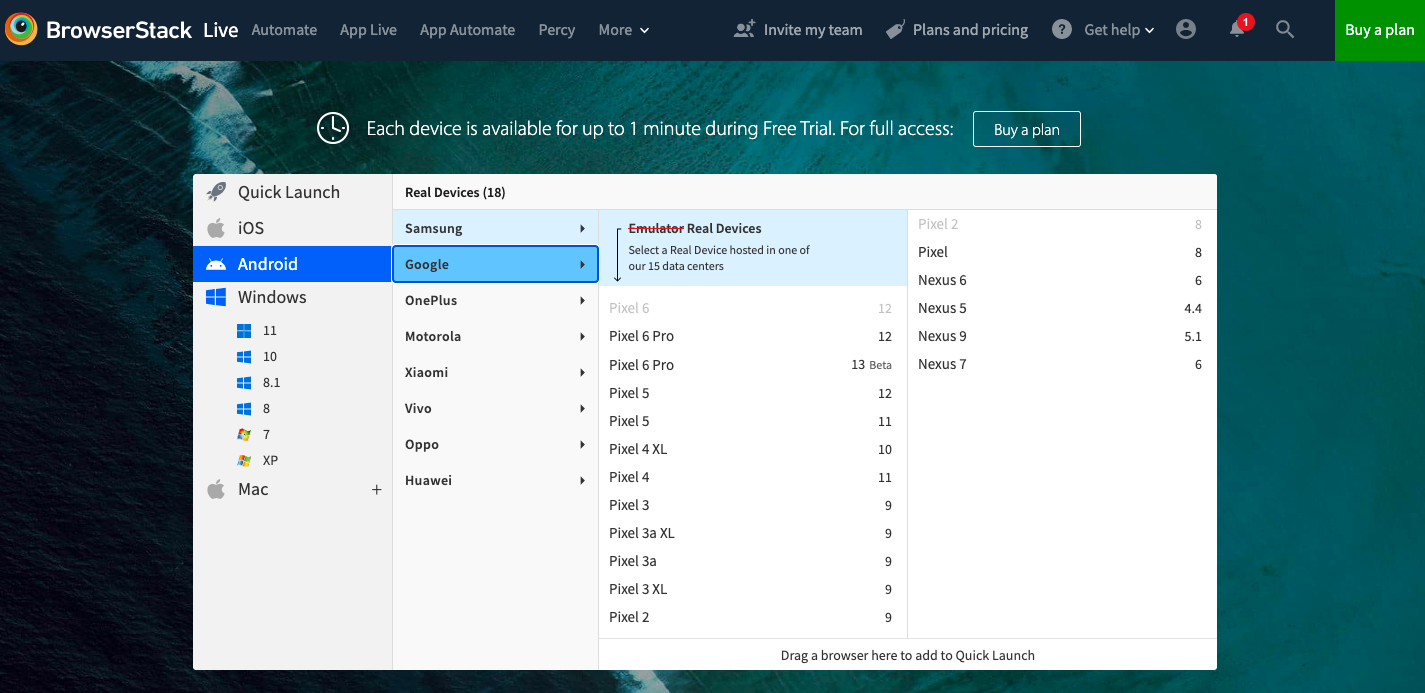
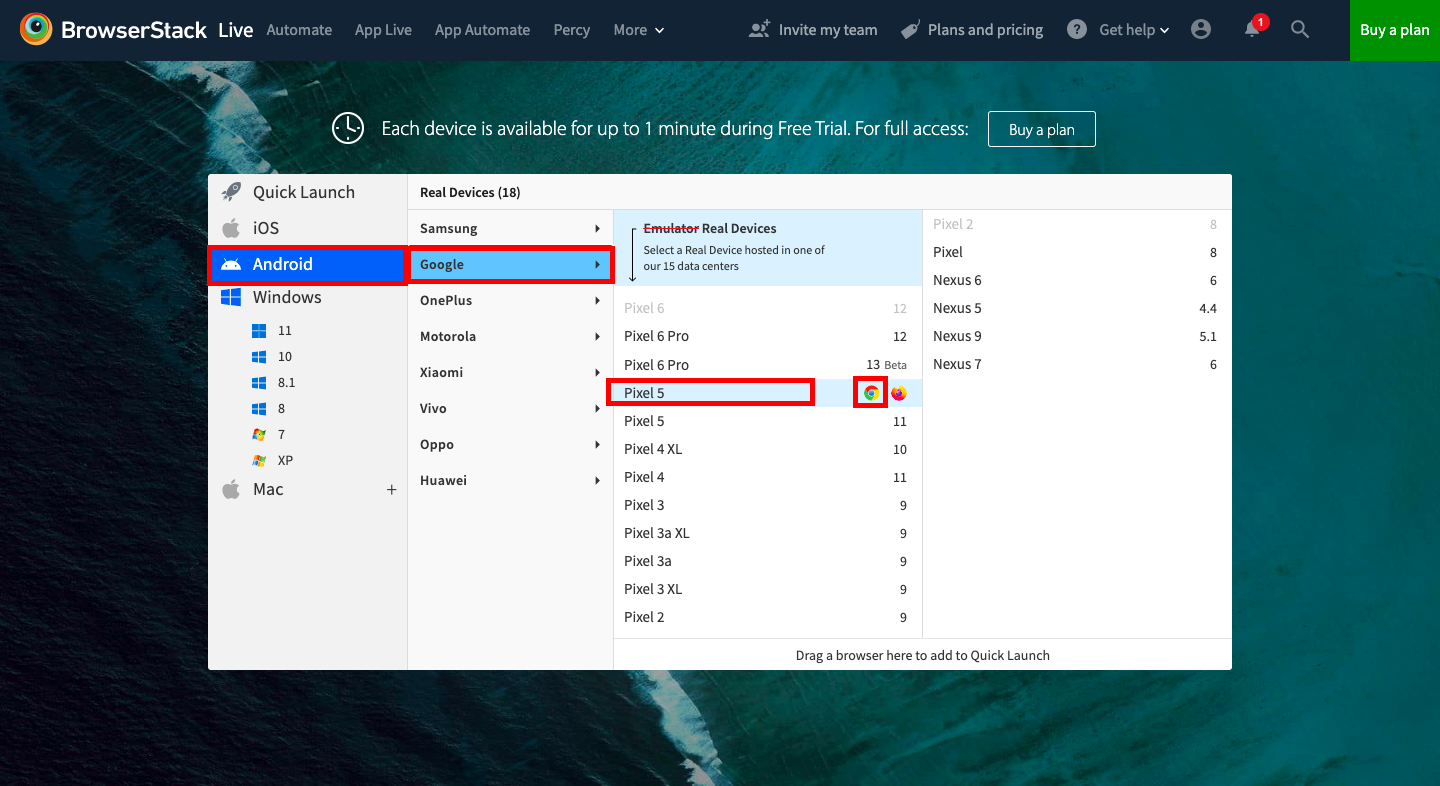
- Go to Live Dashboard and select Android Operating System from the options on the left-hand side.
- Then, simply hover the cursor on the device with which you are facing issues. Let’s assume the device to be Google Pixel 5.
- As soon as you hover over your desired phone, you will view the options of browsers. Select the Chrome option.
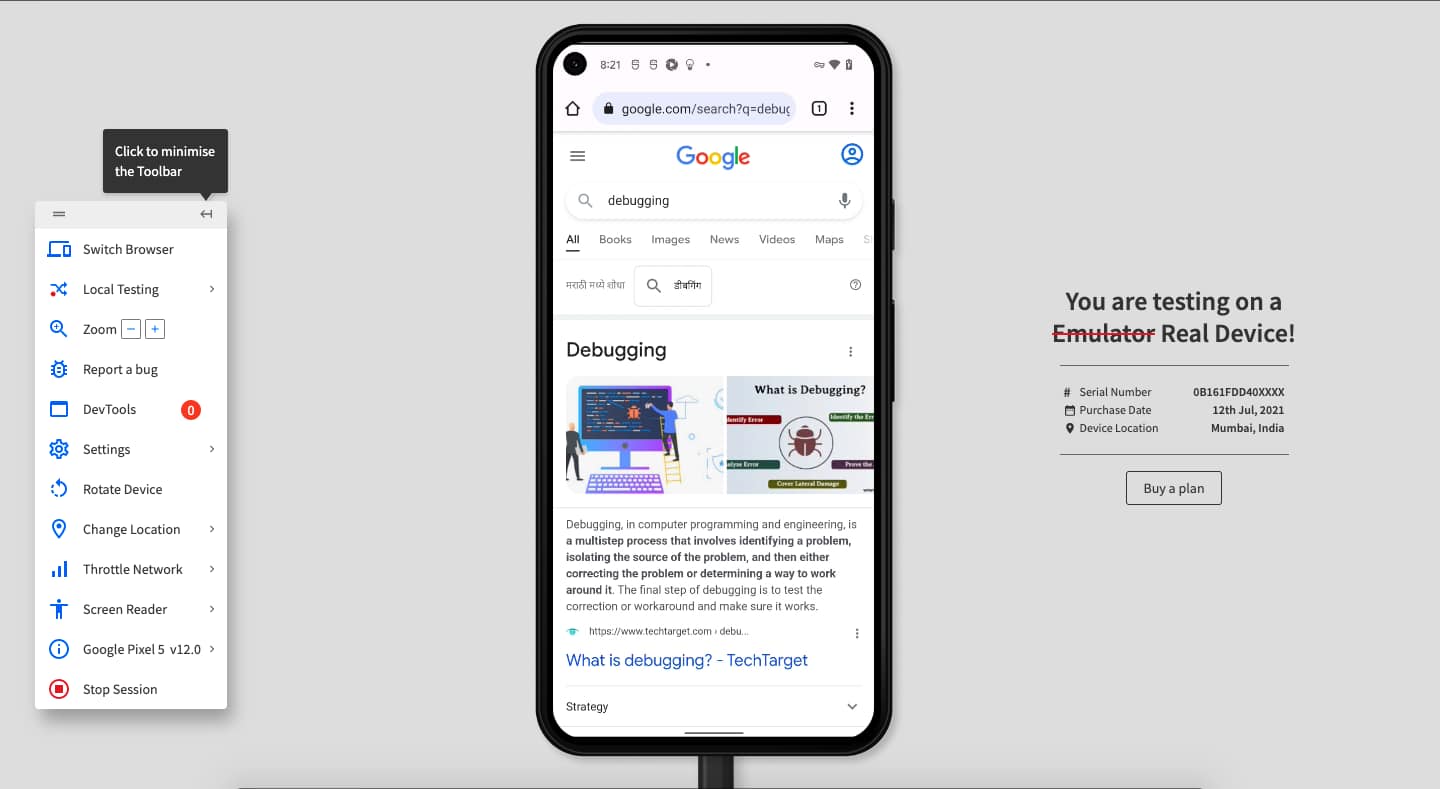
- Then, a Live debugging session will begin on a real Google Pixel 5.
- Using the DevTools from the toolbar, you can begin debugging your desired website on the Live debugging session.
Benefits of Debugging Websites on Mobile Browsers with BrowserStack
A developer is often tasked to debug a website on a browser for a certain mobile device. Given the device fragmentation, purchasing and maintaining an on-premise device farm is costly. This is where BrowserStack helps you. BrowserStack offers an innovative way to debug browsers using real device cloud. It enables interactive testing under real user conditions and can help you debug browsers 3500+ devices and browsers.
You can sign up and start testing instantly. Using BrowserStack, you can perform actions like testing from a different location, local testing, bug reporting, network throttling, etc:
- Change Location: This feature enables developers to test to perform geolocation testing. Geolocation testing allows you to view and test your websites and apps from 60+ countries.
- Report a Bug: Using this option you can report the bugs directly from the dashboard.
- Local Testing: With Local testing, developers can test local applications that are still work-in-progress.
- Throttle Network: This feature simulates poor network conditions and enables the QA team to examine the website in those situations.
How to Use Mobile Chrome DevTools
Let’s move on to the debugging process of Chrome on the Android Phone:
Step 1 – The first step is to discover the device using Mobile Chrome DevTools. To do that:
- Go to Developer Options and toggle the USB Debugging option to enable it.
- Then, open the Chrome browser on your computer and the DevTools using the F12 function key.
- In the DevTools, go to Settings and enable the option of Discover USB devices.
- In the DevTools, click the three dots at the top right corner and select More tools > Remote Devices.
- You must connect your mobile phone to your computer using a USB cable.
- As soon as you approve the mobile phone, you will notice a green dot on the left-hand side. This confirms that your mobile phone is now connected.
You can refer to the official Chrome documentation to learn more about troubleshooting.
Step 2 – Now, we can start debugging the browser on your Android device. Follow these steps:
- Launch Chrome on your computer and navigate to chrome://inspect#devices.
- Now Launch Chrome on your Android phone.
- On the web page opened on your computer, you will see your Android Phone’s model name and serial number. You can also view the version of Chrome running on your mobile phone in parenthesis.
- When you open a webpage on Chrome on your Mobile Device, a special section appears where you can interact with the desired webpage or tab.
- You can also try entering a URL in the text box labeled ‘Open tab with URL’ As you click Open, the page will open on Chrome on your mobile device.
- You can click on ‘Inspect’ on the unique section of the specific URL. This will trigger the opening of a new DevTools instance.
You can Debug any webpage on your Android Phone using these steps.
Conclusion
Mobile browser debugging plays a crucial role in your app development process. It refers to detecting and rectifying errors in a code that cause the application to behave unexpectedly or crash. You can debug your mobile browser using various methods such as mobile Chrome DevTools or BrowserStack App Live.
BrowserStack Live is an innovative method that enables developers to perform debugging on real mobile devices. It offers various other features like Geolocation testing, Responsive testing, Local Testing, Bug Reporting, etc.


