Key Metrics to Improve Site Speed
By Shweta Jain, Community Contributor - December 12, 2024
Creating a good user experience for visitors accessing a website isn’t as easy as implementing a single proven formula. However, paying close attention to specific metrics at regular intervals can provide teams with a number of actionable insights. These insights help teams identify issues that may be worked on in order to improve site speed.
Teams should regularly test a website’s loading time across various device-browser combinations to gather valuable insights for specific pages. This approach helps identify which pages are slow to load and reveals if optimization is needed for certain browsers.
Given that users access websites through a wide range of devices and browsers, testing across all possible combinations can be a challenge without the right tools. Moreover, calculating key metrics—such as Time to First Byte (TTFB), Response Time, Page Load Time, and DOM Processing for each browser—can be a complex and time-consuming task, especially if done manually.
Let’s understand the key site speed metrics
- Metrics to Improve Site Speed
- 1. Time To First Byte (TTFB)
- 2. Transmission Control Protocol (TCP) Connection Time
- 3. DNS Lookup Time
- 4. Page Load Time
- 5. Page Response Time
- 6. DOM Processing Time
- 7. Largest Contentful Paint (LCP)
- 8. First Input Delay (FID)
- 9. Time to Interactive (TTI)
- 10. Total Blocking Time (TBT)
- 11. Connection Time
- 12. Content Download Time
- 13. Rendering Time
- 14. Interactive Time
- 15. Network Payload
Metrics to Improve Site Speed
In today’s fast-paced digital world, website performance plays a critical role in user experience and SEO rankings. Slow-loading websites can lead to higher bounce rates and lower conversion rates.
To optimize site speed, it’s essential to measure key performance metrics that directly impact how quickly a page loads and responds to user requests.
1. Time To First Byte (TTFB)
TTFB measures the time taken from a user’s request to when the first byte of data is received from the server. It reflects server performance and network latency. A lower TTFB ensures a quicker response, improving user experience.
Ideal Value: Less than 200 ms.
Why it matters: High TTFB can indicate server-side issues, such as slow server response times or inefficient backend processes.
2. Transmission Control Protocol (TCP) Connection Time
TCP Connection Time measures the time it takes to establish a connection between the user’s browser and the server. It reflects network performance and latency. Faster TCP connection times result in quicker page loads.
Ideal Value: Less than 100 ms.
Why it matters: High TCP connection times can signal network congestion or issues with routing, which can delay page rendering and degrade user experience.
3. DNS Lookup Time
DNS Lookup Time refers to the duration taken to resolve a domain name to an IP address. It’s the first step in the process of loading a website and is crucial for the speed at which a site becomes accessible to users.
Ideal Value: Less than 50 ms.
Why it matters: Slow DNS resolution can result in increased wait times before a user can access the website, negatively impacting the overall speed and user experience.
4. Page Load Time
Page Load Time is the total time it takes for a page to fully load from the moment the user requests it. This metric includes the time for HTML, images, scripts, and other resources to load.
Ideal Value: Less than 3 seconds.
Why it matters: Longer load times can frustrate users and lead to higher bounce rates, affecting both user satisfaction and SEO rankings
5. Page Response Time
Page Response Time measures the time it takes for a page to respond after a user requests it. It includes server processing and the time it takes to load essential page elements.
Ideal Value: Less than 1 second.
Why it matters: Slow response times can lead to delays in content rendering, negatively impacting the user experience and overall site performance.
6. DOM Processing Time
DOM Processing Time is the duration required for the browser to build the Document Object Model (DOM) from the HTML content. This is crucial for rendering the page’s structure and ensuring functionality.
Ideal Value: Less than 500 ms.
Why it matters: High DOM processing time can delay the visual rendering of the page, leading to a poor user experience and slower interactions with the site.
7. Largest Contentful Paint (LCP)
LCP measures the time it takes for the largest visible content element (such as an image or text block) to load on the page. It is a critical metric for evaluating perceived load speed.
Ideal Value: Less than 2.5 seconds.
Why it matters: A slow LCP indicates that large resources are taking too long to load, which can frustrate users and lead to higher abandonment rates.
8. First Input Delay (FID)
FID tracks the delay between a user’s first interaction with a page (such as clicking a button or link) and the browser’s response to that action. It is a key metric for assessing interactivity.
Ideal Value: Less than 100 ms.
Why it matters: High FID can make the site feel unresponsive, leading to a frustrating user experience, especially on interactive pages.
Read More: How to Increase Website Speed
9. Time to Interactive (TTI)
TTI measures the time it takes for a page to become fully interactive, meaning when all JavaScript is loaded and event handlers are ready to respond.
Ideal Value: Less than 5 seconds.
Why it matters: A slow TTI means users may experience delays in interacting with elements on the page, which can hurt engagement and overall usability.
10. Total Blocking Time (TBT)
TBT measures the total time between First Contentful Paint (FCP) and Time to Interactive (TTI) where the page is blocked from responding to user input due to long tasks.
Ideal Value: Less than 200 ms.
Why it matters: High TBT indicates that JavaScript or other tasks are taking too long to execute, which can lead to sluggish performance and poor user experience.
11. Connection Time
Connection Time measures the time it takes to establish a connection between the client and server, including handshake and SSL/TLS negotiations.
Ideal Value: Less than 100 ms.
Why it matters: Longer connection times can be caused by poor network conditions or slow server responses, leading to slower overall site load times.
12. Content Download Time
Content Download Time refers to the duration required to download the page’s content, including images, scripts, and other assets.
Ideal Value: Less than 2 seconds for critical content.
Why it matters: Slow content download times can increase page load times, resulting in a poor user experience and higher bounce rates.
13. Rendering Time
Rendering Time is the time taken by the browser to paint the visual elements of the page on the screen. It includes both initial rendering and subsequent updates.
Ideal Value: Less than 1 second.
Why it matters: Delays in rendering time can cause a page to appear blank for longer, increasing perceived load time and frustrating users.
14. Interactive Time
Interactive Time measures how long it takes for the page to be fully interactive and responsive to user input. It focuses on how fast the page reacts to clicks, scrolls, and other interactions.
Ideal Value: Less than 5 seconds.
Why it matters: Slow interactive time can cause frustration, especially on dynamic pages where user interaction is frequent, such as e-commerce sites or web apps.
15. Network Payload
Network Payload refers to the size of the data transferred between the server and the user’s browser. This includes all resources required to render the page.
Ideal Value: Less than 1 MB (depending on page complexity).
Why it matters: A large network payload can significantly slow down page load times, especially on mobile devices or slower network connections.
By monitoring and optimizing these metrics, you can ensure faster load times and better overall performance. Focusing on these factors will not only enhance user satisfaction but also contribute to improved search engine rankings and higher conversion rates.
Implementing the right strategies to reduce these key times is essential for delivering a seamless browsing experience.
How to Check Website Loading Time?
To test the loading time of a website across multiple devices and browsers, QA teams need a reliable tool. It should instantly generate a detailed report that provides actionable insights with respect to key metrics like TTFB, Response time, Page load time, etc.
BrowserStack SpeedLab is a one-stop platform where QA testers can test their website speed on a dedicated testing infrastructure.
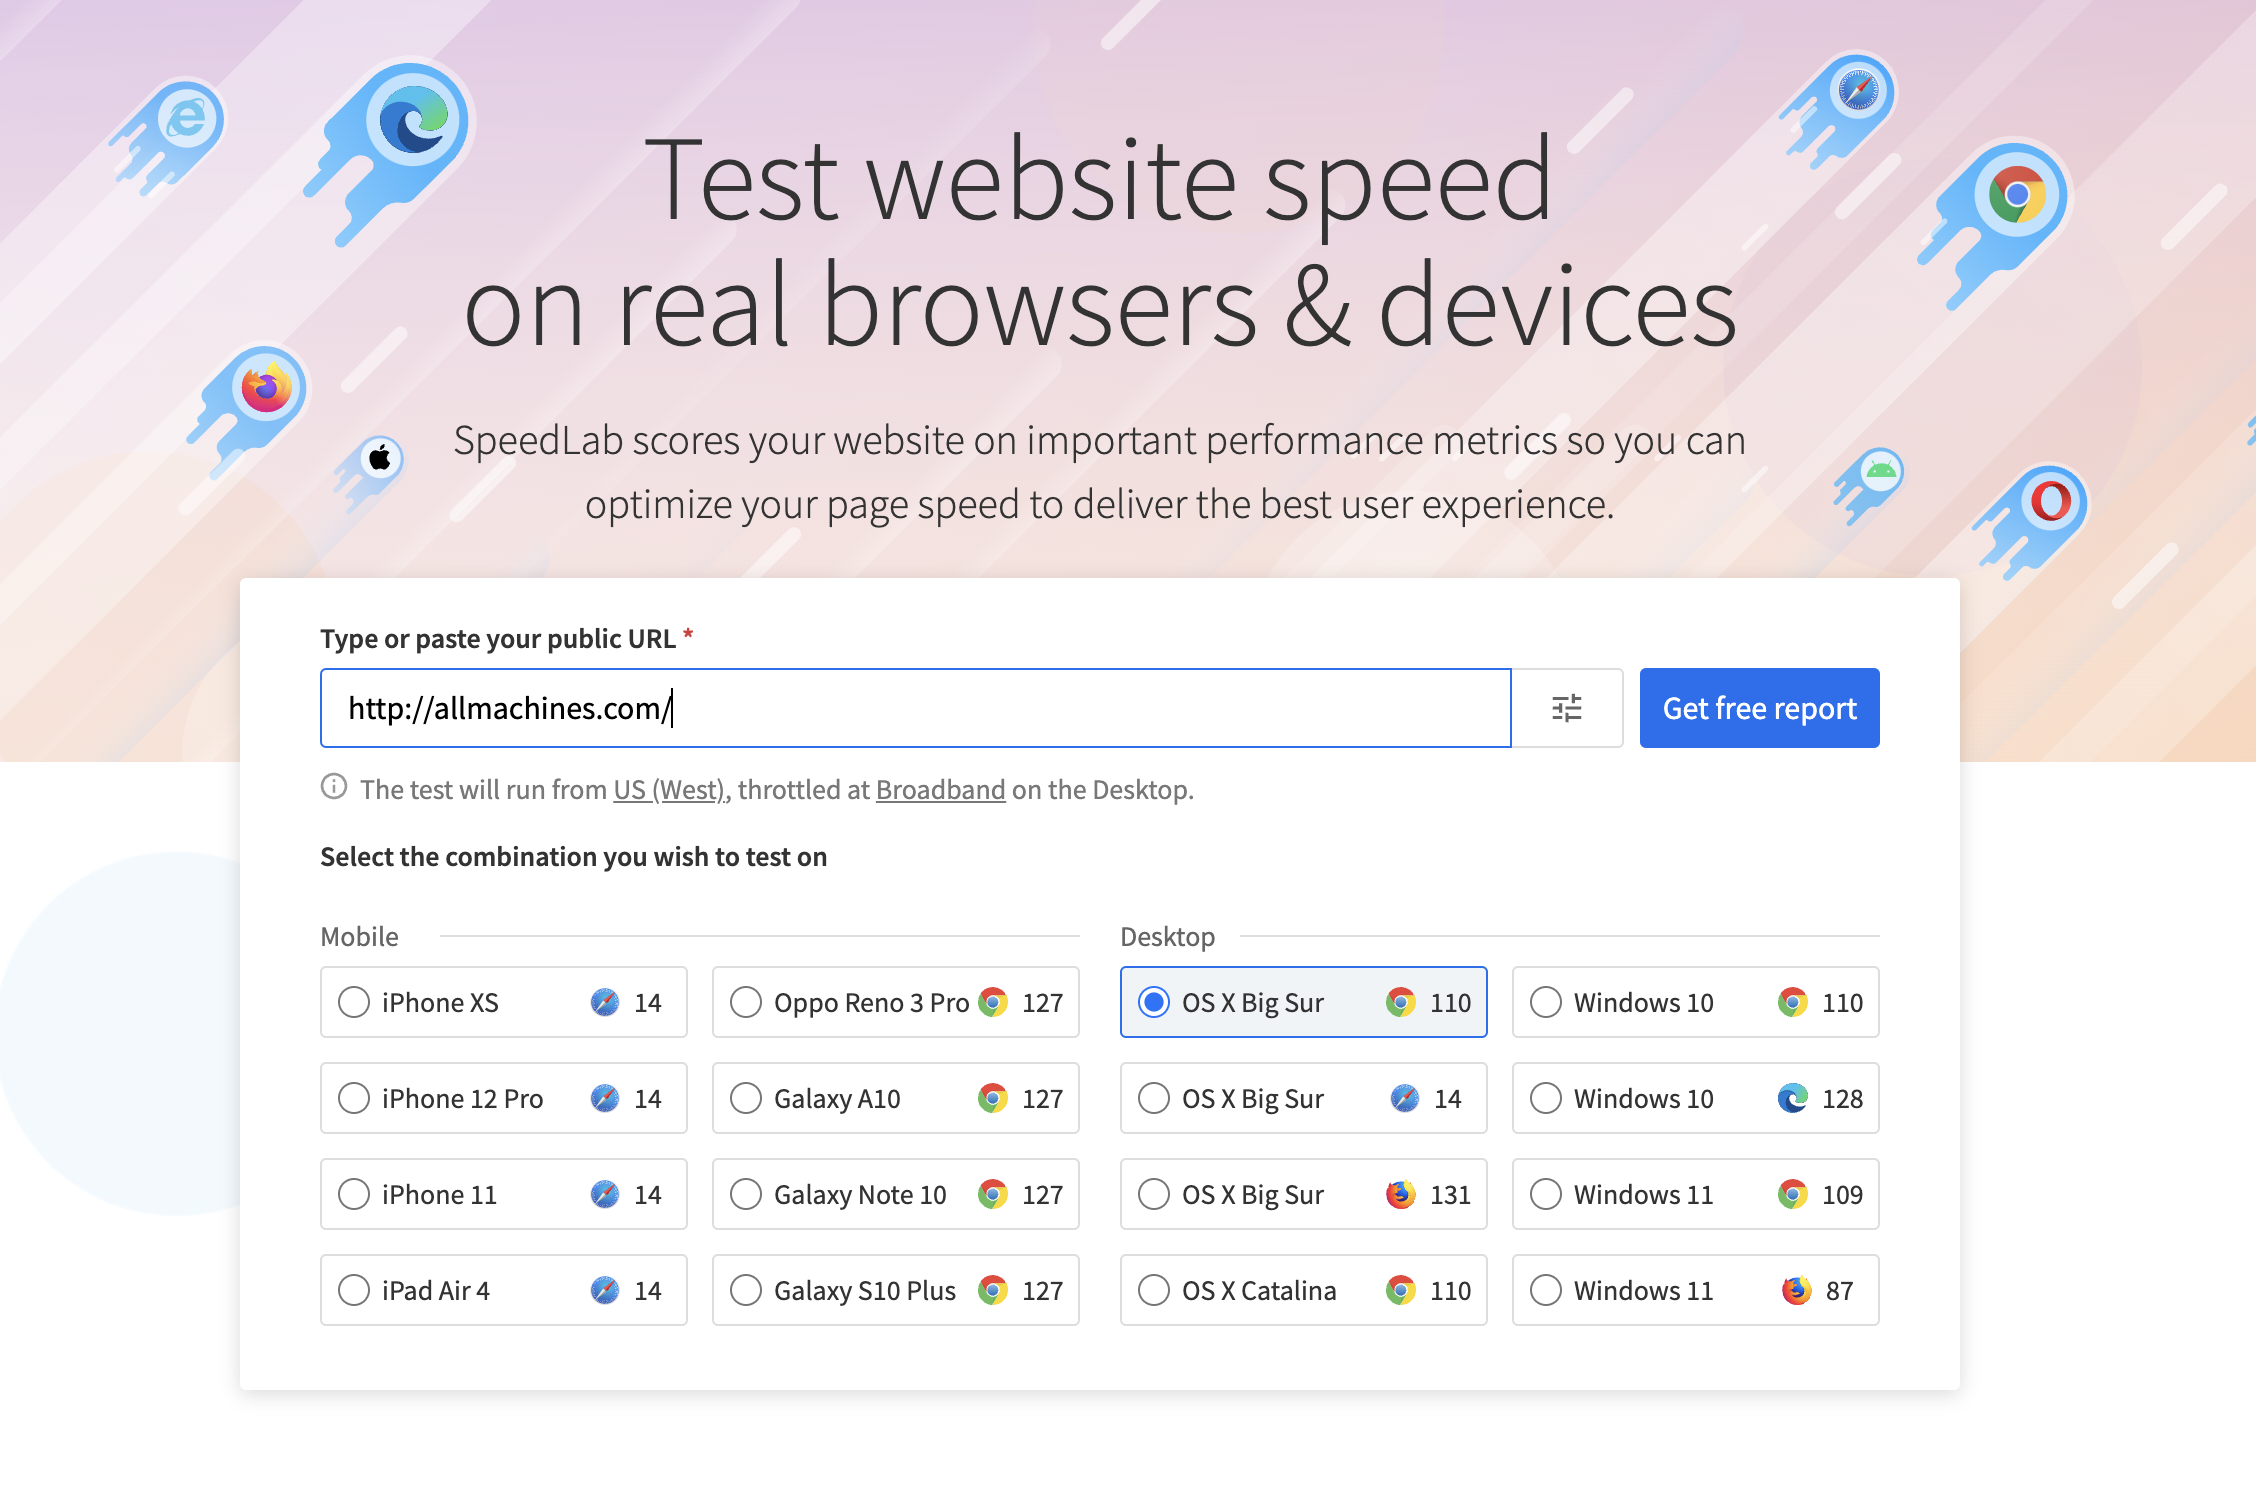
Here’s a simple 3-step process to test your website loading speed using SpeedLab for Free. Testing AllMachines website in the below example:
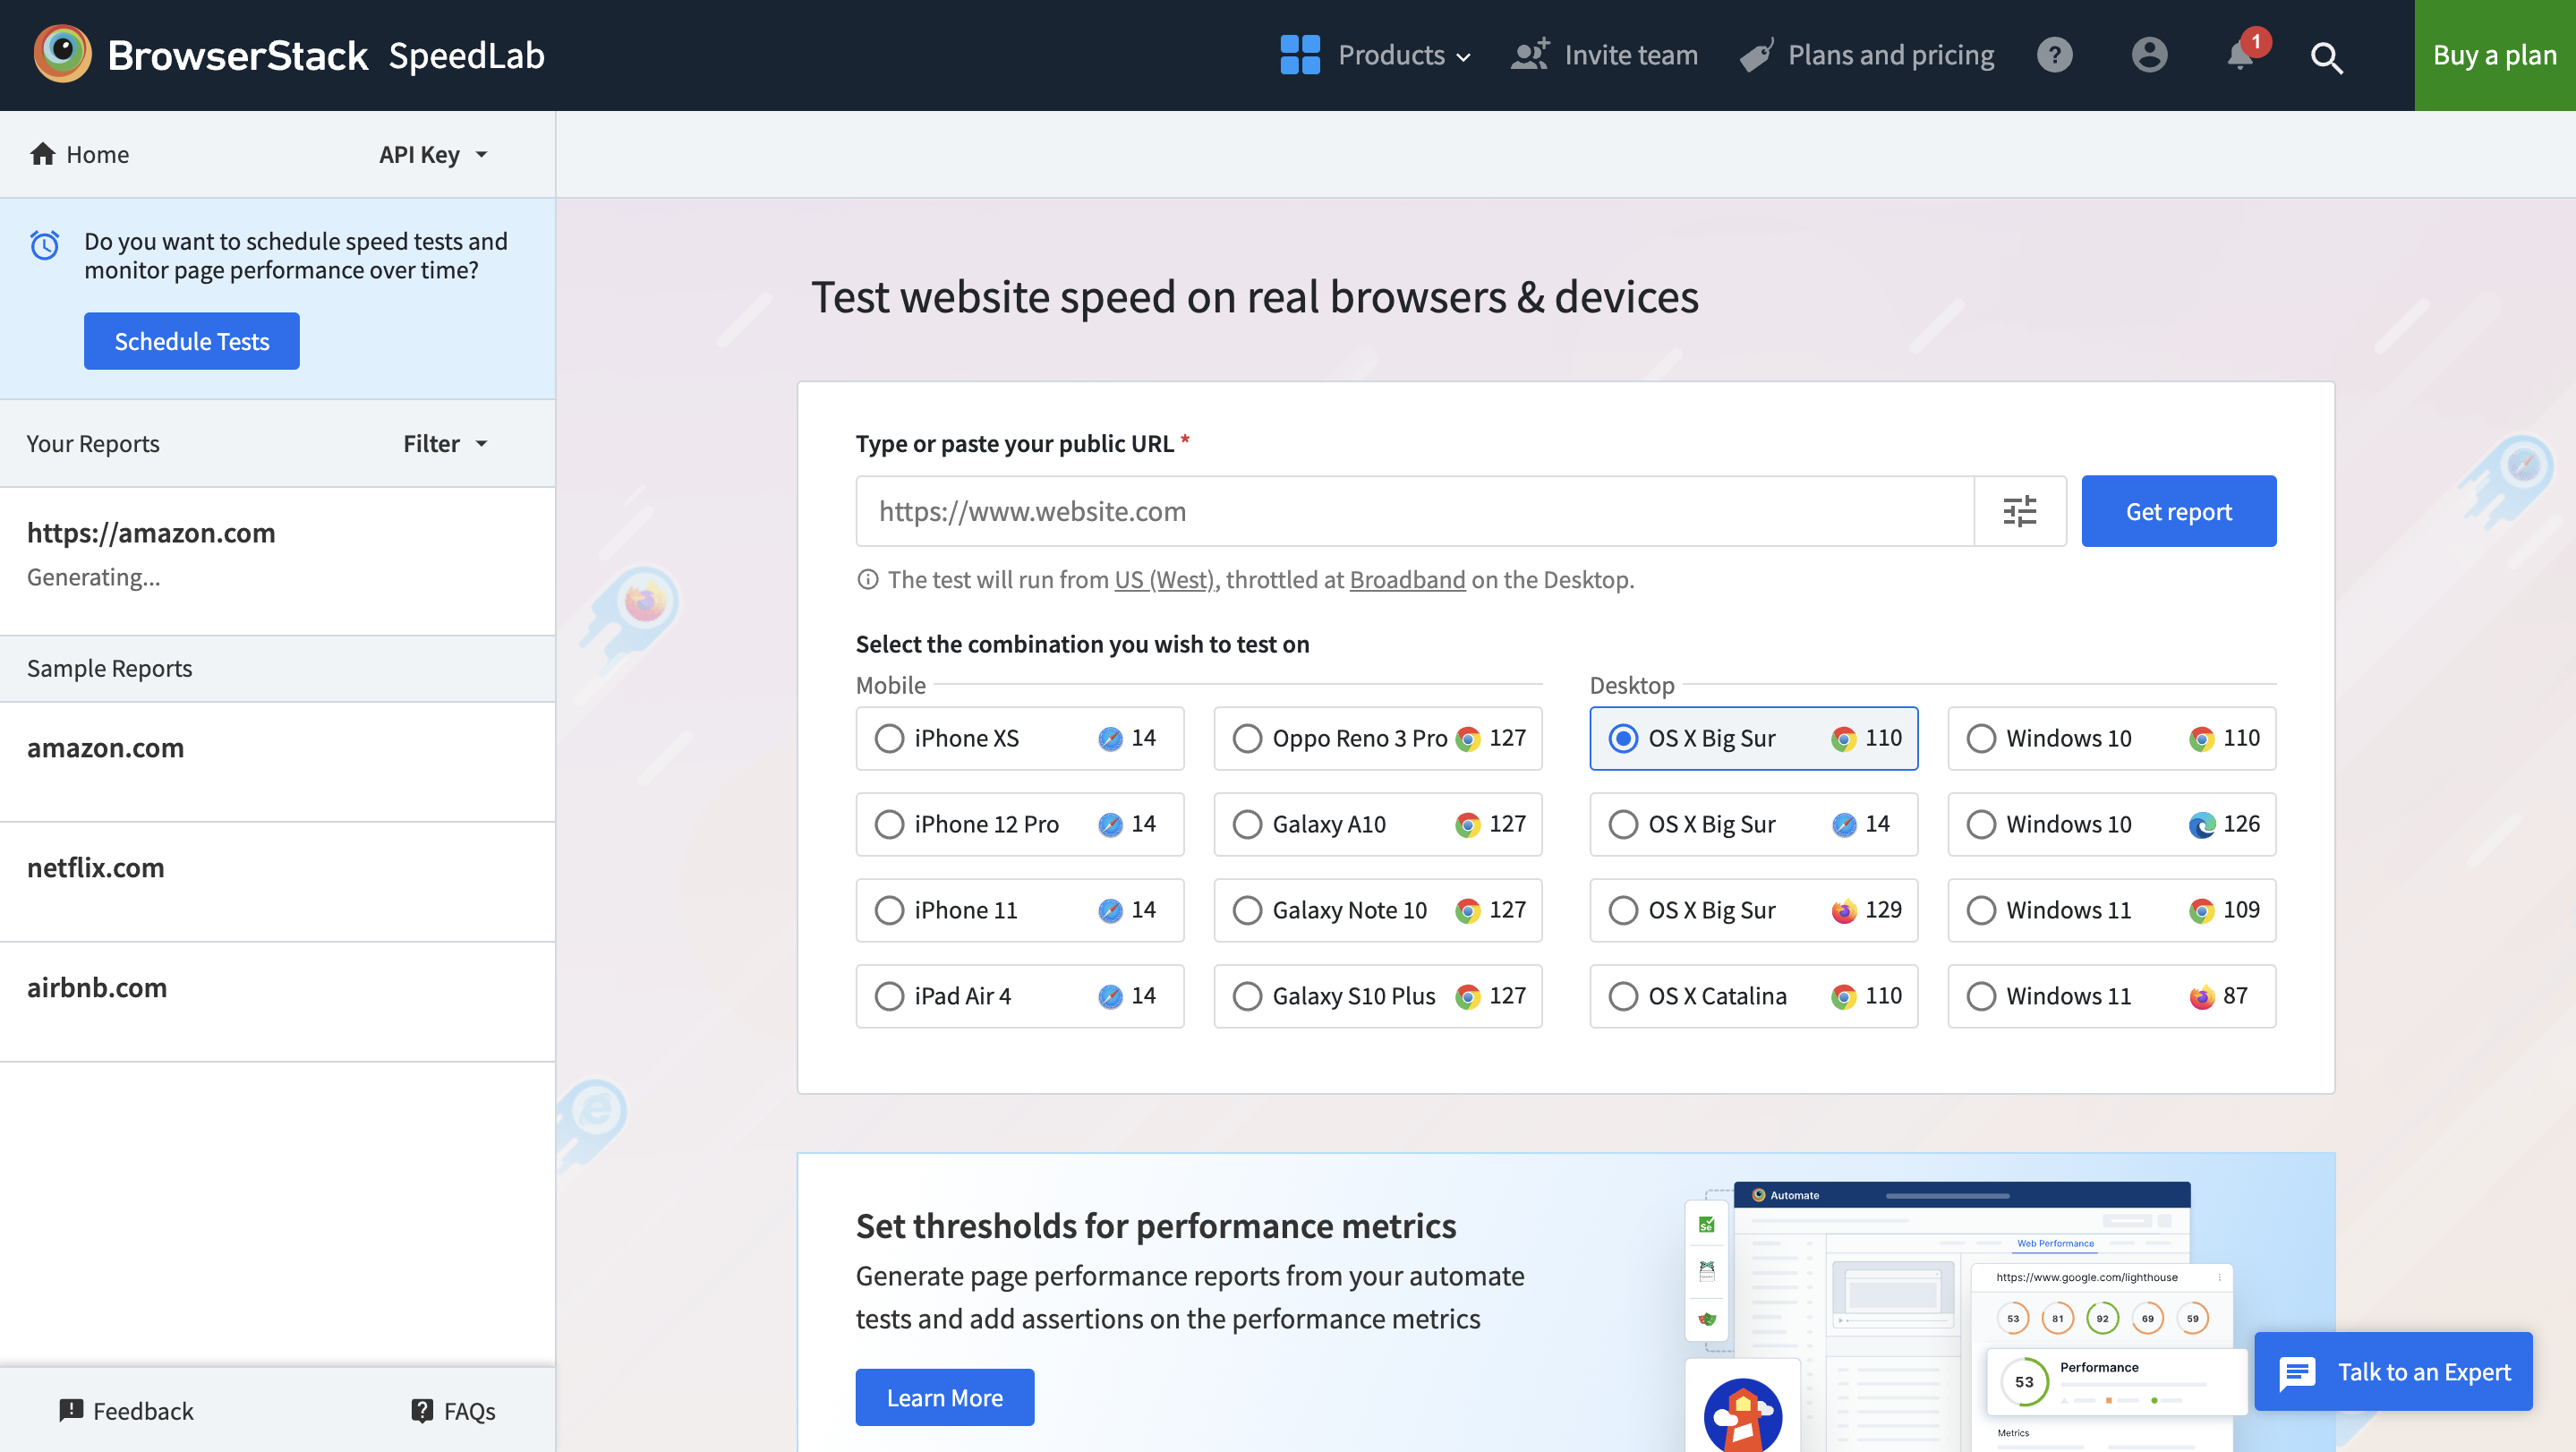
Step 1. Choose your preferred device for testing on SpeedLab
Step 2. Insert your website URL and select a browser for testing
Step 3. Click on “Get Free Report”
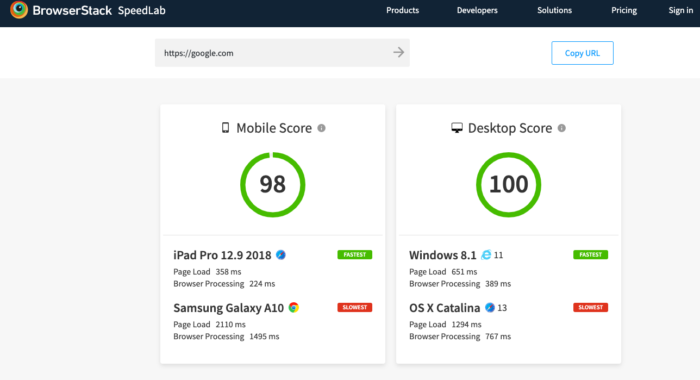
Once you’ve completed the testing process with the selected Browser, a detailed report will be generated that shows complete insights on key metrics such as mobile and desktop speed score, cross-browser compatibility, page load time, and many other factors.
The report covers key metrics for each platform and load time is represented in milliseconds (Refer to the image above). With such extensive detail at hand, teams can instantly analyze performance bottlenecks for specific device-browser combinations.
Users do not need to worry about evaluating separate reports for unique device-browser combinations. This is because SpeedLab collates results for all combinations and presents them in a single report, designed for easy visibility and analysis.
How to improve Site Speed?
Here are some tips to improve site speed:
- Optimize images by compressing and using modern formats like WebP.
- Enable browser caching to store static resources locally.
- Minify CSS, JavaScript, and HTML to reduce file sizes.
- Leverage a Content Delivery Network (CDN) to speed up content delivery.
- Reduce HTTP requests by combining CSS/JS files and using image sprites.
- Use lazy loading for images and videos to load them only when needed.
- Enable Gzip or Brotli compression to compress text-based files.
- Eliminate render-blocking resources by deferring non-essential JavaScript.
- Upgrade to a faster hosting provider with better server performance.
- Prioritize above-the-fold content to improve perceived load time.
- Remove unused JavaScript and CSS to reduce load time.
- Optimize web fonts by limiting the number and weight of font styles.
- Use asynchronous loading for JavaScript to prevent blocking the page load.
- Implement HTTP/2 to allow parallel loading of resources.
- Monitor site performance regularly to identify and address bottlenecks.
Conclusion
Teams or individuals should regularly test website speed to assess performance across different devices and browsers. This ongoing evaluation ensures the site remains accessible, inclusive, and engaging for users on various platforms. Additionally, it helps maintain SEO optimization and keeps the website competitive in an ever-changing digital environment.

