Debugging is crucial to building reliable browser automation. Puppeteer, a Node.js library developed by Google, automates browsers like Chrome, Chromium, and Firefox (Nightly). To effectively troubleshoot and refine your test scripts, Puppeteer offers several built-in tools, such as headless toggling, slowMo, DevTools integration, and the debugger keyword.
These features make it easier to identify issues, inspect browser behavior, and improve the stability of your automation tests.
Overview
How to Debug Tests using Puppeteer?
- Disable Headless Mode: Run Puppeteer in non-headless mode to visually see what’s happening in the browser.
- Slow Down Execution Speed: Use the slowMo option to delay each Puppeteer action for easier debugging.
- Use console.log() Statements: Log values and steps in your script to trace execution flow.
- Set DevTools Flag: Launch the browser with { devtools: true } to open Chrome DevTools automatically.
- Set Default Timeout in Jest-Puppeteer: Increase Jest’s timeout to allow more time for debugging long-running tests.
- Enable Verbose Logging: Use environment variables like DEBUG=puppeteer:* to get detailed logs.
- Add debugger Keyword in Your Code: Pauses execution when DevTools is open, allowing you to inspect the current state.
- Use Node.js Debugger with Visual Studio Code: Attach the VS Code debugger to your Puppeteer script for step-by-step debugging.
- Debug Puppeteer Tests with ndb: Use Google’s ndb for an enhanced debugging experience with breakpoints and inspection tools.
This article discusses how to use Puppeteer to Debug your web applications using different methods, examples, and code.
How to debug tests using Puppeteer?
Puppeteer provides multiple ways to debug, as mentioned below. Before proceeding, take a look at the prerequisites:
Pre-requisites
- Install NodeJS
- Install Visual Studio Code (Recommended)
- Puppeteer Framework Set up
1. Disable Headless Mode to Debug Puppeteer Tests
Puppeteer provides an option to disable headless mode, where we can see what is happening in the browser visually. When you are launching the browser inside your puppeteer code you can set the headless option to false.
const browser = await puppeteer.launch({ headless: false });
If you are using Jest Puppeteer you can set the headless args to false as seen below in jest-puppeteer.config.js file.
// jest-puppeteer.config.js

module.exports = {

  launch: {

    headless: false,

    product: 'chrome',

    args: ['--start-maximized'],

    defaultViewport :{width: 1700, height: 800},

 },

  browserContext: 'default',}
2. Slowdown Execution Speed to Debug Puppeteer Tests
The puppeteer is known for faster execution you can slow down the execution speed in Puppeteer using the slowMo option in Puppeteer. The slowMo takes values in milliseconds. The slowMo values can be provided at the time of launching the browser
Example:
const browser = await puppeteer.launch({

  headless: false,

  slowMo: 250, // slow down by 250ms

});
If you are using Jest Puppeteer you can specify values in jest-puppeteer.config.js config file
// jest-puppeteer.config.js

module.exports = {

  launch: {

    headless: false,

    product: 'chrome',

    args: ['--start-maximized'],

    defaultViewport :{width: 1700, height: 800},

    slowMo:250

 },

  browserContext: 'default',

}
The above code will slow down the execution by 250 milliseconds.
Try Puppeteer Testing for Free
3. Puppeteer Debugging Using Console.log()
Puppeteer test scripts allow you to put console.log() anywhere inside the test code. By doing so you can print the desired messages or values. This helps in debugging your tests.
Example:
describe('Browserstack Demo', () => {

    it('Should Verify Forgot Password', async () => {

        await page.goto('https://browserstack.com')

        let element = await page.$('a[href="/users/sign_in"]')

        let value = await page.evaluate(el => el.textContent, element)

        await page.waitForTimeout(6000);

        console.log("CONSOLE LOG DEMO:", value)


    })

})
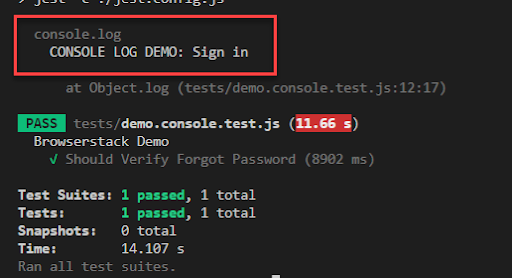
The above example, specifies console.log() at the end to print the values.
After execution, it looks like the below.
4. Set DevTools Flag to Debug Puppeteer Code
Chrome DevTools helps with advanced debugging, such as network requests, browser console logs, etc. We can launch the chrome browser by enabling the dev tools flag.
const browser = await puppeteer.launch({ devtools: true });
If you are using puppeteer-jest, you can specify the dev tools flag in the configuration file like below.
// jest-puppeteer.config.js

module.exports = {

  launch: {

    headless: false,

    product: 'chrome',

    args: ['--start-maximized'],

    defaultViewport :{width: 1700, height: 800},

    devtools:true

 },

  browserContext: 'default',

}
The above configuration launches the Chrome browser with the dev tools tab open, which helps in advanced debugging.
5. Jest Puppeteer Debugging by Setting Default Timeout
Puppeteer allows you to modify the default timeout option. If you are using Jest the default timeout is 5 secs, we can modify this behavior with jest.setTimeout() function.
Example:
describe('Browserstack Demo', () => {

    jest.setTimeout(50000);

    it('Should Verify Something', async () => {

//your code here

    })

})
Note:
- A similar option is available in Mocha and Jasmine Framework as well.
- Mocha set timeout this.timeout(100000);
- Jasmine Set timeout jasmine.DEFAULT_TIMEOUT_INTERVAL = 100000;
6. Enable Verbose Logging for Debugging
The verbose logging can be enabled in puppeteer tests, when you enable this verbose logging, it will log additional information in the console. In Powershell or Visual Studio Code you can execute the below command to enable verbose logging.
$env:DEBUG="puppeteer:*"

npm run test
7. Add debugger keyword in your Puppeteer code
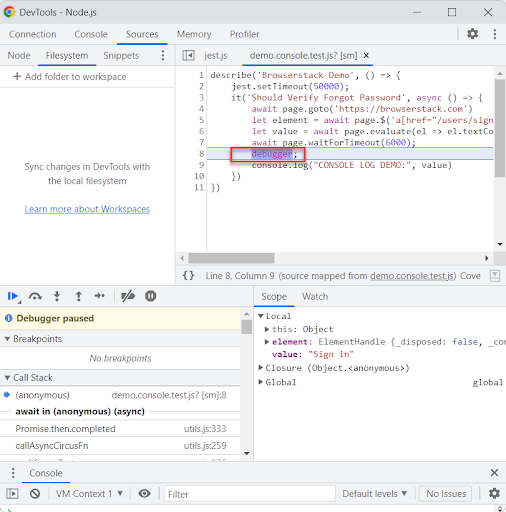
The debugger; keyword pauses the execution so that you can do additional analysis or debugging using the debugger keyword in the Puppeteer code. You can put the debugger; keyword inside your test script and execute the tests.
Step 1: Modify your code with the debugger option
describe('Browserstack Demo', () => {

    jest.setTimeout(50000);

    it('Should Verify Forgot Password', async () => {

        await page.goto('https://browserstack.com')

        let element = await page.$('a[href="/users/sign_in"]')

        let value = await page.evaluate(el => el.textContent, element)

        await page.waitForTimeout(6000);

        debugger;

        console.log("CONSOLE LOG DEMO:", value)

    })

})
Step 2: Execute your tests with the below command
node --inspect-brk ./node_modules/jest/bin/jest.js --runInBand ./tests/demo.console.test.js
Note: ./test/demo.test.js is your puppeteer test file name.
Step 3: Once you Enter the above command navigate to chrome://inspect in your chrome browser.
Step 4: Click on Open dedicated DevTools for Node
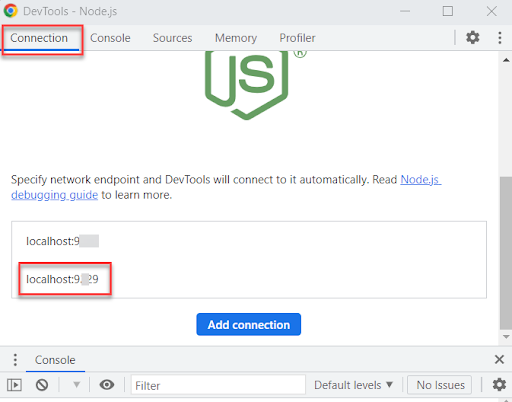
Step 5: Choose the localhost with port from the new NodeJS DevTools window
The localhost is usually something like localhost:9229.
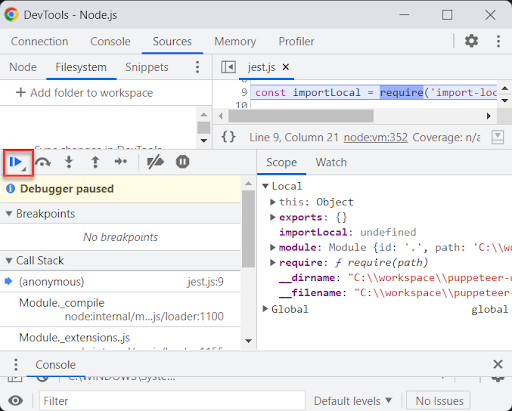
Step 6: Once you select the localhost, the new tab pops up in the paused state, click the play button to continue.
Step 7: Debug the test once it pauses. Once you click on the play button the tests start executing and it will pause when the debugger; keyword encounters. You can start debugging from there.
Step 8: Resume the script execution with F8 or the same play button.
8. Integrate Node debugger with Visual Studio Code for Puppeteer Debugging
Puppeteer tests can be integrated with Visual Studio Code for debugging easily.
How to Integrate Visual Studio Code (VSCode) for Puppeteer Test
Step 1: In Visual Studio Code Run Menu, Navigate to Add Configuration and Choose NodeJS
Step 2: The default launch.json file creates inside the .vscode directory.
Step 3: Edit the launch.json file with the below code.
{

    "version": "0.2.0",

    "configurations": [

        {

            "type": "node",

            "request": "launch",

            "name": "Jest",

            "program": "${workspaceFolder}/node_modules/jest/bin/jest",

            "args": [

                "--config=${workspaceFolder}/jest.config.js",

                "--detectOpenHandles",

                "--colors"

            ],

            "internalConsoleOptions": "openOnSessionStart",

            "skipFiles": [

                "<node_internals>/**"

            ]

        }

    ]

}
Note: The above configuration works for the Puppeteer and Jest framework.
Step 4: Put the breakpoint in Visual Studio Code and Execute. Put the breakpoint inside the VS Code for your desired test and desired code or line, and start the execution with F5 or Run > Start debugging option
Step 5: The above command launches the test and pauses when the breakpoint is encountered. Use the step into/step over and resume option for your debugging.
9. Debug Puppeteer Tests with ndb
Before understanding how to debug Puppeteer tests with nbd, its important to know what a nbd tool is:
What is ndb tool?
The ndb is enabled by Chrome DevTools, it provides an improved debugging experience for the NodeJS-based framework. Since puppeteer is a NodeJS-based framework we can make utilize ndb.
To use ndb for Puppeteer Jest Test for
Step 1: Install ndb to your framework locally using the below command.
npm install --save-dev ndb
Or
Install ndb globally using the below command
npm install -g ndb
Step 2: Execute your tests with ndb command. If you installed ndb locally execute using below command
npx ndb npm run testIf you installed ndb globally execute using the below command
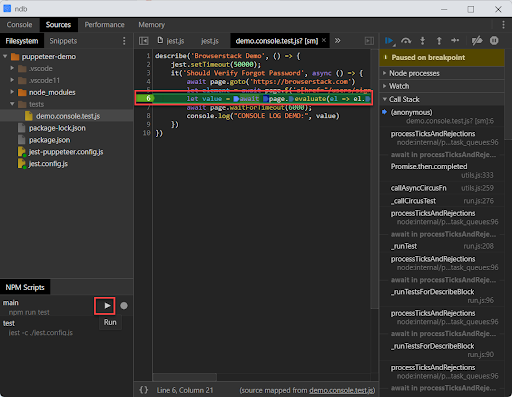
ndb npm run testOnce you execute above command the ndb window opens that shows all of your test scripts. Set a breakpoint for your tests inside your ndb window. Click on the play button. The execution starts and pauses at the breakpoint as seen below
Conclusion
When it comes to automation testing, it is important to test the application on the different operating systems and browser combinations. The application might through errors specifically for some browsers or operating systems. It is very difficult to reproduce the errors locally since we might not have infrastructures and setting up such a dynamic infrastructure takes time and effort.
Browserstack real device cloud allows users to test across multiple environments using various operating systems and browser combinations. Browserstack provides access to 3500+ real device browser combinations, where you can execute your tests under real user conditions.
Get started with Puppeteer tests effortlessly on BrowserStack Automate with ease and minimal configuration changes.
