When an Android app crashes, retrieving crash logs is essential for debugging and troubleshooting.
Overview
You can capture Android app crash logs using:
- ADB (Android Debug Bridge)
- Android Bug Report Feature
This guide will show you how to fetch crash logs from an Android device. It also describes how to perform interactive app debugging on a real device cloud and how to troubleshoot issues effectively.
What are App Crash Logs
App crash logs are files generated when an app unexpectedly crashes, providing detailed information about the error, including stack traces, memory usage, and system status. They help developers diagnose issues and fix bugs by pinpointing the cause of the crash.
A mobile app crash or an app crash log reports essential information about the origin of the crash with other details that streamline the debugging process for developers. Even with a minimum crash rate of less than 2%, apps can affect your churn rate.
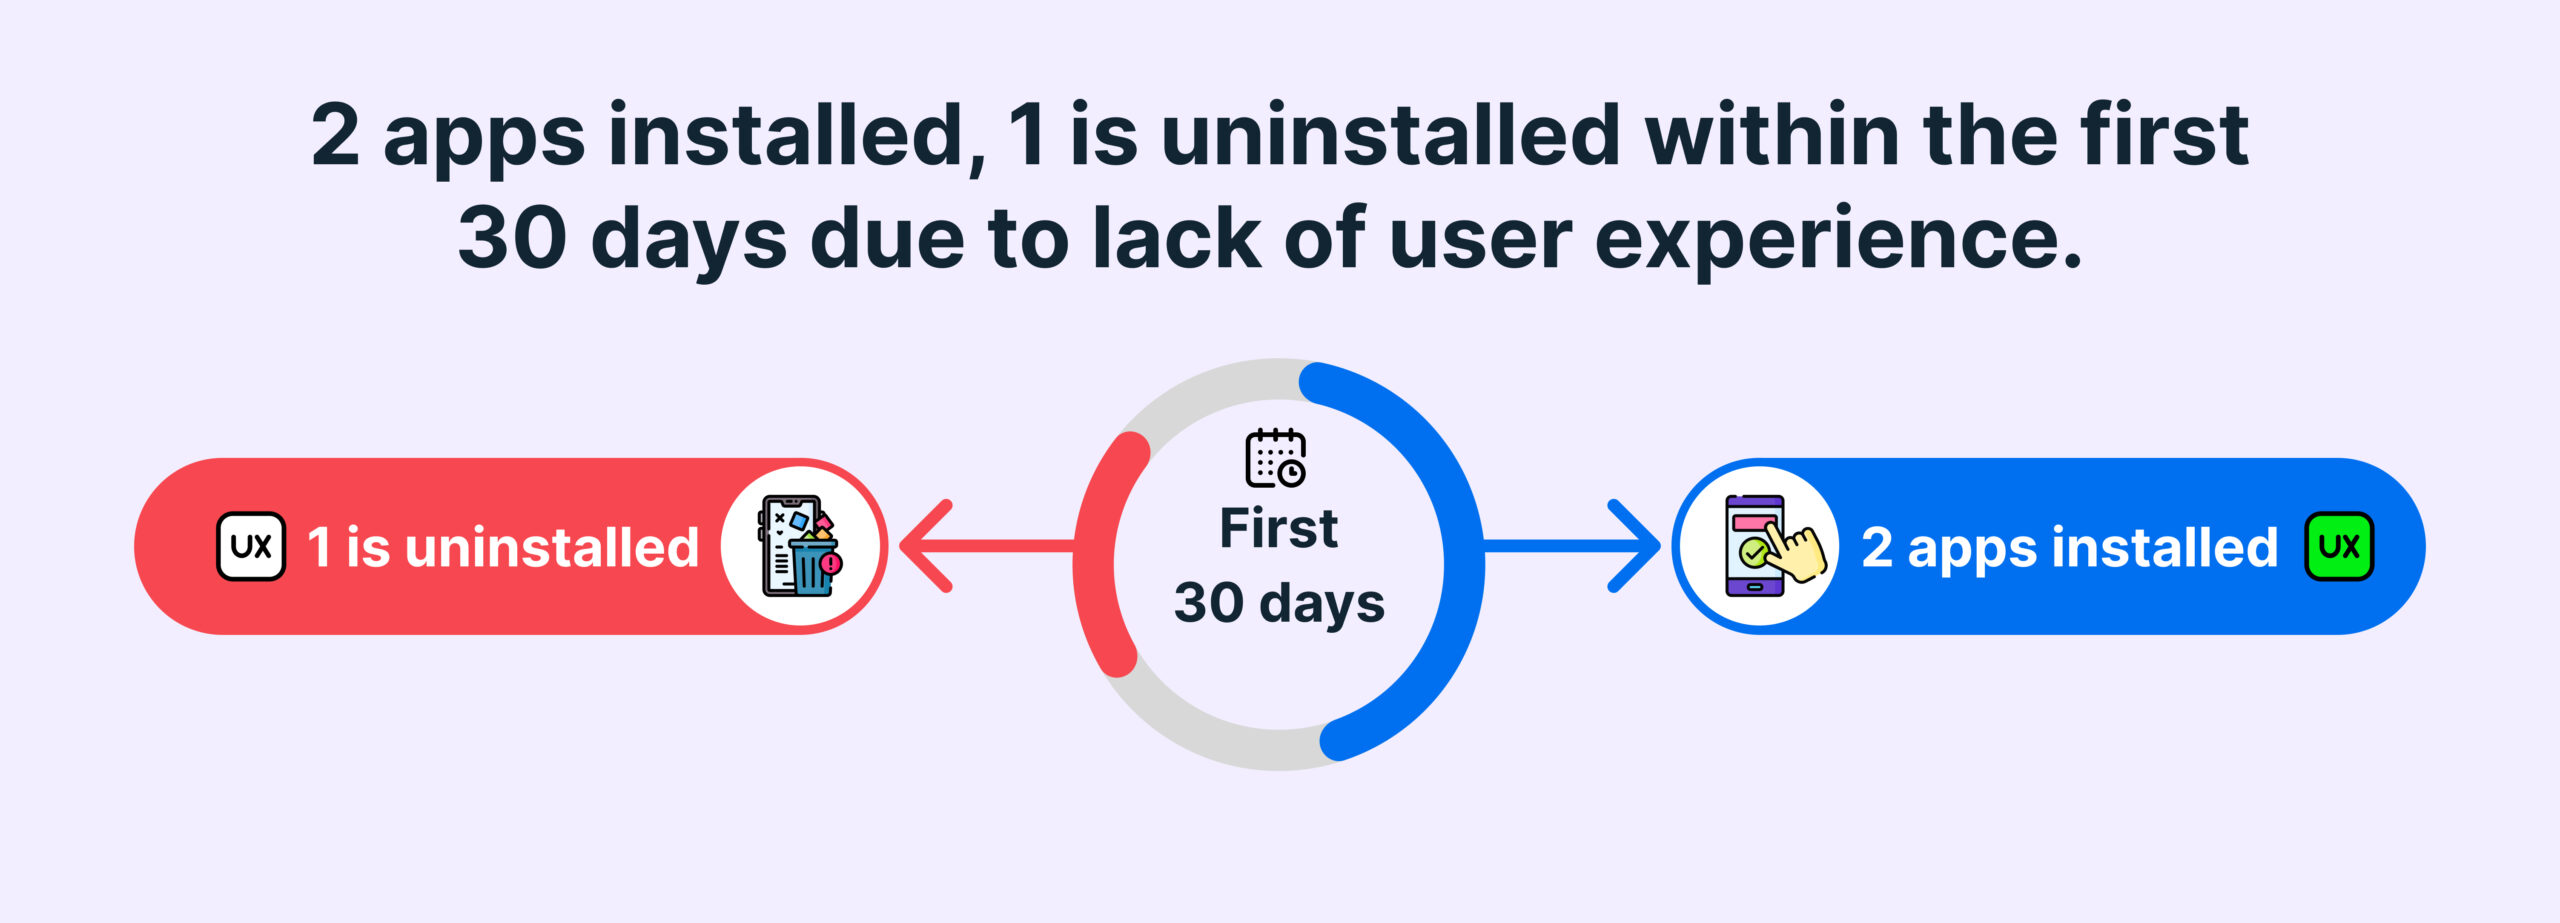
A majority of users uninstall the application if it has already crashed twice or thrice before. Hence, it is essential to assess the logs and identify the source of the problem to fix it at the earliest.
Android App Crash Data & its Components
A crash log from an Android device comes in handy when you try to reach the heart of the problem. In this section, we will walk you through some general elements of this crash report to establish its usefulness in times of need
An app crash log is a detailed report generated when a mobile or desktop application crashes unexpectedly. Crash logs are vital for developers to analyze app stability, identify bugs, and improve the app’s overall performance. They are typically accessed through developer tools, like Xcode for iOS or Android Studio for Android.
Android App Crash Log Contains:
- Timestamp: When the crash occurred.
- Stack trace: The sequence of function calls leading up to the crash, helping developers identify the specific location in the code where the issue happened.
- Error message: Descriptions of the issue, such as exceptions or memory errors.
- Device/System info: Details about the device, OS version, and hardware, helping to identify environment-specific issues.
- Memory usage: Information on how much memory the app was using at the time of the crash.
- App Version: The first step of the Android app debugging and crash log assessment is to check the app version for getting behind the root cause and commence the rectification. Applications these days are updated regularly, which is why this data can provide some helpful insights.
- OS Version: In addition to the latest version of the app before the crash, you must render the OS version of the device to comprehend the problem with the hardware. An app crash also occurs when there is no compatibility between the app and the operating systems.
- Device: Understanding the type of device will give you more details about the hardware and device support for specific applications. This observation can also provide the reason behind recurring Android app crash problems which can also be used to elevate the app’s performance.
Also Read: How to use Device Logs in Android and iOS
- App View: Knowing the app version or type of operating system in case of app crashes is helpful, but it is not always enough. App view is a lucid component as it provides an overview of what went wrong with the application. An app view can help developers locate the part of the app where the crash initially started.
- Stack Trace: Stack trace is another major element of the crash logs in Android devices as it gives an overview of the issue at the core of the application. It tracks a complete sequence of app functions and generates a stack trace. This trace is then brought into use for debugging the platform.
Common Tools to Collect Android Crash Data
Here are some of the popularly used tools to collect Android Crash Data:
Tools to get Android Crash Data
- BrowserStack App Live: Offers real-time testing and automated crash report generation across a wide range of real devices, helping identify crashes in different environments.
- Firebase Crashlytics: Provides real-time crash reporting and detailed insights into app crashes with stack traces and user actions.
- Android Vitals: Tracks app performance and stability metrics like crashes, ANRs, and battery usage, available via Google Play Console.
- Logcat: A command-line tool in Android Studio that displays logs, including crash reports, from connected devices or emulators.
How to Get App Crash Logs from Android Devices?
There are two methods to get app crash logs from android devices discussed in this article – Bug Report Feature and Android Debug Bridge.
Bug Report Feature
The Bug Report feature in Android provides a comprehensive log of system events, app crashes, and performance data, making it a valuable tool for debugging. Instead of manually extracting logs, you can generate a detailed bug report that includes stack traces, system logs, and device information.
This feature is especially useful for non-developers, as it allows users to capture and share crash details without using ADB commands.
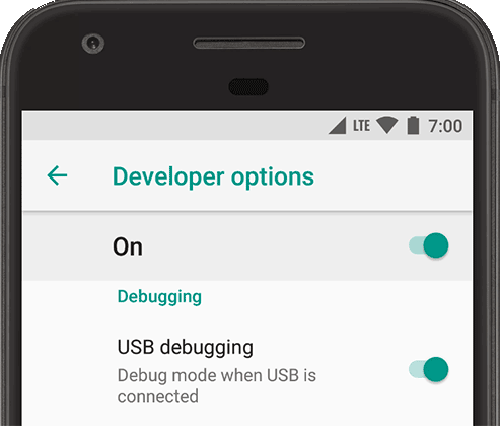
- Go to Android device Settings and enable Developer Options.
- Now go to the System option and click on About Your Phone. Tap seven times on Build Number.
- Come back to Developer Options and click on Take Bug Report.
- You can upload it on Google Drive or Dropbox to open it on other devices and adjust the list to your use.
- Open the Report Text File on the desktop and find System Log in the report.
- The error can be located with a timestamp when you know the crash time. Otherwise, you can type crash or exception to find it.
- Evaluate the report and extract the part right before and after the crash.
Android Debug Bridge (ADB)
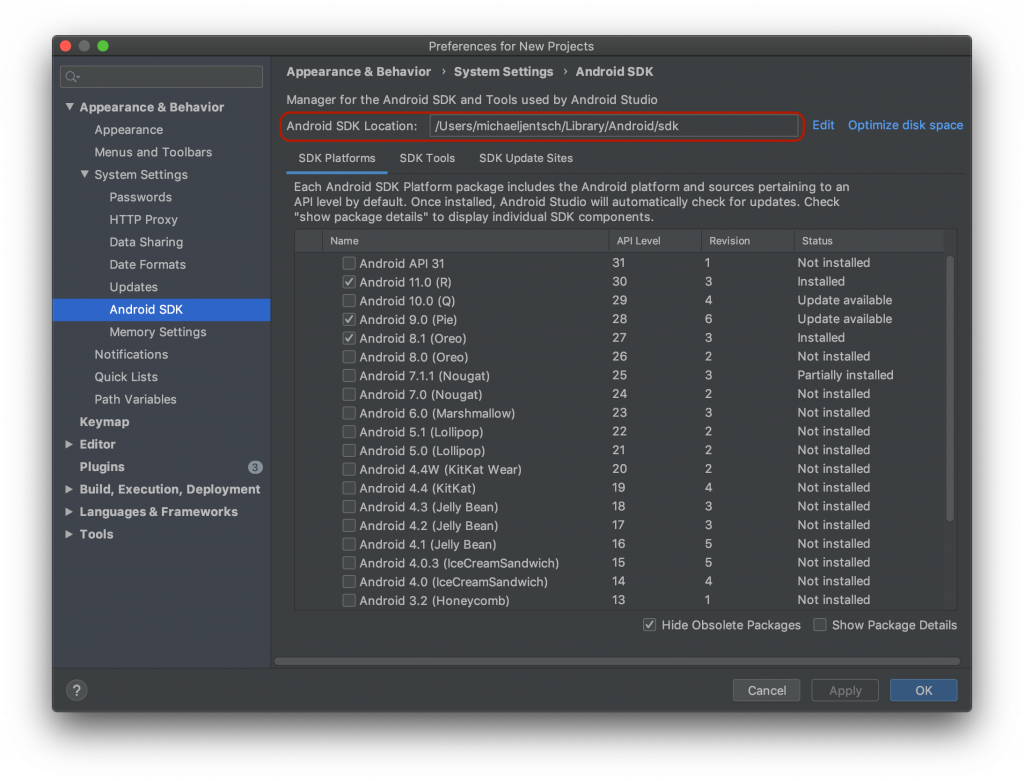
To use this method, you will need to download Fastboot, Minimal ADB, or similar software. In addition to this, you must prepare the device for USB debugging. Moreover, the Android device should be connected to the desktop with the USB debugging option enabled in Android.
Here’s how to generate logs from this technique:
- Open the software you downloaded for ADB or open the portable version folder.
- Press the SHIFT key with a right-click on a blank space in the folder. Open Command prompt here will appear on the screen. Select it.
- Make sure that your Android device is connected to the desktop. It should appear in the list of connected devices.
- If you want to clear the log history, then use the command adb logcat -c to delete arbitrary content.
- Create a new folder on the desktop. Now, hold the SHIFT key and right click on the folder. Go to the context menu and choose Copy as Path.
- Enter the command adb logcat -v time > to paste the path in the log window, and it will appear as adb logcat -v time > “D:\Logs”.
- You can add a name to this path and use the TXT file extension for the same
- Now you will need to reproduce the crash to start the logging process. If you are using a tool like Minimal ADB, it will appear in the log activity.
Even as an experienced developer, going through these methods to extract Android app crash data can be time-consuming.
What if you can use an interactive debugging platform to view crash reports easily and debug your app quickly? With BrowserStack App Live, it’s quite possible!
Interactive App Debugging on a Real Device Cloud
It might be next to impossible for companies to have all the latest/legacy devices in their testing labs. In such a case, adopting a real device cloud can help teams achieve comprehensive mobile testing on desired platforms.
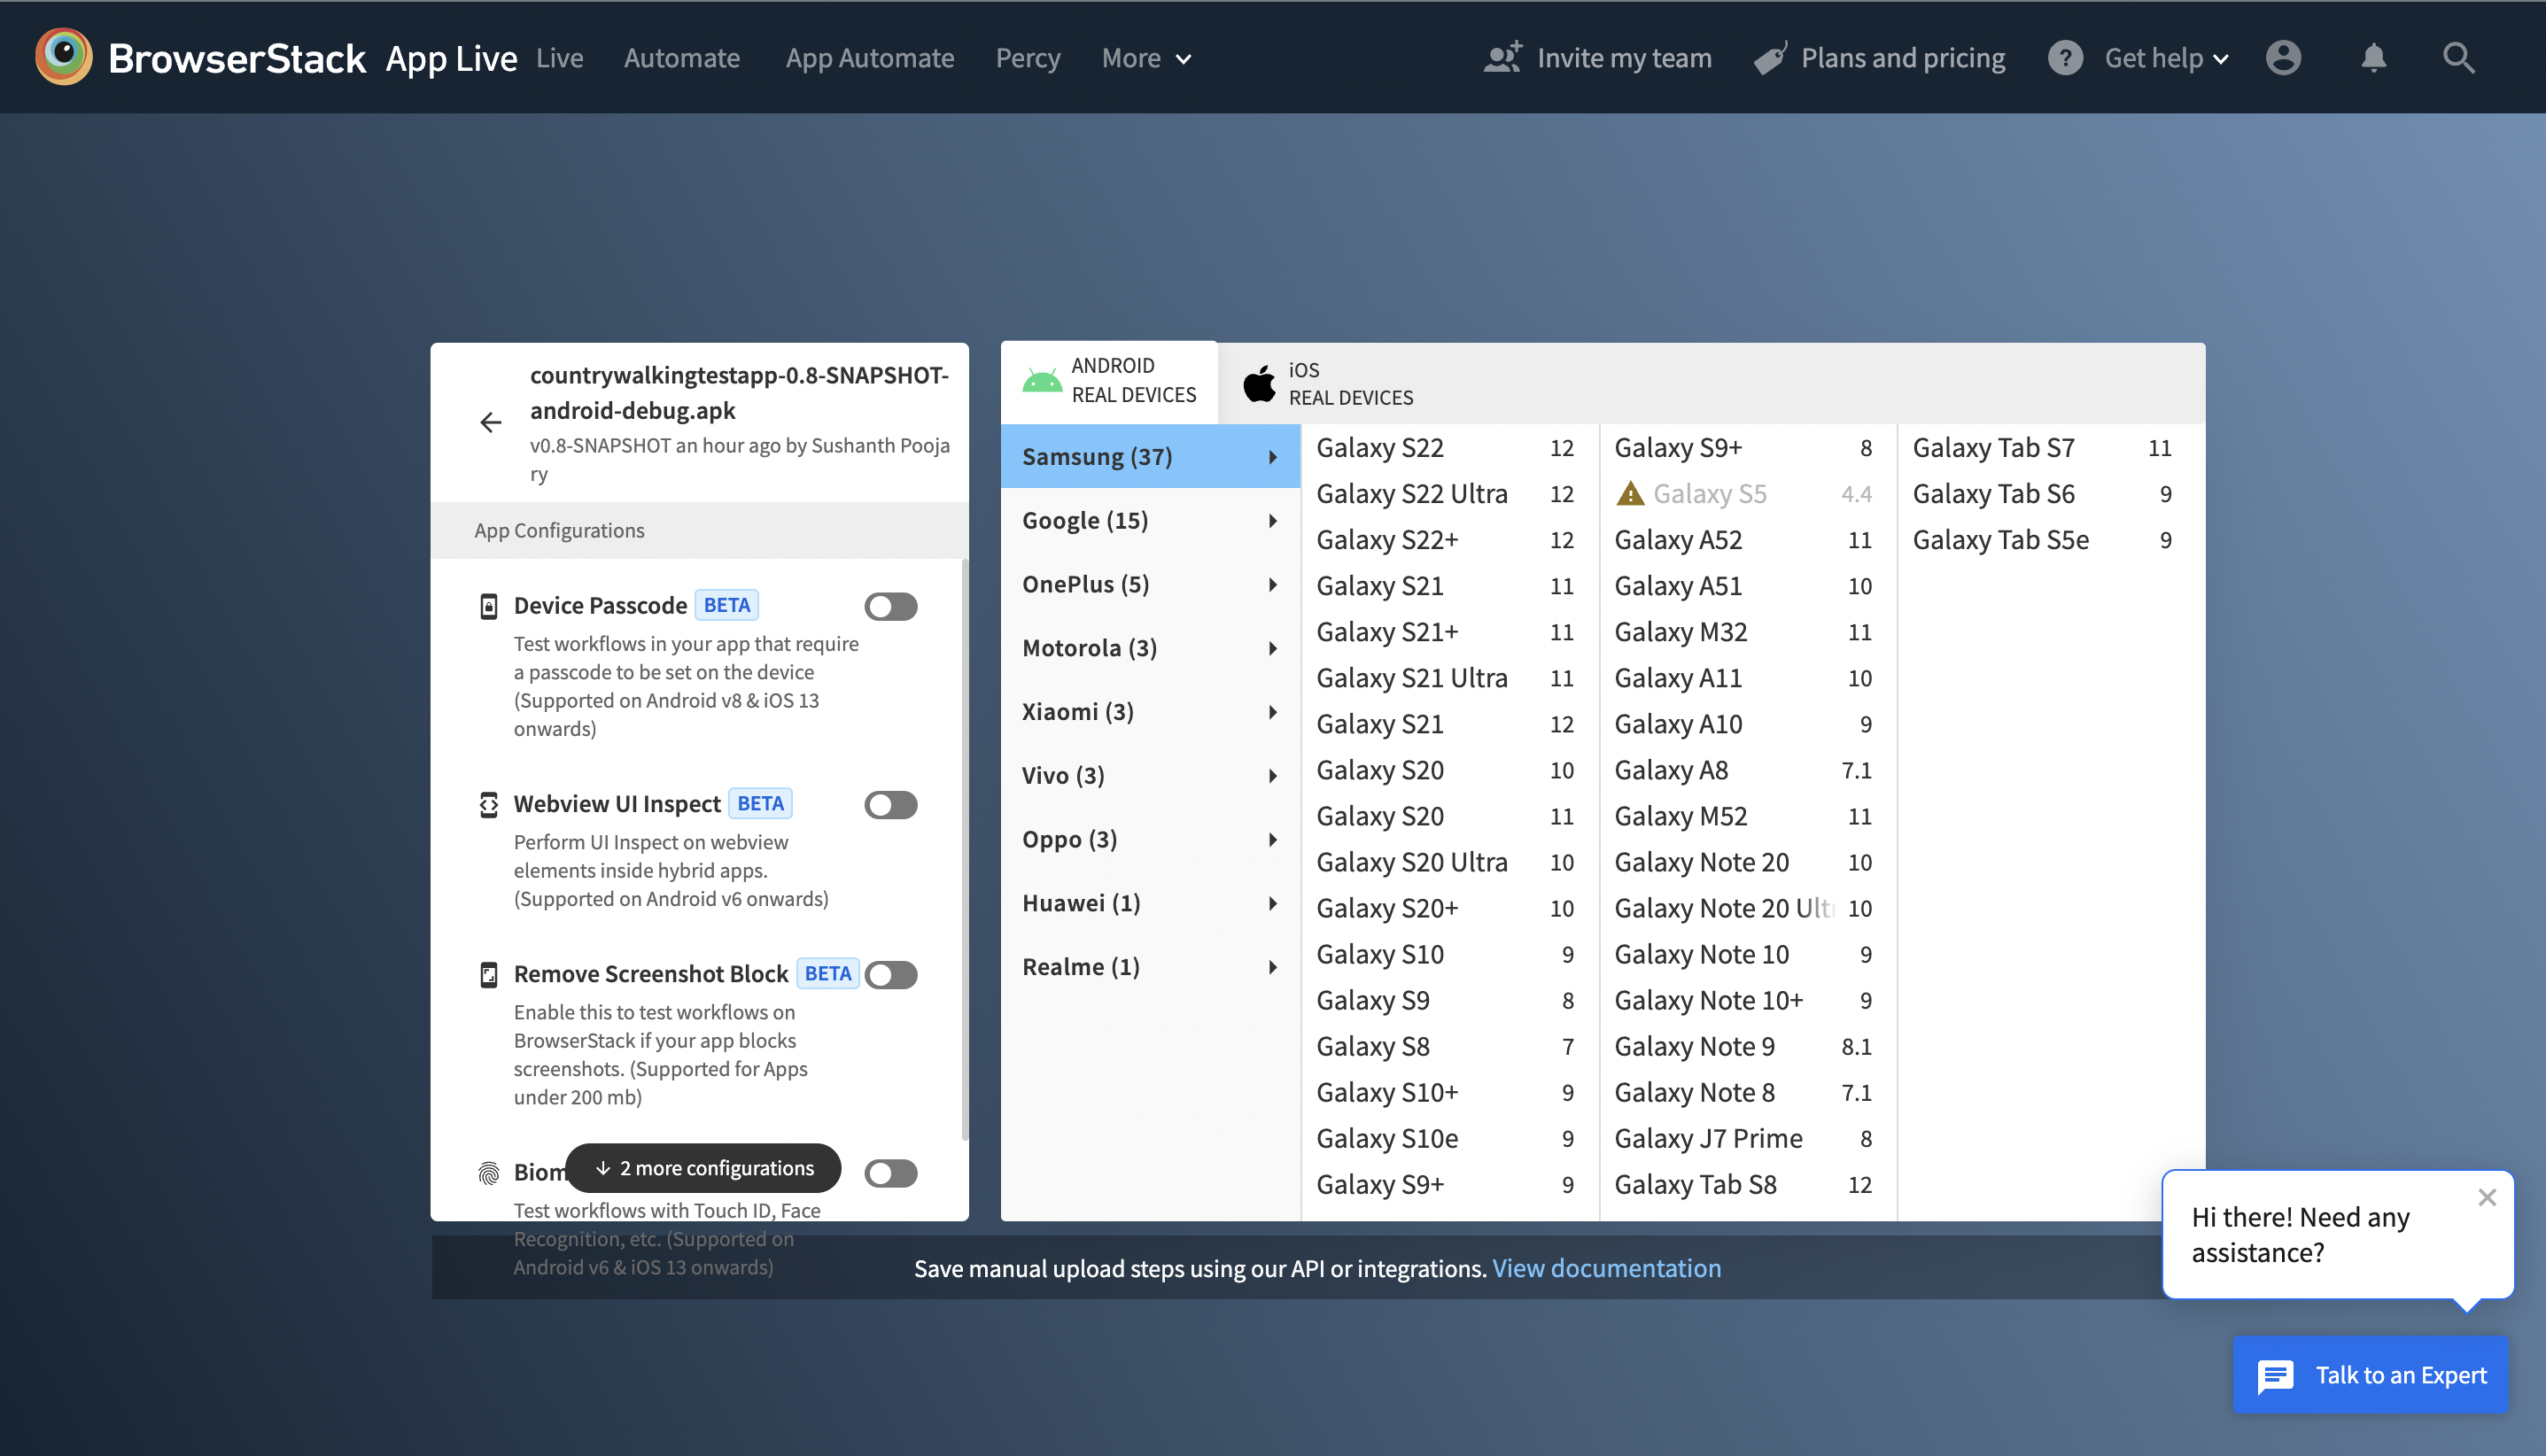
BrowserStack App Live gives access to a real device cloud including the latest versions of Android devices like Samsung Galaxy, OnePlus, Pixel, Motorola, and more. Check the full list of Android devices available.
You can even toggle between Android app configurations such as Device Passcode, Webview UI Inspect, Biometric Authentication, and more.
- App Live allows testing via different sources, including Play Store installation, build tool integration, beta distribution tool integration, and URL uploads. It makes the testing of published apps a pragmatic possibility.
- Test localization across different device types and versions and network condition simulation are some powerful features that contemplate bug-free application flow.
How to Use App Live for Android App Crash Logs
Step 1. SignUp / Login to BrowserStack App Live
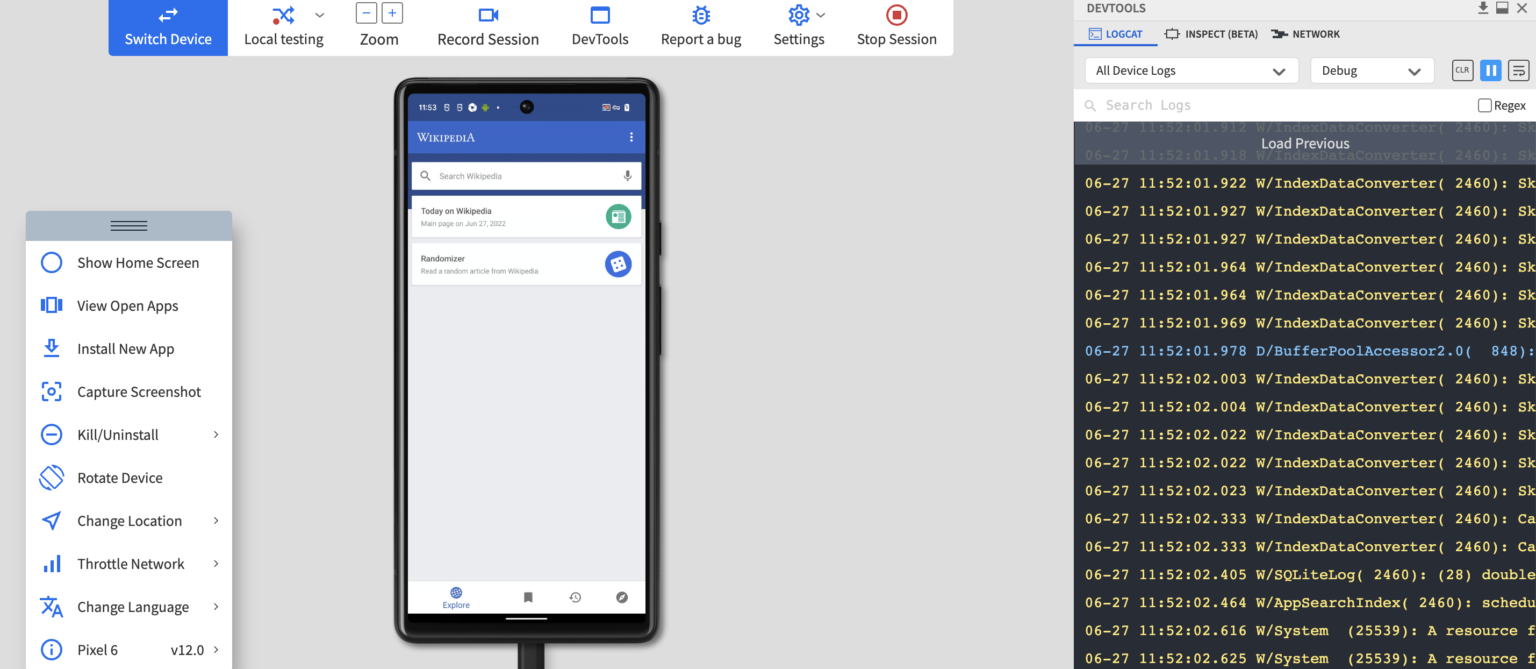
Step 2. Choose the device you are testing. On your system, you will see the developer’s screen on one side and the Android phone template on the other end.
Step 3. If you need the logs of a specific app, click on Dev Tools and then choose All Device Logs.
Capturing A Bug Report from Android Devices
- Enable Developer Options on the phone and tap Take bug report.
- Once the bug report is generated, you will get a notification. You can also share this report with external collaborators.
Bug Report Generation with Android Debug Bridge (Using Easy Commands)
- To save the bug report in the local directory in a single connected device, you can use the following command:
$ adb bugreport E:\Reports\MyBugReports
- If you have more than one connected device and you need to extract the report, you must channel the device in the command where you want to save the report.
For device 8XR7N16C31003476, the command will be:
$ adb -s 8XR7N16C31003476 bugreport
When you find a bug during the test – you can flag it by integrating with Jira, Trello, Slack, or Github for better team communication and bug tracking.
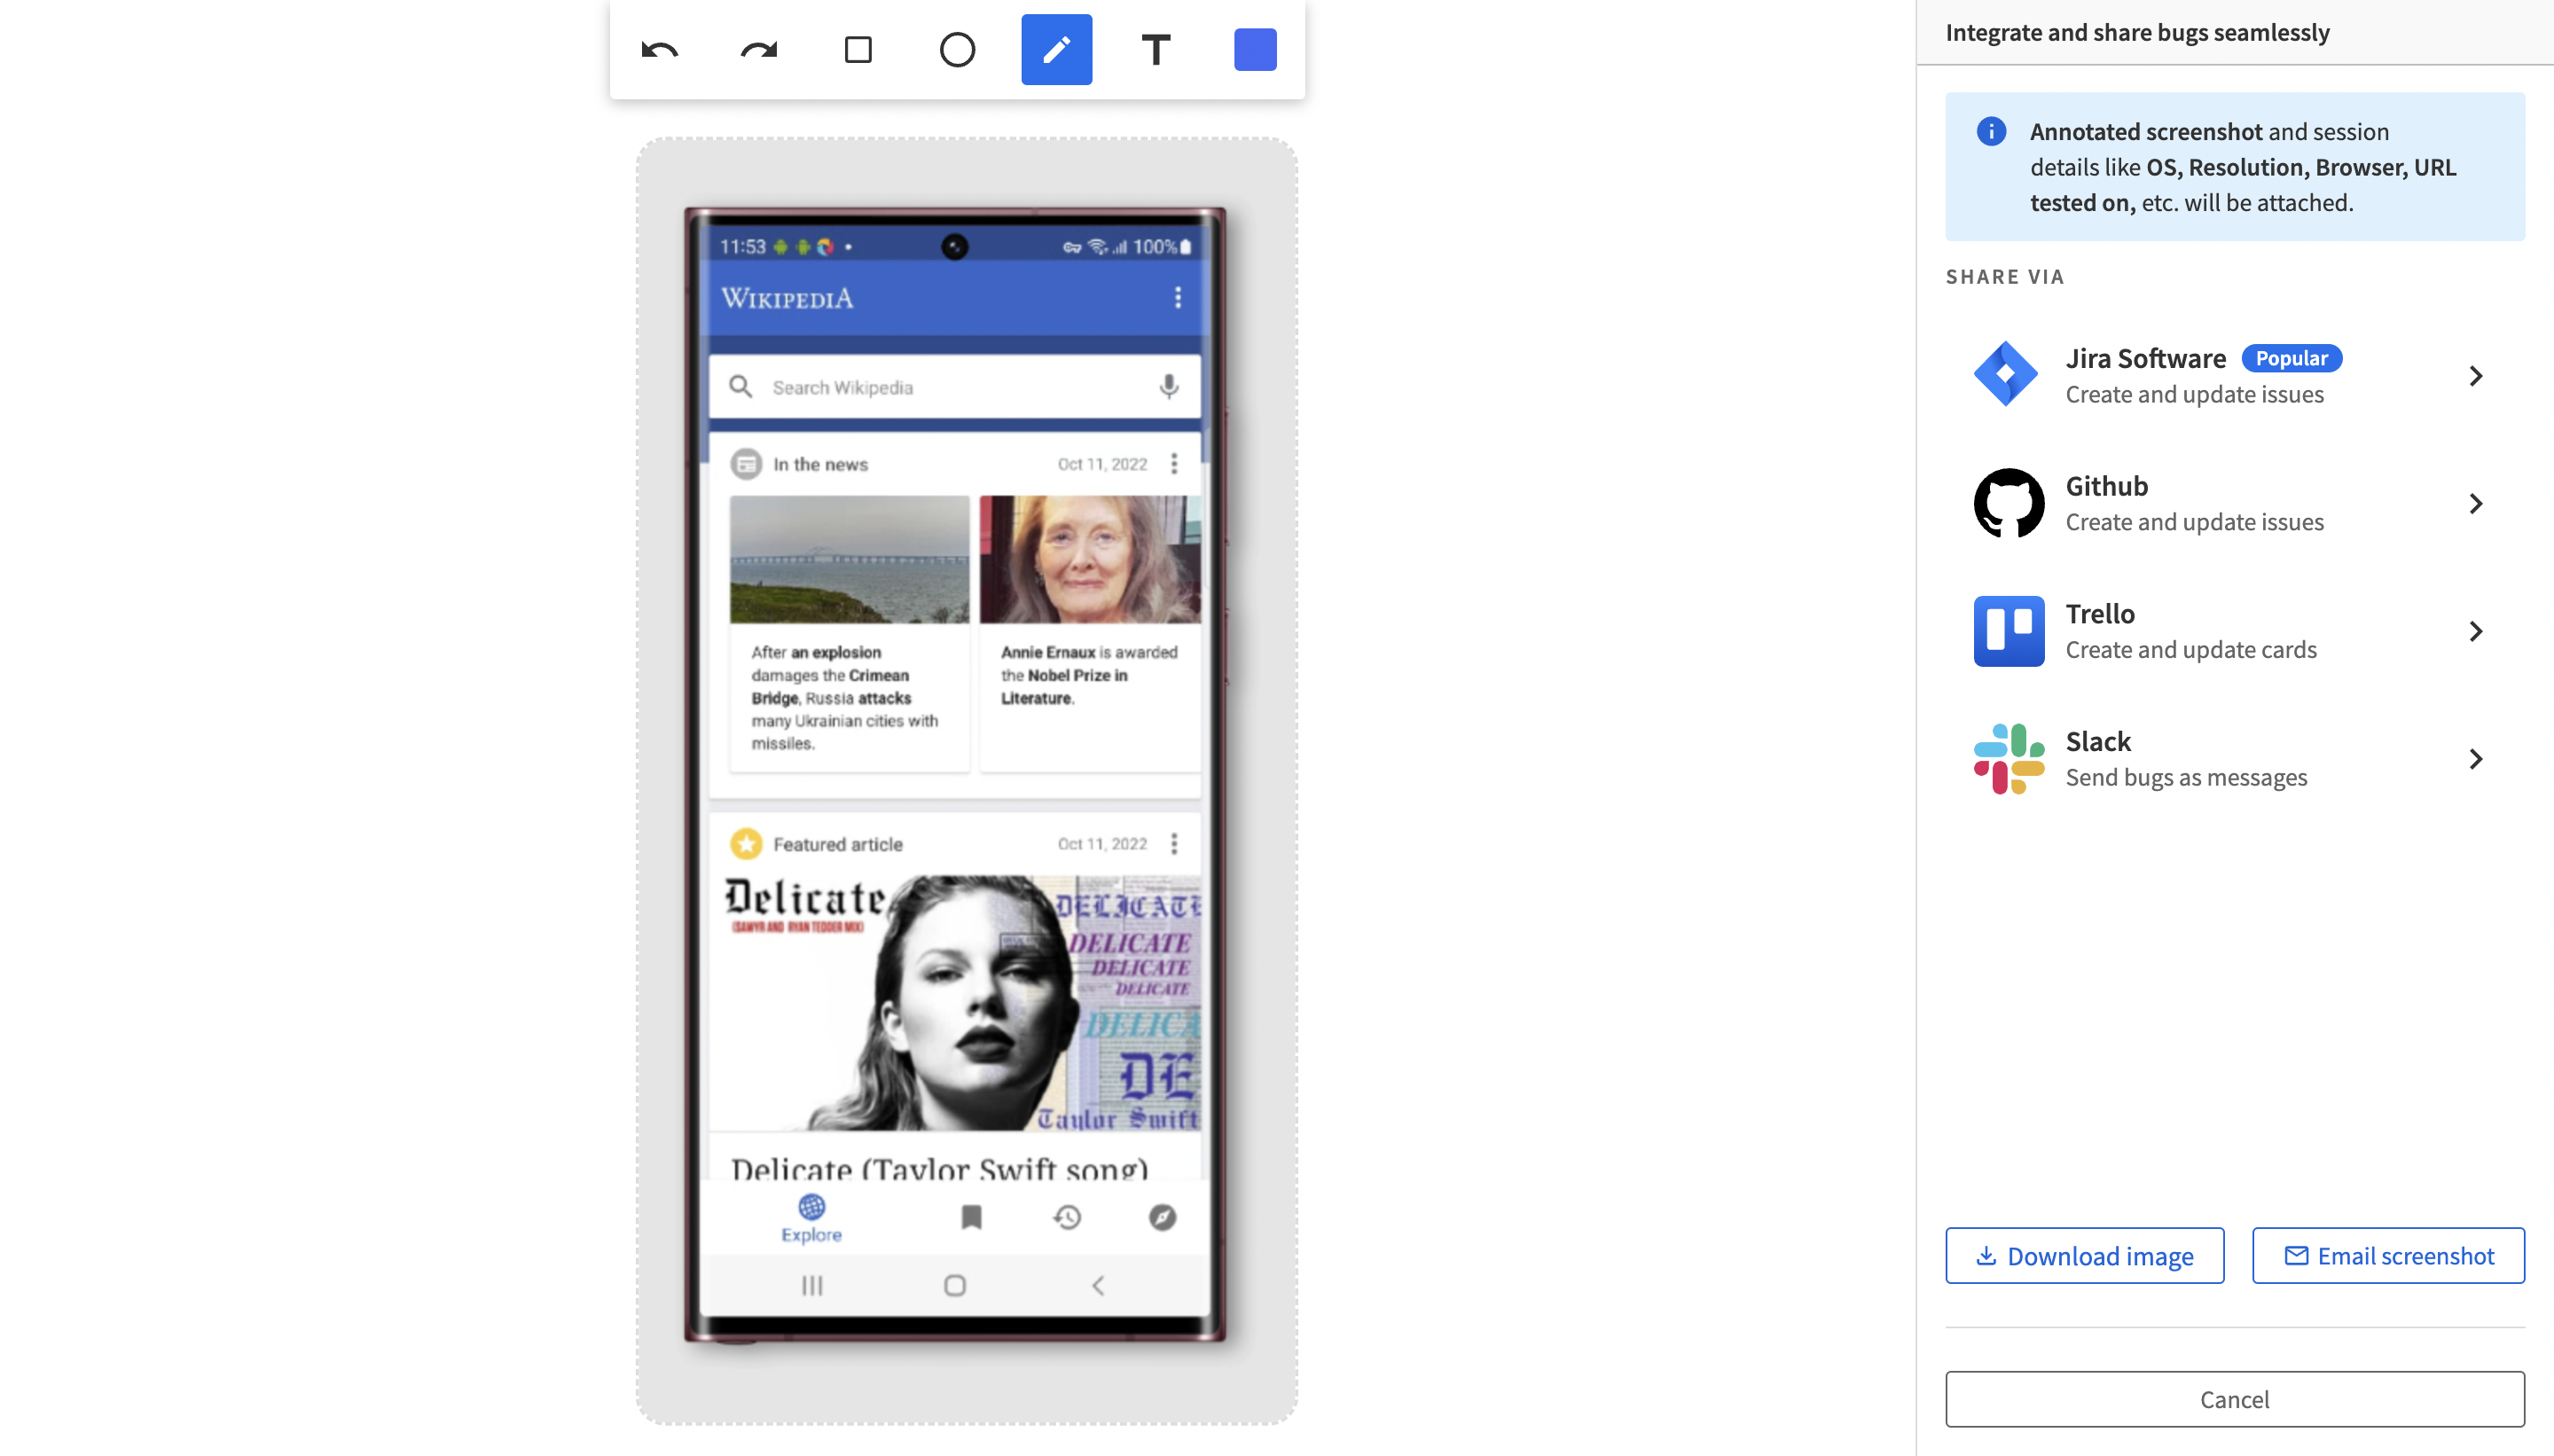
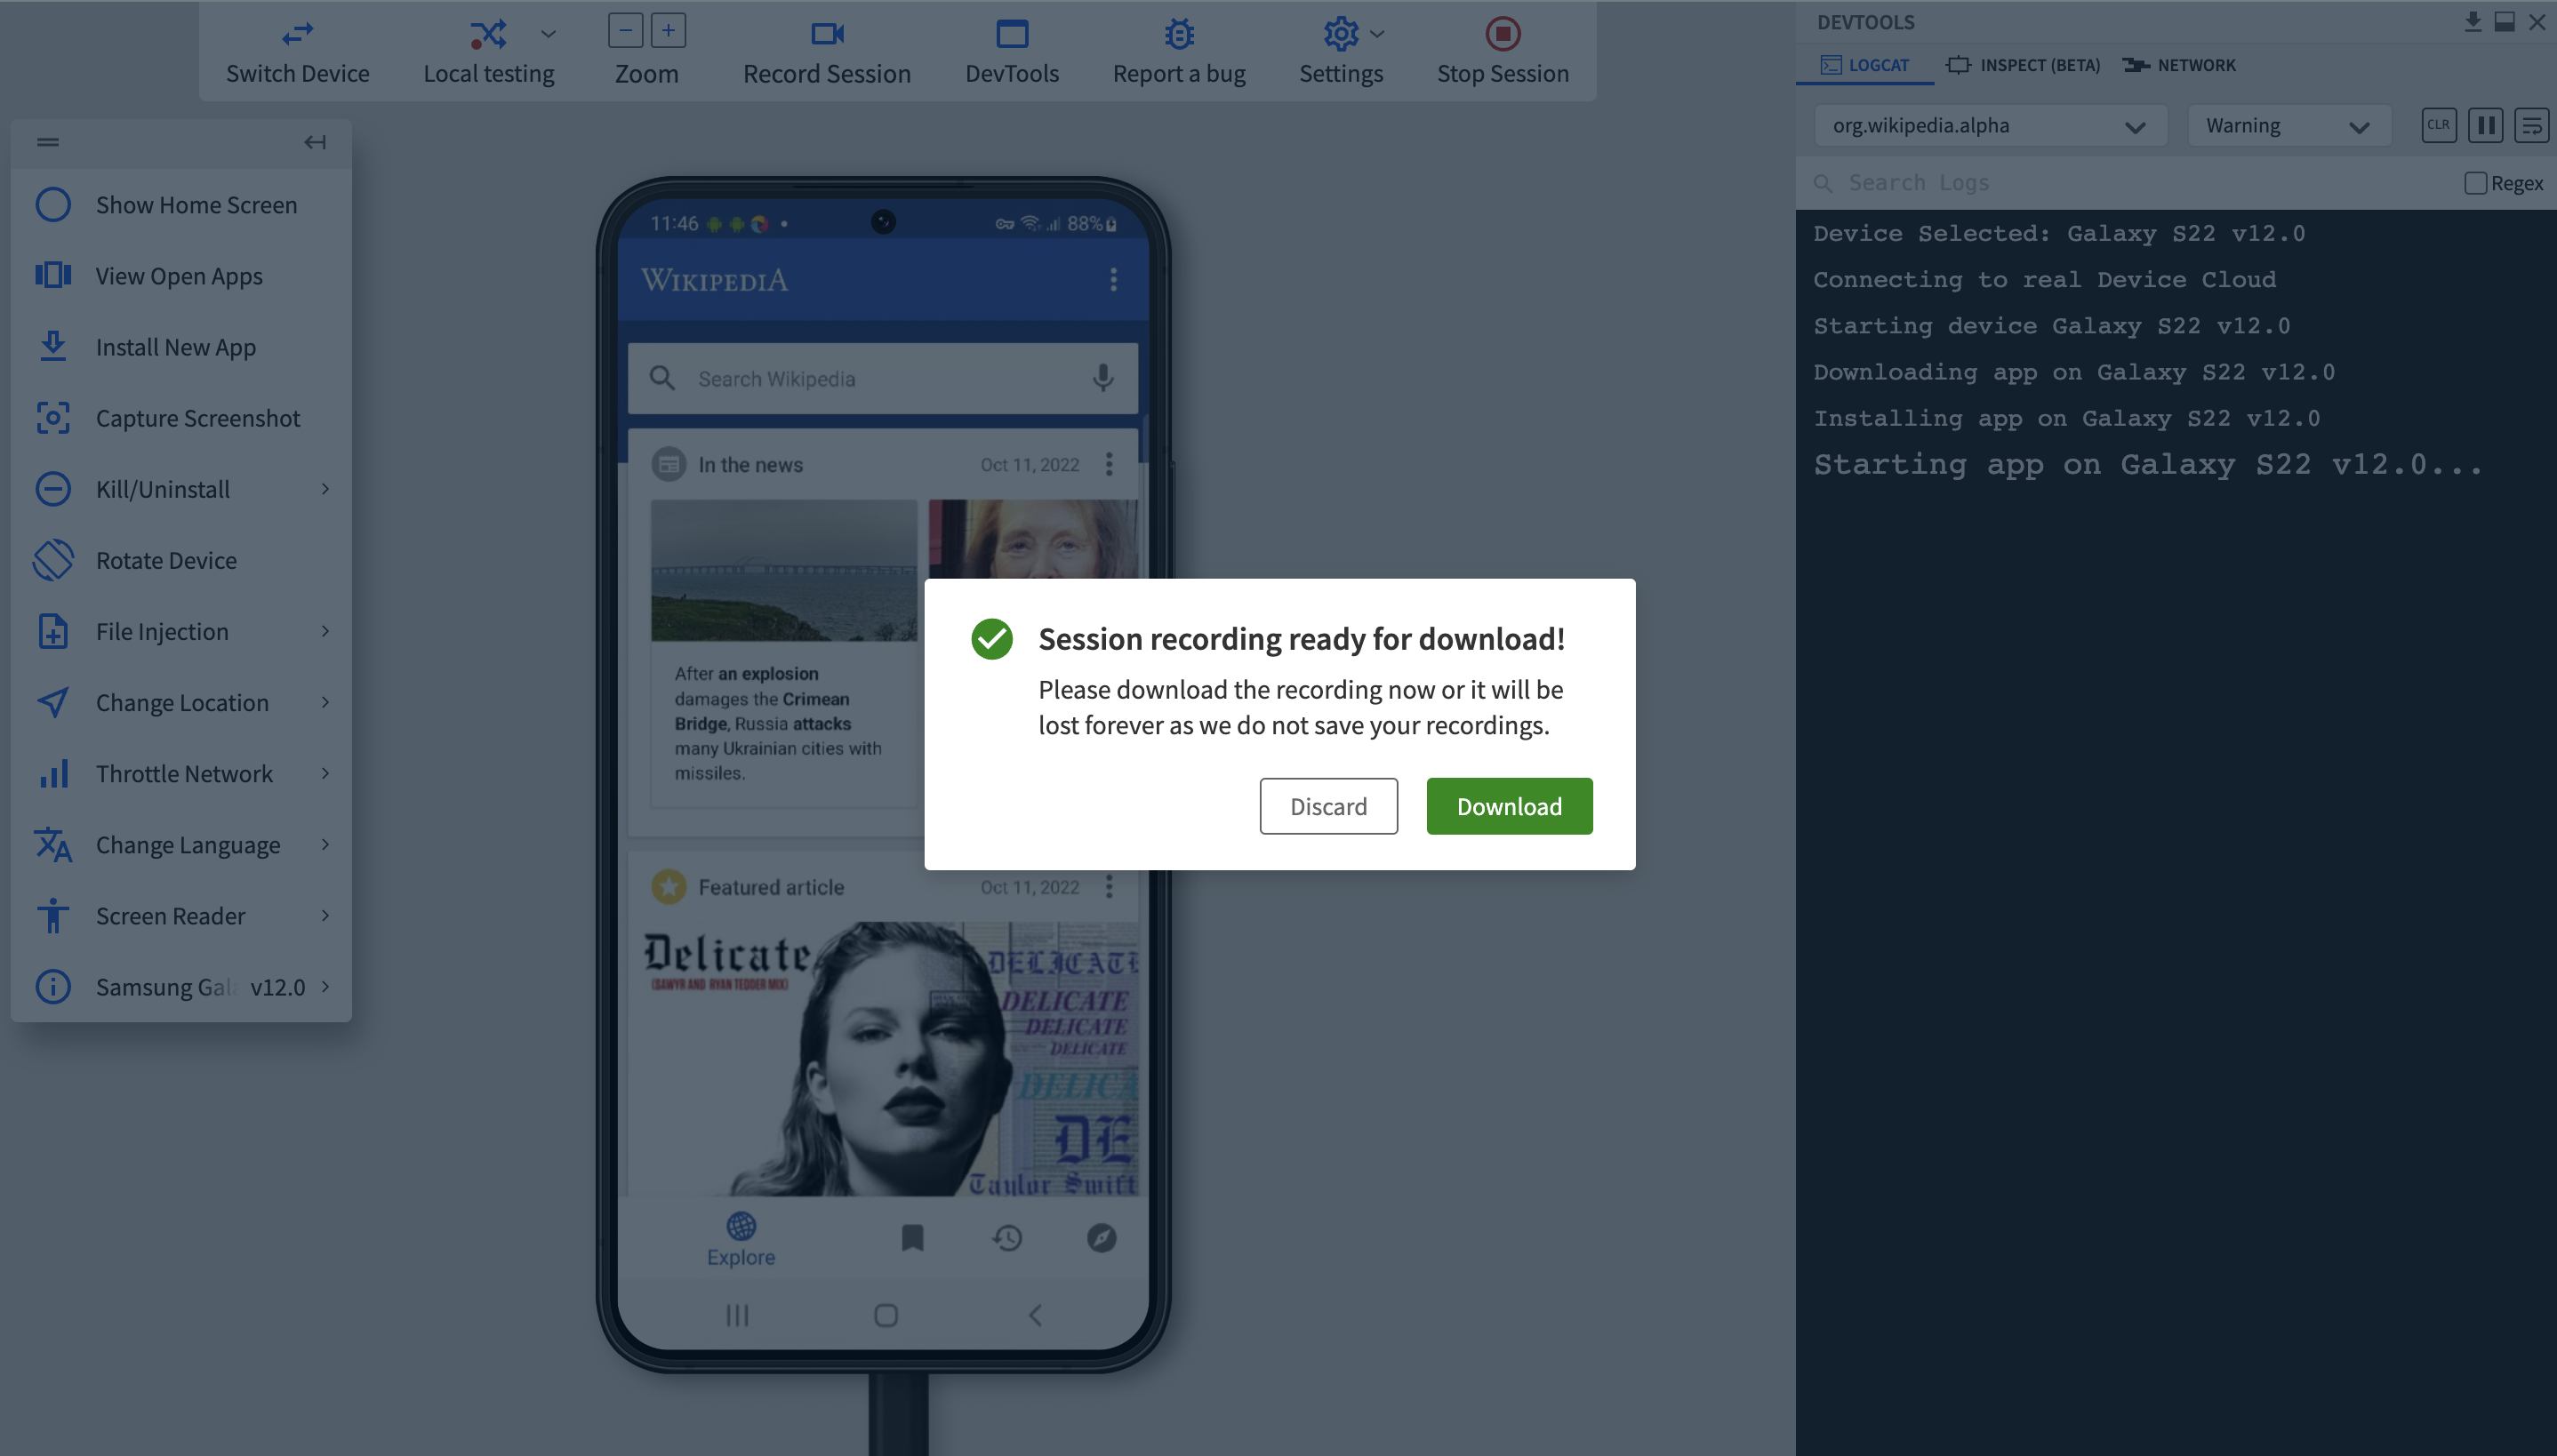
App Live test environment mimics your phone screen under testing. You can choose to record the session for your reference and go through the process again.
Conclusion
Even if devs and testers cannot do away with all app crashes due to the ever-evolving nature of the Android ecosystem, they can certainly make the effort to minimize them accurately and efficiently.
BrowserStack App Live is an integrated solution where you can easily track down the origin of the crash through stacktrace and methodically fix any problem interrupting the experience of users on the platform. Its native device features, natural gestures, and real-time debugging consolidate a robust error-proof environment for effective problem-fixing.
- For fixing bugs instantly during test automation, testers can make use of features like native device logs, Appium test logs, screenshots, and video recordings.
- For automated Android app testing, BrowserStack integrations with frameworks like Appium or Espresso for comprehensive testing also come in handy.
- Apart from debugging, text execution on environments with native device features like Push Notifications, Geolocation testing, and Network simulation also becomes a breeze on the BrowserStack infrastructure.


