How to Analyze Appium Logs
By Mohammed Waseem, Community Contributor - November 23, 2022
The logs in software or mobile app testing can be quite beneficial while troubleshooting the errors or debugging that may be encountered while the entire process runs. It is more than necessary to understand how you can read and analyze these logs that are auto-generated while the testing process is executed. This article discusses, how to analyze appium logs while testing mobile applications.
What is Appium Logs?
Mobile App Testing is an extensive process with Appium, which involves a lot of dependencies that run in parallel for the entire process to be completed. The Appium logs basically keep track of all the processes and applications running in tandem at certain points one after the other. It helps you keep track of the desired capabilities that are mentioned in the program and helps you ensure whether all the processes were performed correctly or something might have been out of place.
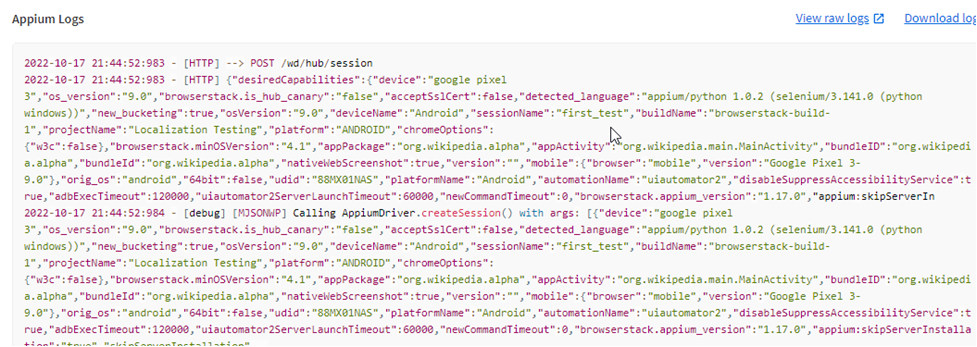
Here is a sample Appium Log that was generated after the execution of a test case.

Let’s take a look at some of the pointers that must be taken care of in order to ensure that the application testing was performed correctly.
How to Analyze Appium Logs
You can focus on the following points to make sure that you are analyzing the appium logs efficiently.
1. Starting up the Server
You should keep a good focus on the first few lines in the logs that basically give you an overview of the version of the appium and the information about the address that it is running on. Therefore, the information about the version gives you a great perspective on certain errors that you might face.
For example, some features may not function in previous versions and some might. So, getting clarity about the basic Appium functionalities through the logs is the first step in analyzing the appium logs.
2. Creation of Sessions
After the initial few lines, the logs contain the information about the sessions that must have been created for running the test cases. Information about the desired capabilities that are listed in the program and the application under test. Analyzing this information in the logs will give you a better understanding of what was intended for the test case, and if it is actually being executed during the testing.
3. Interaction With Web Elements
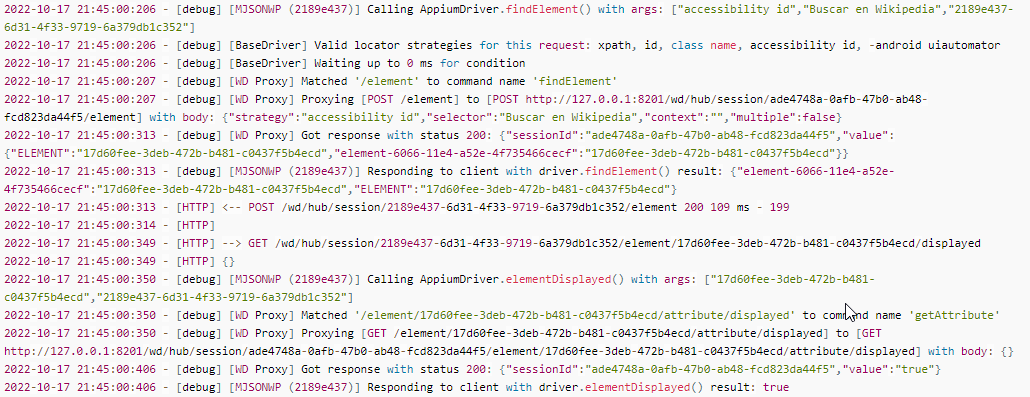
You can familiarize yourself with the appium logs that will display while you are interacting with the web elements such as clicking a button, sending keys in the text field, etc.
- Logs for Finding an Element
- Logs for Clicking a Button
4. Troubleshooting the Error Messages
After the critical information about the version, and desired capabilities, you could analyze the the error messages (if there are any). Troubleshooting of the error messages using Appium Logs is a great way to debug the errors or at least narrow down the issues that must be solved in order to get things started again.
Sometimes, troubleshooting can be as simple as moving a file to the correct path/directory. And if we take the example of Selenium – the most common error message is the driver executable file not being in the same directory or path.
Some of the most common error messages that you might encounter while using Appium for Mobile Testing are as follows:
- Cannot start the application
- Connection Refused
- Unrecognized SSL Message
Let’s go ahead and take a look at a couple of best practices that can make your life easier while analyzing appium logs.
Best Practices for Analyzing Appium Logs
One of the best practices you can use while using or analyzing appium logs is the flags that will change the output you will get in your logs.
- Timestamp: You can use the –log-timestamp flag to get the timestamp of the event in the appium logs. It basically helps you keep track of the events where you must have involved a timeout.
- See only what you Need: Use the –log-level to specify only the information that you require in your logs. Because as you go forward in your testing journey, all the information in the logs might not be necessary and it could be a lot of information at times.
- Share Appium Logs with team: Troubleshooting might require some brainstorming at times. Hence, involving multiple people from the team can make it easier to identify and resolve bugs. Hence, sharing Appium Logs with team using tools like Trello and Jira, can make debugging easier.
BrowserStack App Automate allows you to share the Appium Logs with the team using integrations with Slack, GitHub, Trello and Jira. Moreover, it allows you to test on real iOS and Android devices under real user conditions like network simulation, barcode, QR code testing, geolocation testing for a thorough and comprehensive testing experince.
Try BrowserStack App Automate for Free
Conclusion
Logging is as important as writing a test case – software testing, mobile application testing, or web application testing. It gives a detailed report on the events – their failures, successes, shortcomings, etc. More importantly, it gives us the opportunity to troubleshoot problems right from the beginning and saves quite a lot of time.


