Flutter Debugging: Top Tools and Tips
By Shubham Bhamare, Community Contributor - December 24, 2024
Flutter is a free, open-source UI framework developed and maintained by Google that lets developers build apps for Android, iOS, PC, web, and even embedded devices, all from a single codebase.
It uses Dart programming language and comes with a library of ready-made widgets, making it easier to design beautiful and high-performance apps.
Since Flutter lets you build for multiple platforms from a single codebase, differences in how each platform handles certain features can sometimes lead to unexpected behavior.
With effective debugging, developers can catch these issues early, ensuring the app works well everywhere it’s used.
With this guide, learn how to debug flutter apps effectively with the right tools and techniques.
- How to Run a Flutter App in Debug Mode?
- Tools for Debugging Flutter Applications
- 1. BrowserStack App Automate
- 2. Flutter DevTools
- 3. Hot Reload
- 4. Hot Restart
- 5. Debugger in IDEs
How to Run a Flutter App in Debug Mode?
Running a Flutter app in debug mode is simple and can be done through the command line or in an IDE like Android Studio or Visual Studio Code.
By default, the app starts in debug mode if you run the command flutter run.
This mode offers handy features like hot reload (so you can see changes instantly), error checking, and step-by-step debugging, making it easier to catch and fix problems.
If you’re using Android Studio,
- Go to the menu
- Select Run > Debug to begin debugging
- You can also simply click the green bug icon to start debugging
Also Read: Flutter vs Android Studio: Core Differences
For Visual Studio Code,
- Open your Flutter project
- Choose your device
- Click the debug icon to begin
In debug mode, you’ll be able to set breakpoints, go through your code line by line, and check values to find and fix issues as you go.
Tools for Debugging Flutter Applications
Debugging is a crucial part of building any app, and in Flutter, it’s even more important due to its focus on smooth, high-performance interfaces.
Luckily, there are many helpful tools to make flutter debugging easier. Here’s a look at some of the main tools available:
1. BrowserStack App Automate
BrowserStack App Automate provides cloud-based testing for mobile apps, so you can run tests on real devices and browsers without having to set up an actual physical device lab.
With integrations that offer insights into app performance and behavior, the tool is especially useful for spotting issues that might not show up in local testing.
Here are some features that make BrowserStack Automate a great tool for debugging flutter applications:
- Real Device Testing: You can test your flutter applications via a vast real device cloud that offers 2000+ iOS and Android devices.
- Parallel Testing: Run tests on multiple devices parallel to speed up test execution.
- Test Native Device Features: Test for scenarios like connectivity, network strengths, login authentication, and payments.
- Geolocation Testing: Test your apps across different timezones, languages, and locations.
- Detailed Debugging: The tool offers comprehensive debugging capability via logs, screenshots, video recording, and other options.
2. Flutter DevTools
Flutter DevTools is a suite of tools specifically designed for debugging Flutter apps. You can open it in IDEs like Android Studio and Visual Studio Code or access it through a browser. Here’s a quick overview of its main features:
- Widget Inspector: This tool helps you see and understand your app’s widget tree (the structure of your UI). By selecting a widget, you can view its properties and see where it fits in the layout. This is a great way to troubleshoot UI issues in complex layouts.
- Timeline View: The Timeline View provides a snapshot of how your app’s frames are rendered over time. It’s helpful for spotting slowdowns, or “jank,” in animations and transitions by showing how long each operation takes.
- Memory View: This feature monitors your app’s memory usage. It shows memory allocation, garbage collection, and any potential memory leaks, which can help you optimize your app’s performance.
- CPU Profiler: The CPU Profiler lets you see how your app uses the CPU by providing a breakdown of the most resource-heavy functions. This information can help you identify areas of code that could be made more efficient.
Read More: How to make Flutter App Responsive
3. Hot Reload
Hot Reload is one of Flutter’s best features. It lets you instantly see changes in your app without restarting it, which is great for quickly test out new UI designs or functionality. Additionally, it preserves the app’s current state, so you don’t lose your place.
4. Hot Restart
While Hot Reload is quick, Hot Restart goes a step further by restarting the entire app. This is useful when you need to reapply changes that Hot Reload might miss, like updates to global variables or initializations.
5. Debugger in IDEs
Most Flutter-friendly IDEs, like Android Studio and Visual Studio Code, come with built-in debugging tools that work well with DevTools. You can set breakpoints, step through code, inspect variables, and even evaluate expressions directly in the IDE, which keeps everything in one place and makes debugging faster and more organized.
Read More: How to Test Flutter Apps on Real iOS Devices
How to Debug Flutter Apps with BrowserStack’s App Automate
BrowserStack’s App Automate is a powerful tool for testing and debugging Flutter apps in real time across a wide range of devices.
Here’s how you can debug flutter apps with BrowserStack App Automate
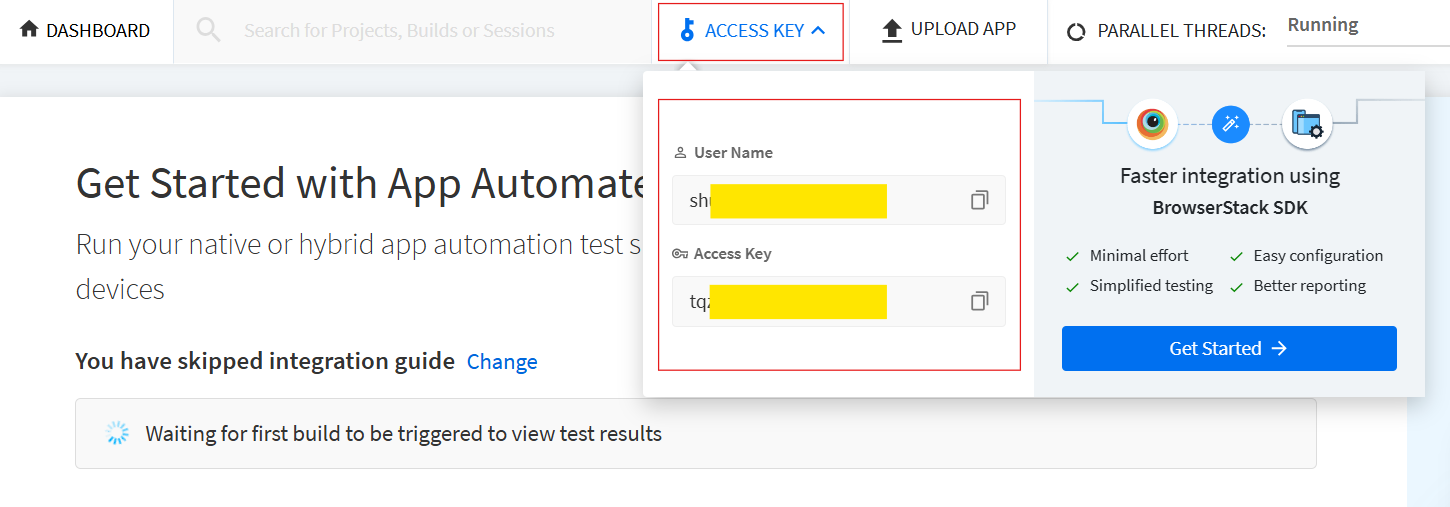
Step 1: Set Up Your BrowserStack Account
- Sign up with BrowserStack and Create your account.
- Once logged in, go to your account settings and find your Username and Access Key. You will use these to connect BrowserStack with your Flutter app.
Step 2: Configure Your Flutter App for Testing
- Open your Flutter project and add the necessary dependencies to your pubspec.yaml file.
dependencies:

  flutter_driver:

    sdk: flutter

dev_dependencies:

  test: any
- Add a test_driver folder in your project’s root directory containing the files for setting up and running tests. These files typically include app.dart for running the app and app_test.dart for your test cases.
Step 3: Upload Your App to BrowserStack
- Use the following command in the terminal to upload your Flutter app to BrowserStack:
curl -u "YOUT_USERNAME:YOUR_ACCESS_KEY" \

-X POST "https://api-cloud.browserstack.com/app-automate/flutter-integration-tests/v2/android/app" \

-F "file=@/path/to/app/file/application-debug.apk"
- After uploading, BrowserStack will provide you with an app_url, which you will need to add to your configuration file.
{

    "app_name": "flutter-test.apk",

    "app_url": "bs://UNIQUE_APP_URL",

    "app_version": "1.0",

    "app_id": "UNIQUE_APP_ID",

    "uploaded_at": "2024-11-05 11:50:30 UTC",

    "expiry" : "2024-12-05 11:50:30 UTC"

}
Step 4: Set Up BrowserStack Configuration File
- Make a new file called browserstack_config.json in your project. This file will store the necessary BrowserStack settings.
- In browserstack_config.json, include details like the app_url, devices, and your credentials:
{

   "browserstack.user": "YOUR_USERNAME",

   "browserstack.key": "YOUR_ACCESS_KEY",

   "app": "bs://YOUR_APP_URL",

   "devices": ["Google Pixel 3", "Samsung Galaxy S10"],

   "os_version": "10.0",

   "project": "Your Project Name",

   "build": "Build Name",

   "name": "Test Name"

}
Step 5: Run Tests on BrowserStack
- In your terminal, run the following command to start testing your app on BrowserStack:
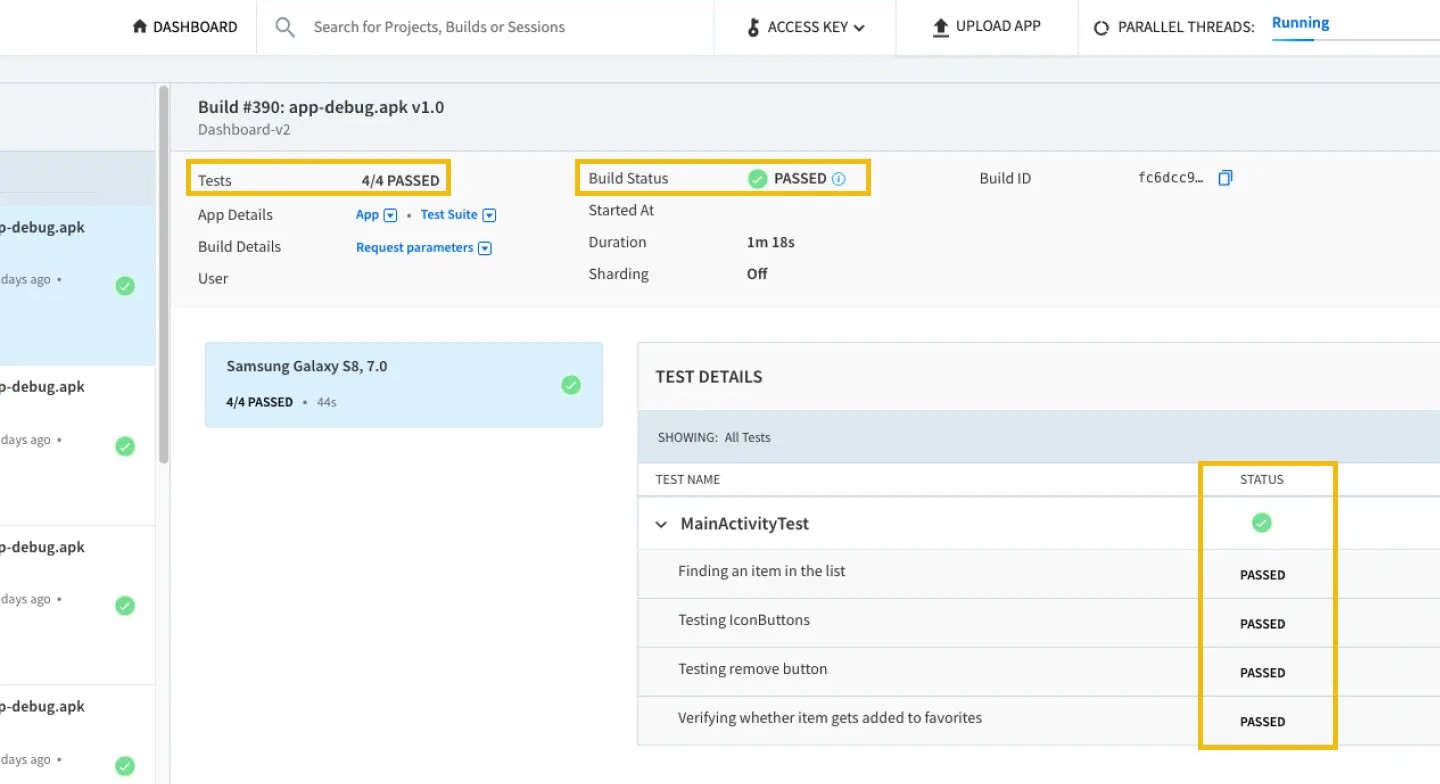
flutter drive --target=test_driver/app.dart --config browserstack_config.json- As the tests run, you’ll be able to see the results in real time. Visit the BrowserStack Dashboard to track your tests and see how your app behaves on different devices.
Step 6: Debug and Analyze Results
- BrowserStack provides logs and screenshots for each test session. Use these to understand where issues might be occurring in your app.
- Re-run any test session to reproduce issues and check if they’re resolved after making changes to your code.
- You can download detailed reports and logs from the BrowserStack Dashboard to share with your team or for further analysis.
Why Choose BrowserStack’s App Automate?
BrowserStack’s App Automate comes with a range of functionalities to enhance your flutter debugging efforts:
- Wide Device Coverage: Test on 3500+ real devices, so that you can maximize test coverage without having to maintain a costly device lab.
- Ease of Use: BrowserStack has a user-friendly interface that lets you focus on testing instead of managing the setup.
- OS Support: BrowserStack seamlessly lets you test across multiple devices with various operating systems, such as Android or iOS.
Read More: How to test Flutter Apps on Android Devices?
- Comprehensive Flutter Support: It integrates seamlessly with Flutter, making it easier to debug hybrid apps with complex scenarios.
- Seamless Reporting: Get logs, screenshots, and videos for every test, making it easy to identify and fix issues.
- Seamless integrations: BrowserStack integrates seamlessly with CI/CD tools like Jenkins, Travis CI, Circle CI and more.
Read More: CircleCI vs Jenkins: A Detailed Comparison
- Scalability: BrowserStack comes with a scalable infrastructure, a wide range of real devices, multiple integration options, and features like parallel testing to scale up or down as per your requirements.
Best Practices for Debugging Flutter Applications
By following best practices while debugging flutter apps, developers can identify and resolve issues more efficiently. Follow these best practices, which will help you find and fix bugs quickly:
1. Logging
Proper logging helps you track what’s happening inside your app. This includes:
- Console Output Analysis: Use the Debug Console in Flutter DevTools to view real time logs. This lets you monitor your app’s output while it runs or pauses, making it easier to follow the app’s flow and spot any issues.
- Print Statements: Using print() statements can help you track variables and see where your code is going. However, too many print statements can clutter your console. Try debugPrint() instead, which limits the output and keeps things cleaner.
2. Use Assertions
Assertions (assert()) in Dart allow you to check assumptions in your code. They help catch logical errors early by ensuring certain conditions are met before the code continues. This is an easy way to detect and fix problems while developing.
3. Testing
Testing is essential to confirm that your app behaves as expected. Here’s a quick look at the main types of tests in Flutter:
- Unit Tests: Focus on testing individual functions or components to ensure they work on their own.
- Widget Tests: Test individual widgets to check that they display correctly and respond to user actions as expected.
- Integration Tests: Test how parts of the app work together by simulating real user scenarios. This helps catch issues that may appear only when components interact.
- Golden Tests: Compare a widget’s current appearance with a “golden” reference image to make sure it hasn’t changed unexpectedly.
- Behavior Tests: Validate that the app behaves as expected based on user actions.
- Performance Tests: Check how the app performs under different conditions to catch any slowdowns or bottlenecks.
Read More: Essential Guide to Flutter Test Automation
4. Community and Documentation
The Flutter community has resources that can help when you’re stuck. Platforms like Stack Overflow, GitHub discussions, and official Flutter forums are great for finding advice from other developers. Flutter’s documentation also provides thorough guidance on debugging tools and techniques.
5. Advanced Debugging Techniques
For more complex issues, consider these advanced tools:
- Analyze Network Requests: If your app relies on APIs, inspect network traffic with DevTools to diagnose issues with data requests and responses.
- Profiling and Performance Tuning: Profiling tools in DevTools let you analyze CPU and memory usage as well as rendering performance. This helps you optimize the app to run efficiently.
Conclusion
Debugging Flutter apps is crucial to make sure they perform well and keep users happy on all platforms. Tools like BrowserStack’s App Automate make this easier by allowing developers to test and debug in real time on multiple real devices. This helps catch and fix issues faster as you are able to test under real user conditions.
Frequently Asked Questions
1. How to debug the Flutter app in Chrome?
To debug a Flutter app in Chrome, run the app using flutter run -d chrome and utilize Chrome DevTools to inspect elements and monitor performance.
2. How to put breakpoint in Flutter?
To put a breakpoint in Flutter, simply click in the gutter next to the line number in your IDE while running the app in debug mode.
Useful Resources for Flutter
- Essential Guide to Flutter Test Automation
- Flutter vs React Native: A Comparison
- How to make Flutter App Responsive
- How to Test Flutter Apps Using Appium Automation
- TDD in Flutter: How To Use Test Driven Development in Flutter
- How to run integration tests on Flutter apps
- Introduction to UI Testing in Flutter
- How to test Flutter Apps on Android Devices?
- Flutter vs Android Studio: Core Differences
- How to Test Flutter Apps on Real iOS Devices
