Debugging Tools for Android
By Vivek Mannotra, Community Contributor - September 17, 2024
Android app developers design and build applications that users download from the Play Store or other distribution platforms.
Building a successful app requires many skills, including coding and debugging. Android debugging tools help developers fix bugs by analyzing app states and component behavior in real-time environments during the development process.
This guide explores what Android debugging tools are, the top choices to consider, and their key features.
What are Android Debugging Tools?
Android debugging tools are software applications or utilities designed to assist developers in identifying and resolving bugs, performance bottlenecks, and other issues within Android applications.
They provide insights into the app’s behavior during runtime, allowing developers to pinpoint the root cause of problems and implement effective solutions.
Android offers Android Studio as the official IDE for coding, debugging, and testing Android apps. Developers using Android Studio as the coding IDE can use the following features for debugging:
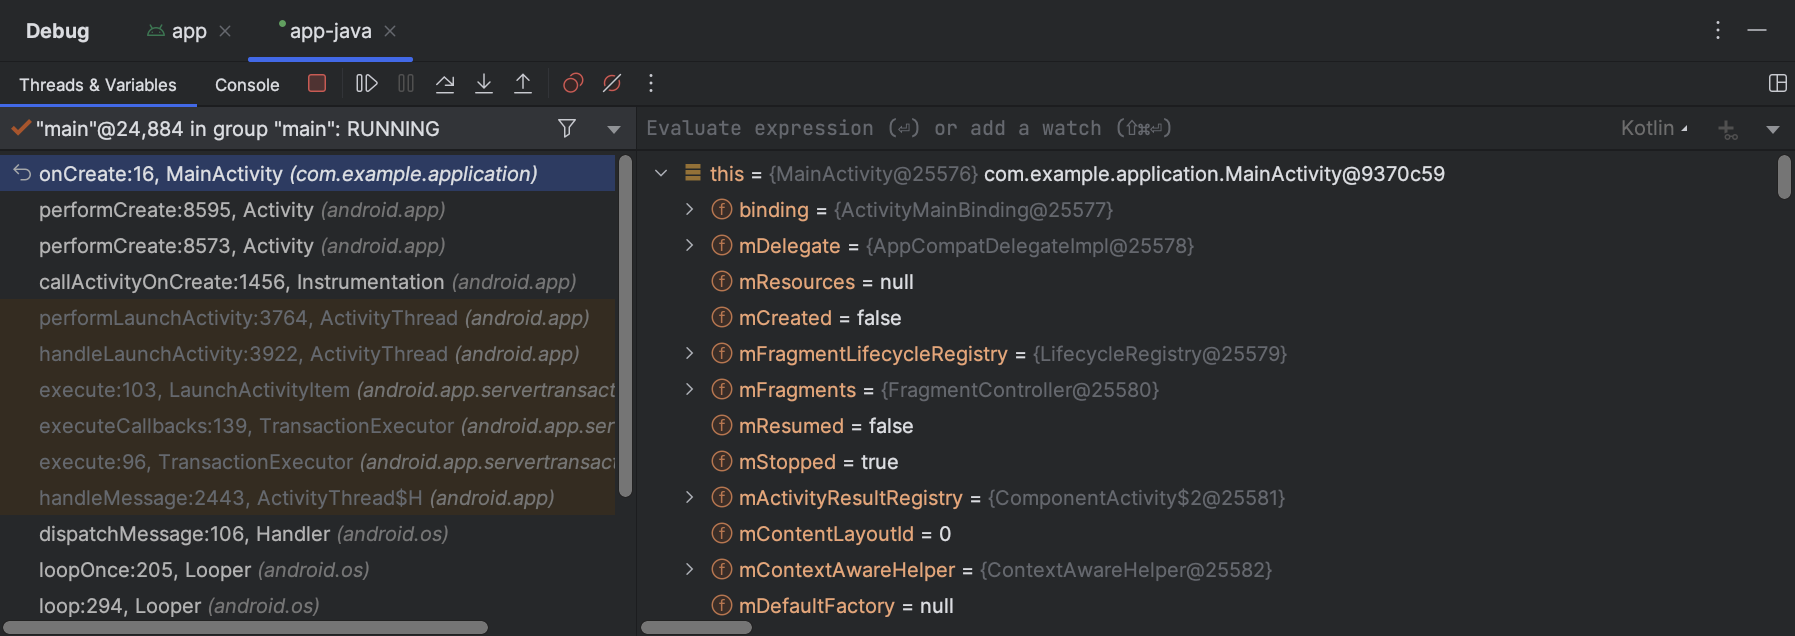
- Android Studio Debugger: In-line breakpoints for code inspection with features for evaluating variables, function call stack, memory, etc.
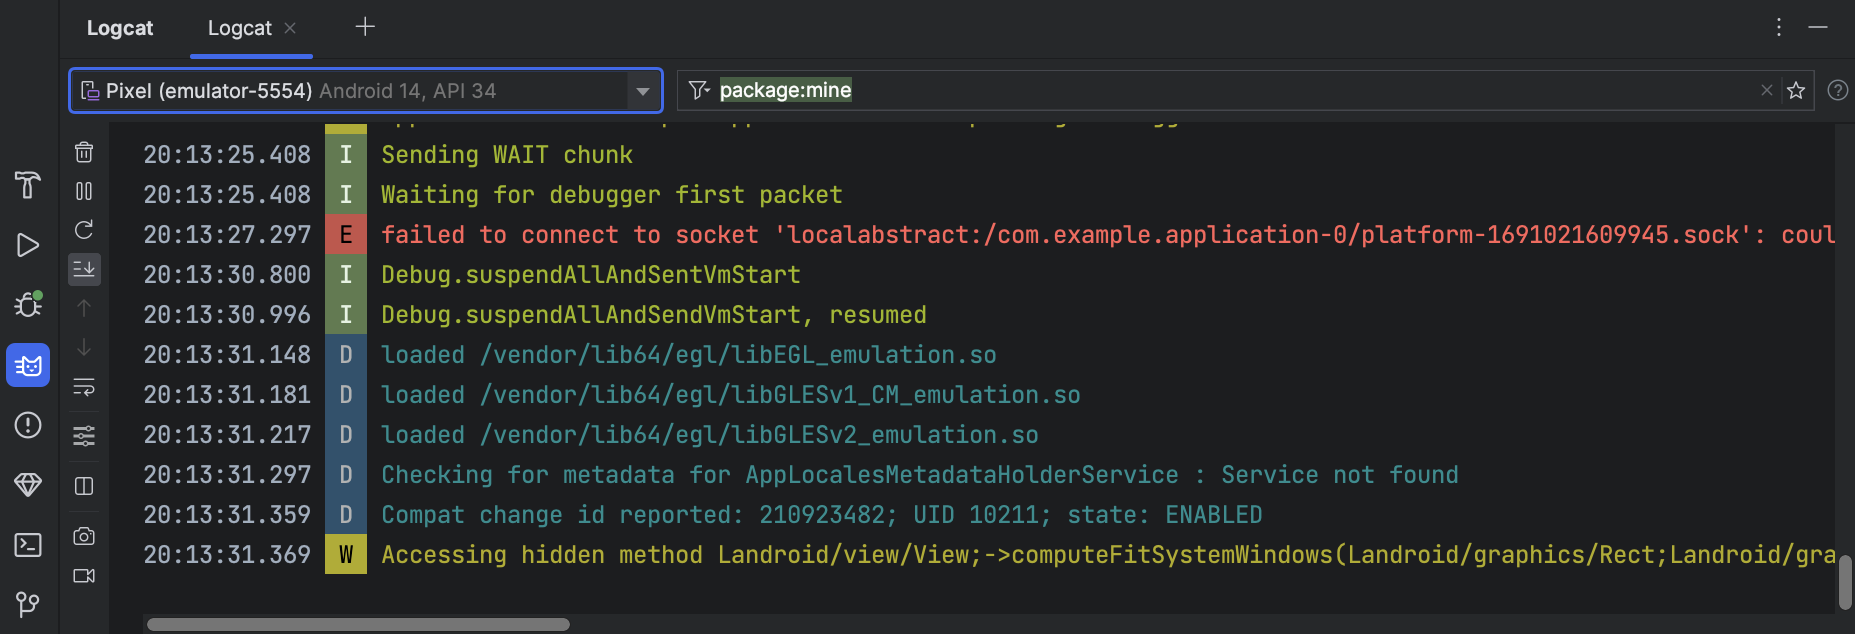
- Logcat: Integrated logging tool that runs on Android and can be accessed via CLI.
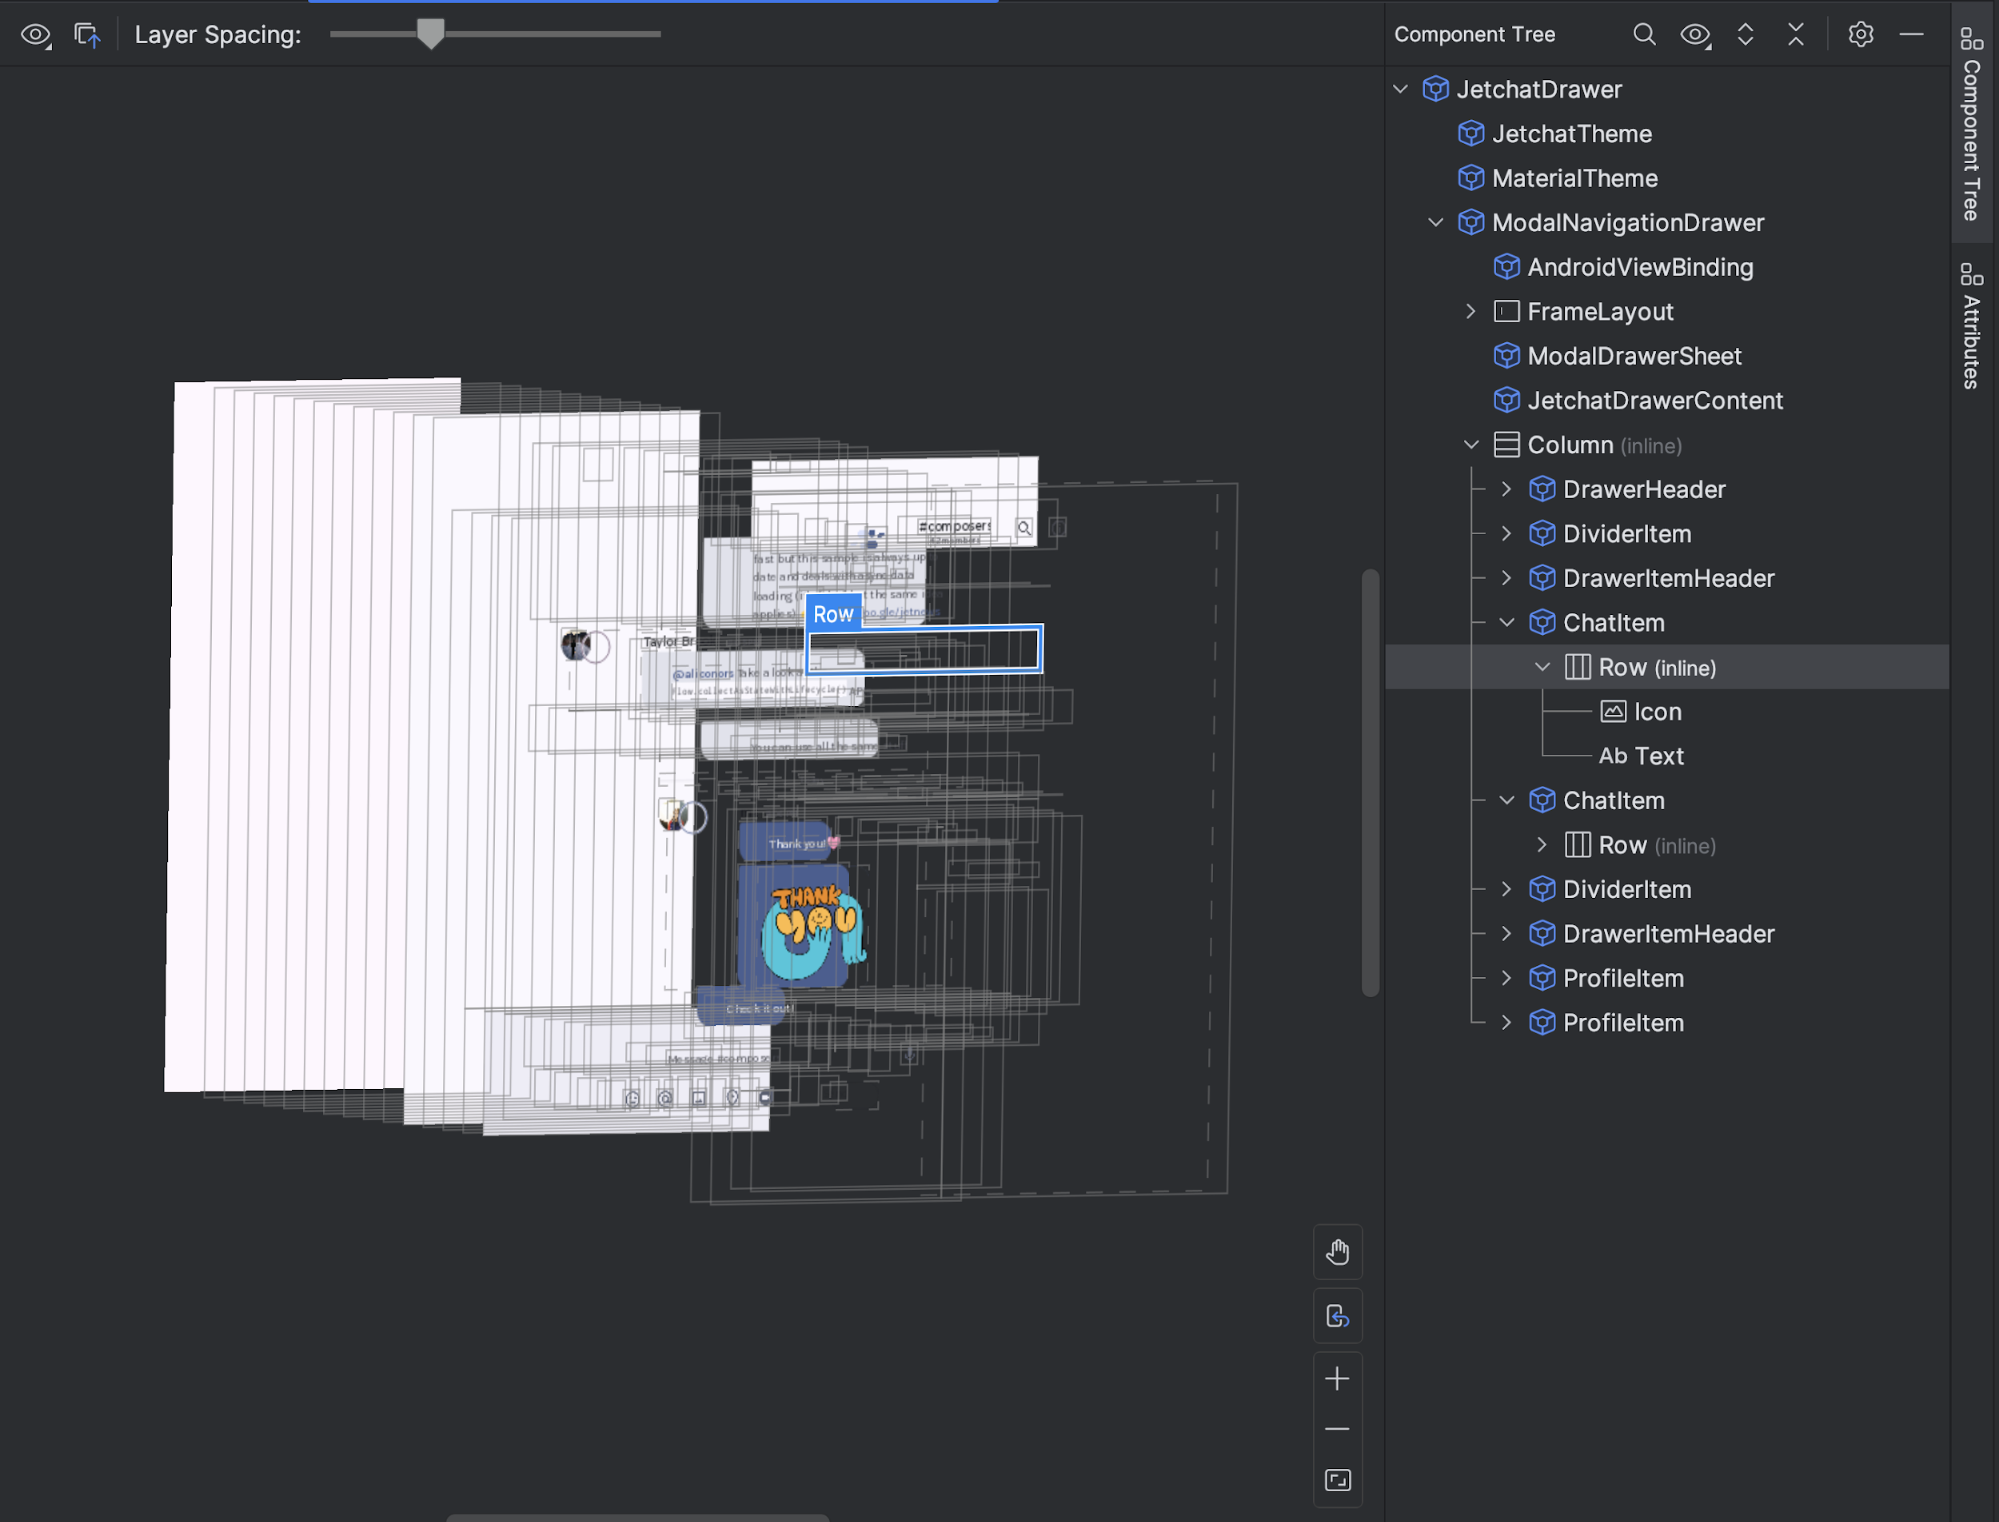
- Layout Inspector: Built into Android Studio for UI inspection.
- Memory Profiler: Part of the Android Studio Profiler for memory analysis.
- CPU Profiler: Integrated into Android Studio for CPU performance analysis.
- Network Profiler: Integrated network monitoring tool.
Command Line Interface (CLI) Tools are part of Android’s SDK Tools, offering advanced debugging capabilities with:
- ADB (Android Debug Bridge): Command-line tool for interacting with Android devices/emulators, including file management, shell access, and debugging.
- Systrace: Captures a system traces from the command line.
- StrictMode: Enforces and detects improper coding practices like disk and network access on the main thread.
Commercial debugging tools come into play when a person either wants to set up a custom coding flow without Android Studio and still needs high-fidelity debugging capabilities or needs to debug something on the client side, that is, on the user’s device, for live debugging.
Key Features to look for in Android Debugging Tools
Before the Android Package Kit (APK) is built, focus on debugging the source code, user interface, and performance issues within the development environment.
For these, you must choose an Android debugging tool with the features given below:
- Android Studio Debugger: For setting breakpoints, stepping through code, and inspecting variables during development.
- Logcat: Monitor real-time logs, exceptions, and system messages during development.
- Memory Profiler: To detect memory leaks and optimize memory usage before packaging.
- CPU Profiler: To analyze CPU usage and optimize performance.
- Layout Inspector: For ensuring the UI is properly rendered.
If you use a different IDE or a custom setup for coding, in-line code debugging for those cases will have to be set up separately, depending on the chosen tool kit.
Once you’ve successfully built and released an app, debugging shifts focus. At this stage, it involves diagnosing user device issues, which requires different tools compared to the development phase.
Hence, for building a comprehensive debugging capability on any tech stack, the following factors should be considered:
- Real-time Debugging: Ability to step through code execution, set breakpoints, and inspect variables in real-time.
- Performance Monitoring: Tools to analyze CPU usage, memory allocation, network requests, and other performance metrics.
- UI Inspection: Features for visualizing the view hierarchy, identifying layout issues, and inspecting view properties.
- Network Analysis: Tools to monitor network traffic, inspect HTTP requests and responses, and diagnose network-related problems.
- Crash Reporting: Mechanisms to capture and report crashes, providing detailed information about the error and its context.
- Events & Analytics: Apps are often deployed for business goals, so the ability to debug business events like purchases or product reviews is desired in some cases.
- Device Compatibility: Support a wide range of Android devices and OS versions.
- Integration & Extensibility: Seamless integration with popular IDEs and the ability to extend functionality through plugins or APIs.
- Usability: An intuitive user interface and clear documentation to facilitate easy adoption and efficient debugging.
Android Debug Bridge (ADB) is one of the most commonly used tools for debugging Android app-level issues. It allows developers to interact with a device directly through a command-line interface.
Chrome DevTools is also essential for Android debugging, especially for web and hybrid apps. When an Android device is connected via USB, Chrome enables remote debugging, allowing developers to inspect and interact with mobile websites and web apps from a desktop browser. This real-time setup lets developers view and modify the DOM, monitor network activity, debug JavaScript, and assess performance.
While the official Android SDK offers robust debugging tools like Logcat, ADB, and Android Device Monitor, commercial tools often provide more advanced features and seamless integrations, making them a valuable addition to the developer’s toolkit.
Best Android Debugging Tools
1. BrowserStack
BrowserStack is a cloud-based testing platform that provides access to real Android devices for testing and debugging. It offers two key tools for Android debugging:
App Live
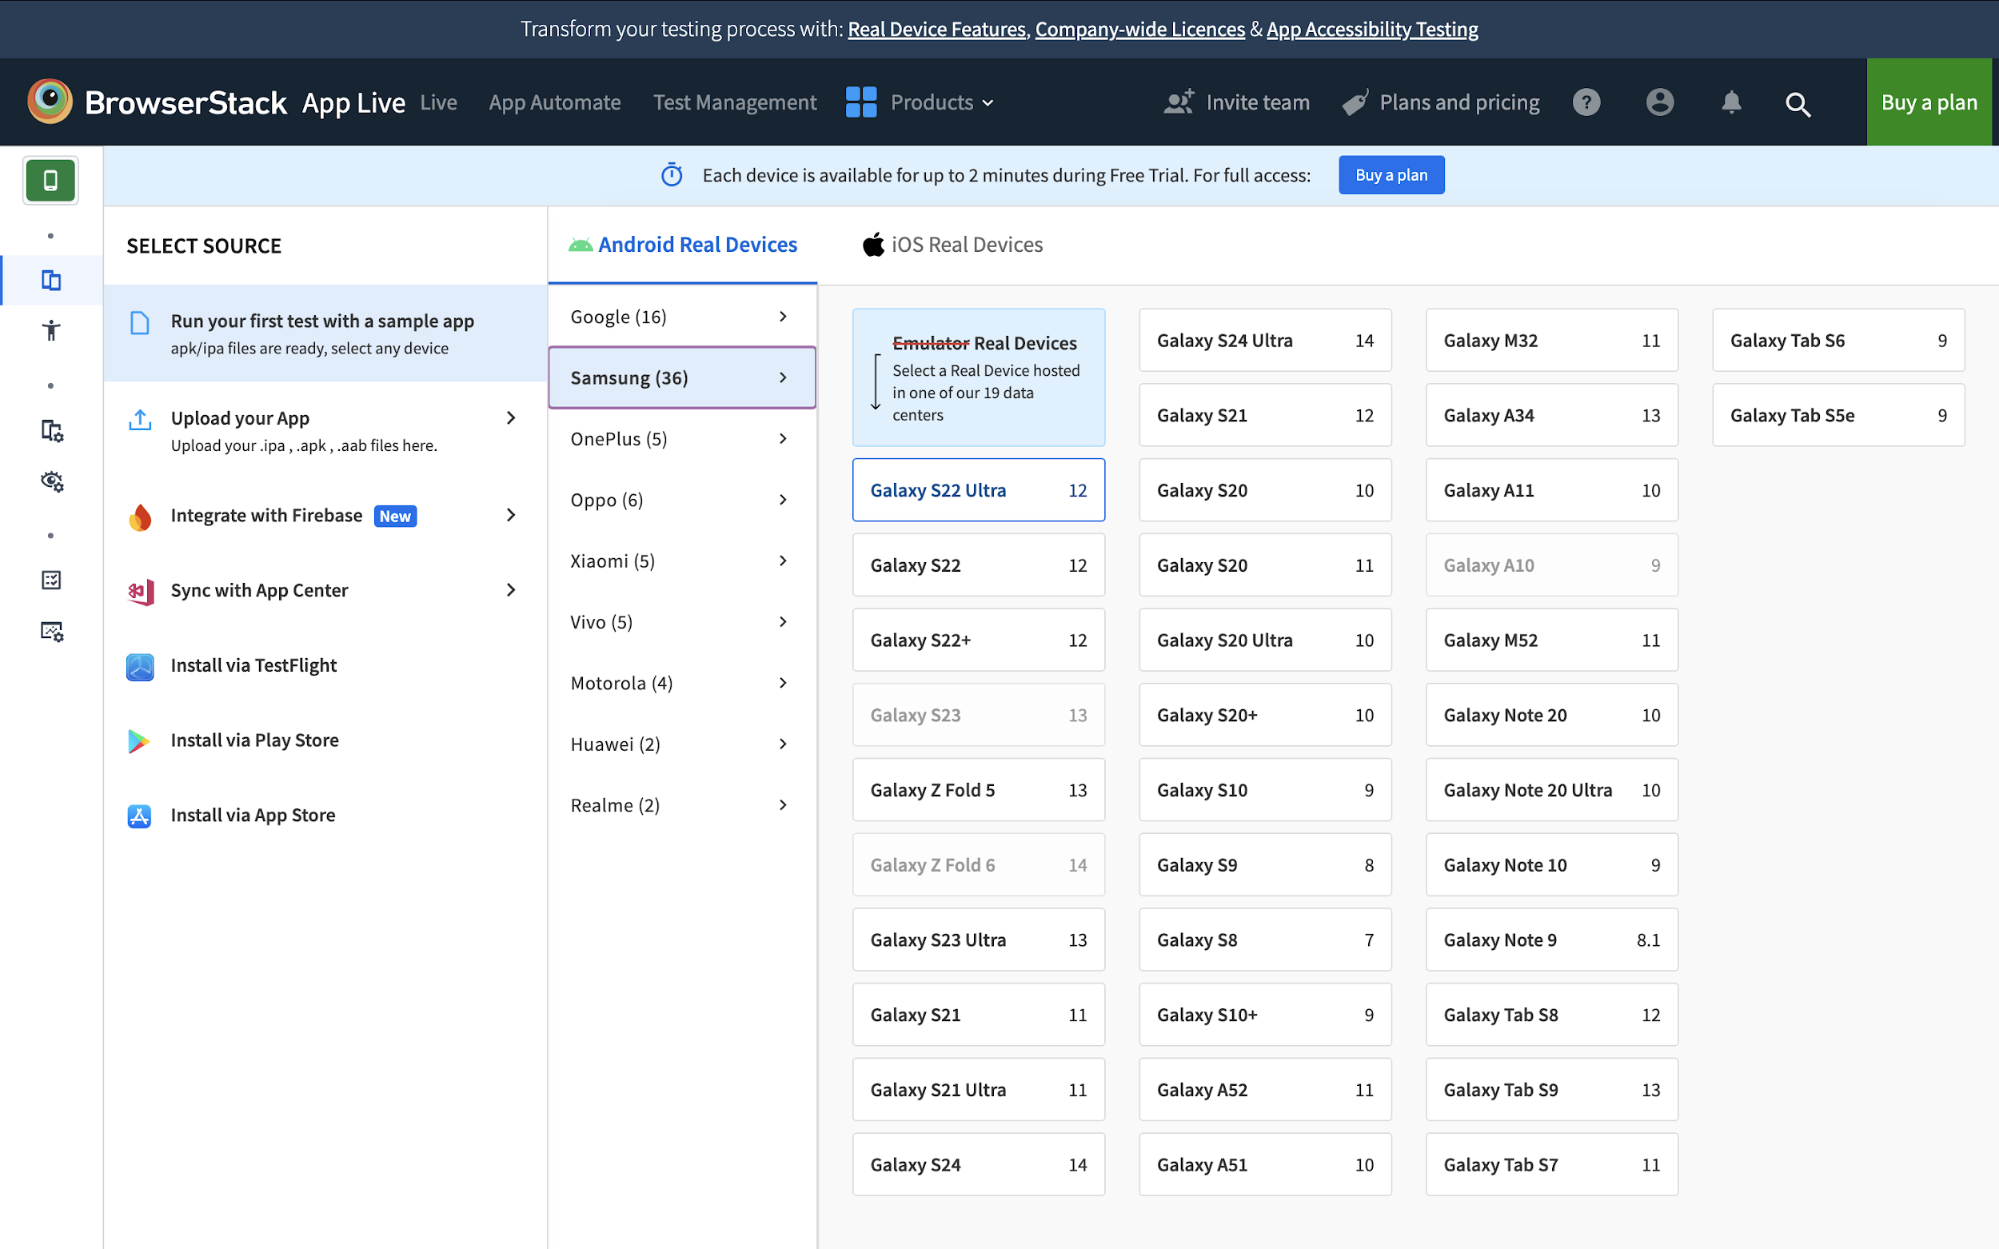
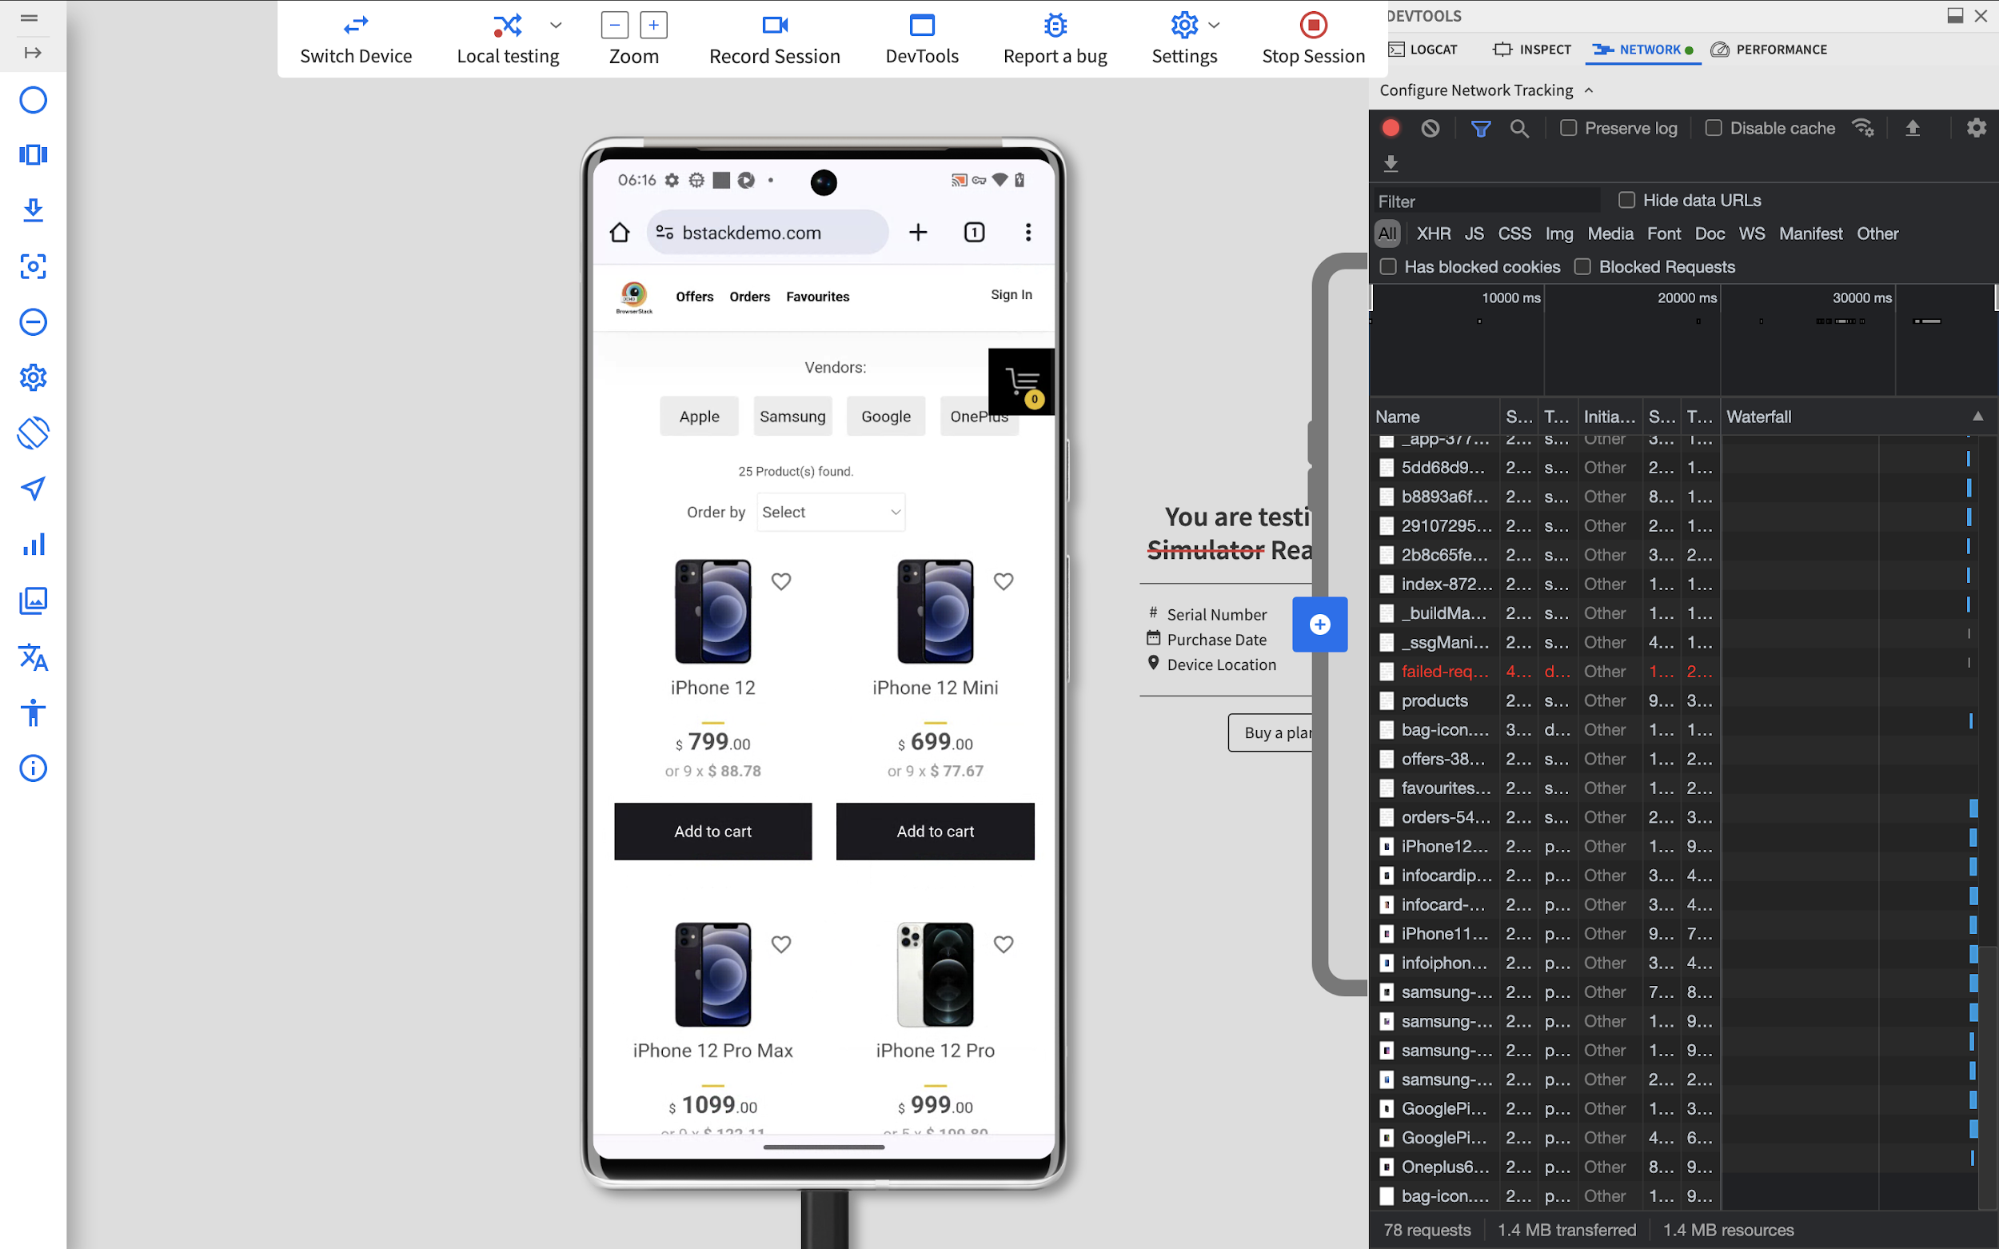
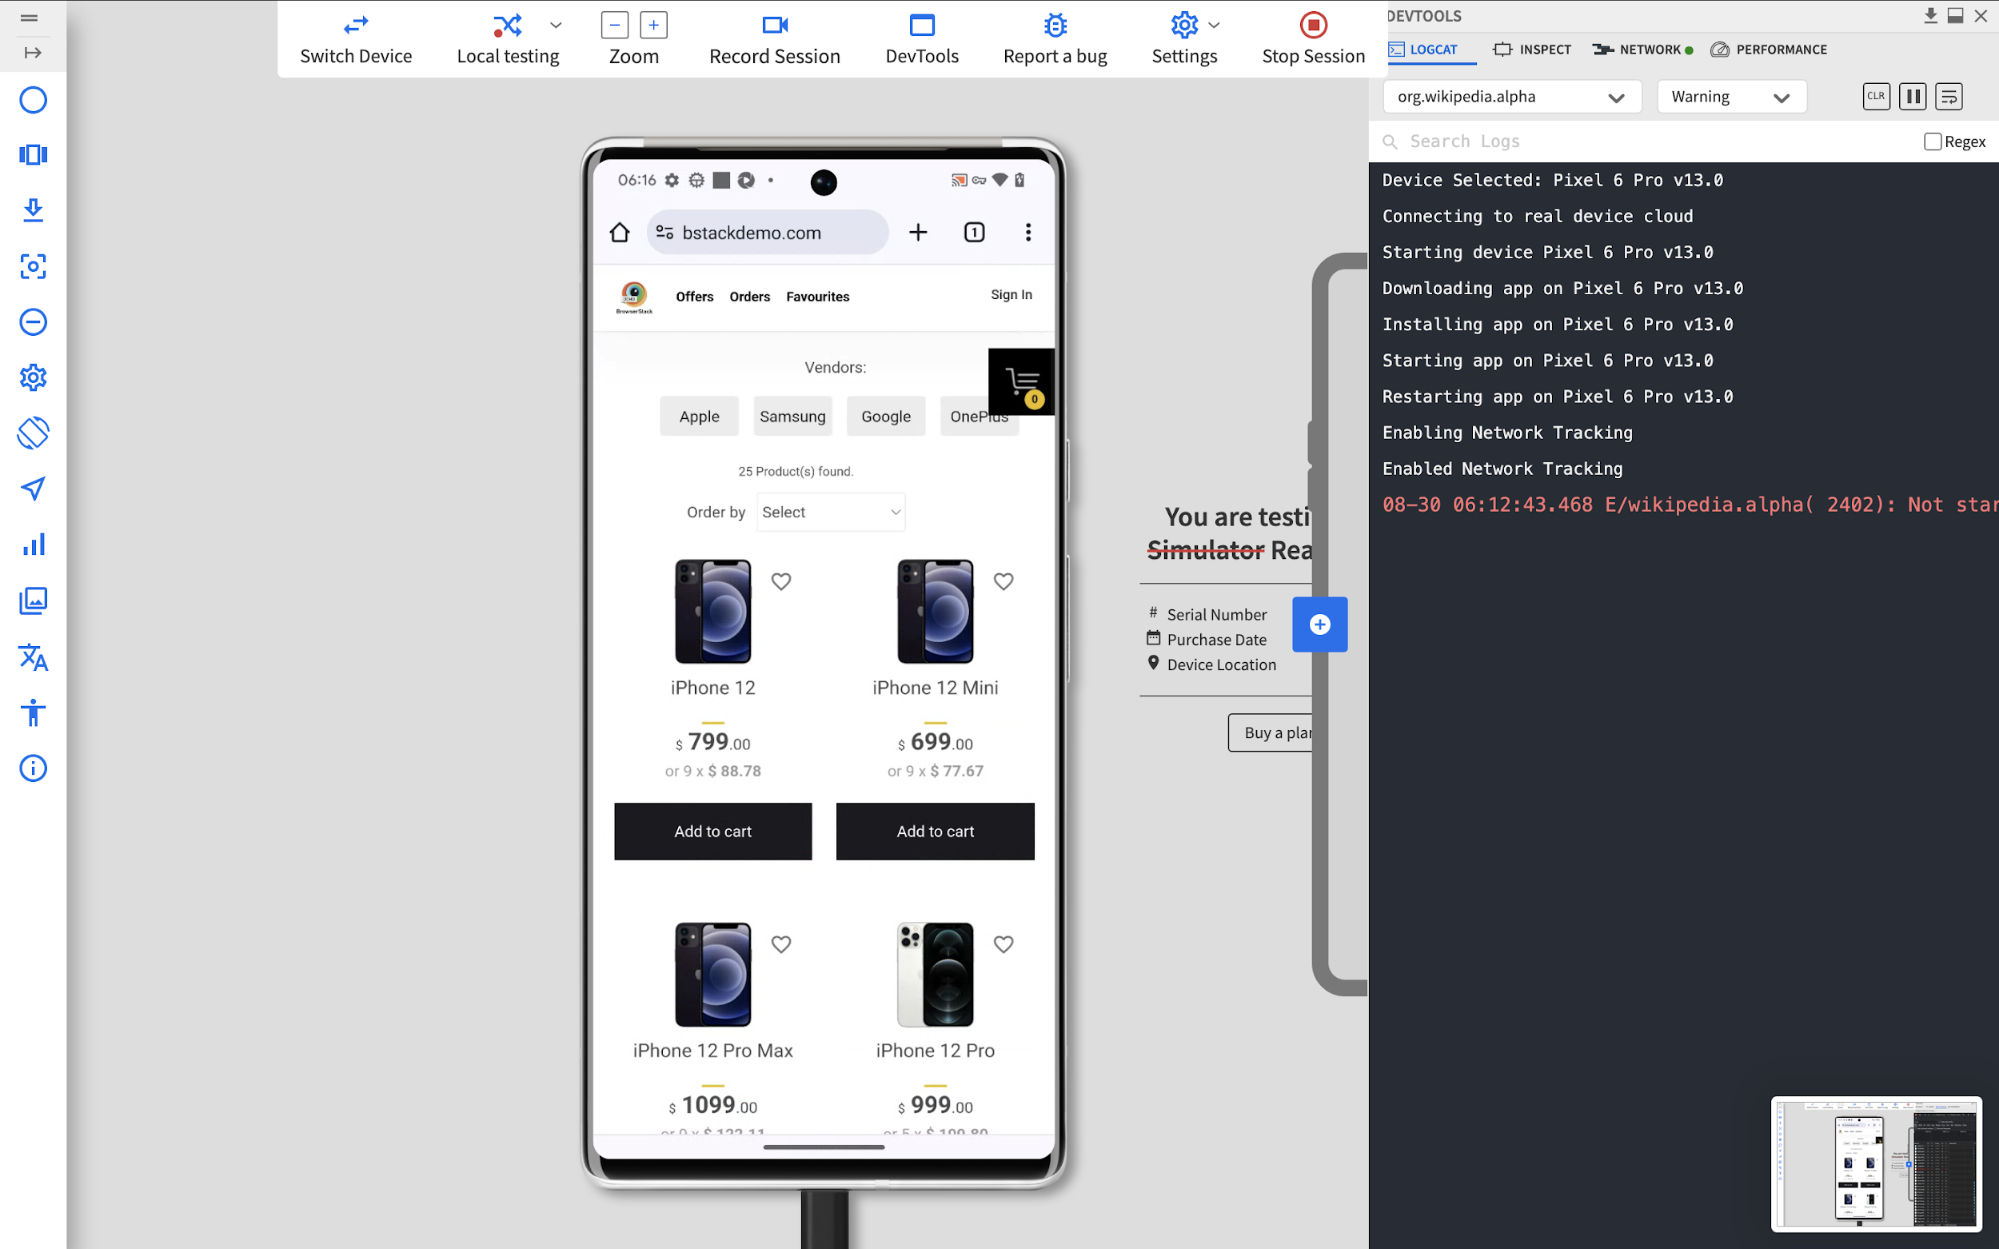
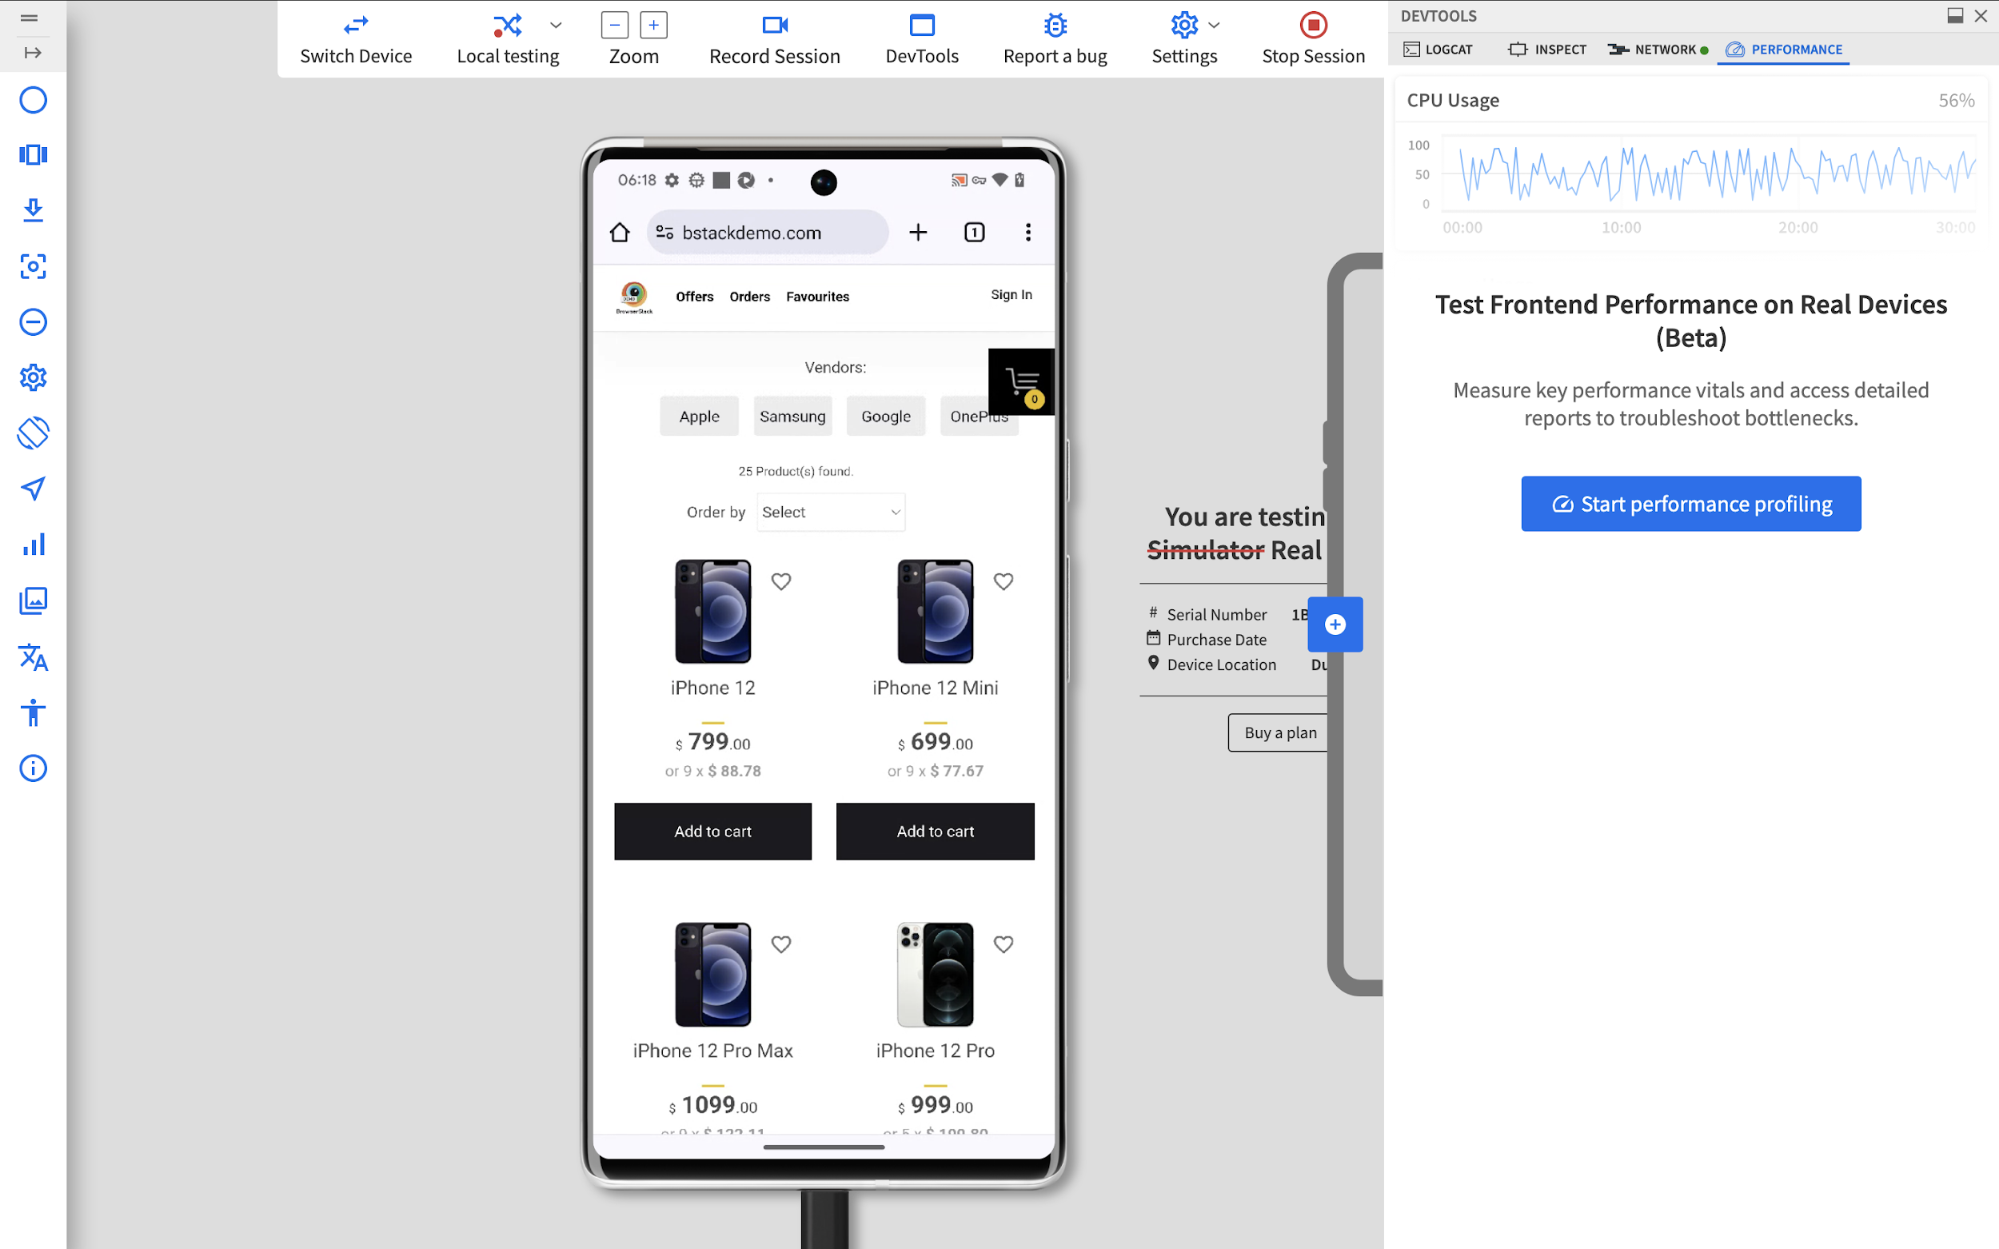
BrowserStack App Live enables manual testing and debugging of Android apps on real devices. Developers can interact with the app in real time, simulating user behavior, and debugging issues directly on different Android versions and device configurations. This tool supports live logs, network analysis, and visual testing to help identify and resolve app issues efficiently.
Key Features
- Manual testing on a wide range of Android devices and OS versions.
- Interactive debugging on real Android devices in the cloud.
- Real-time logs and network analysis for efficient debugging.
- Supports testing across different Android versions, screen sizes, and device models.
App Automate
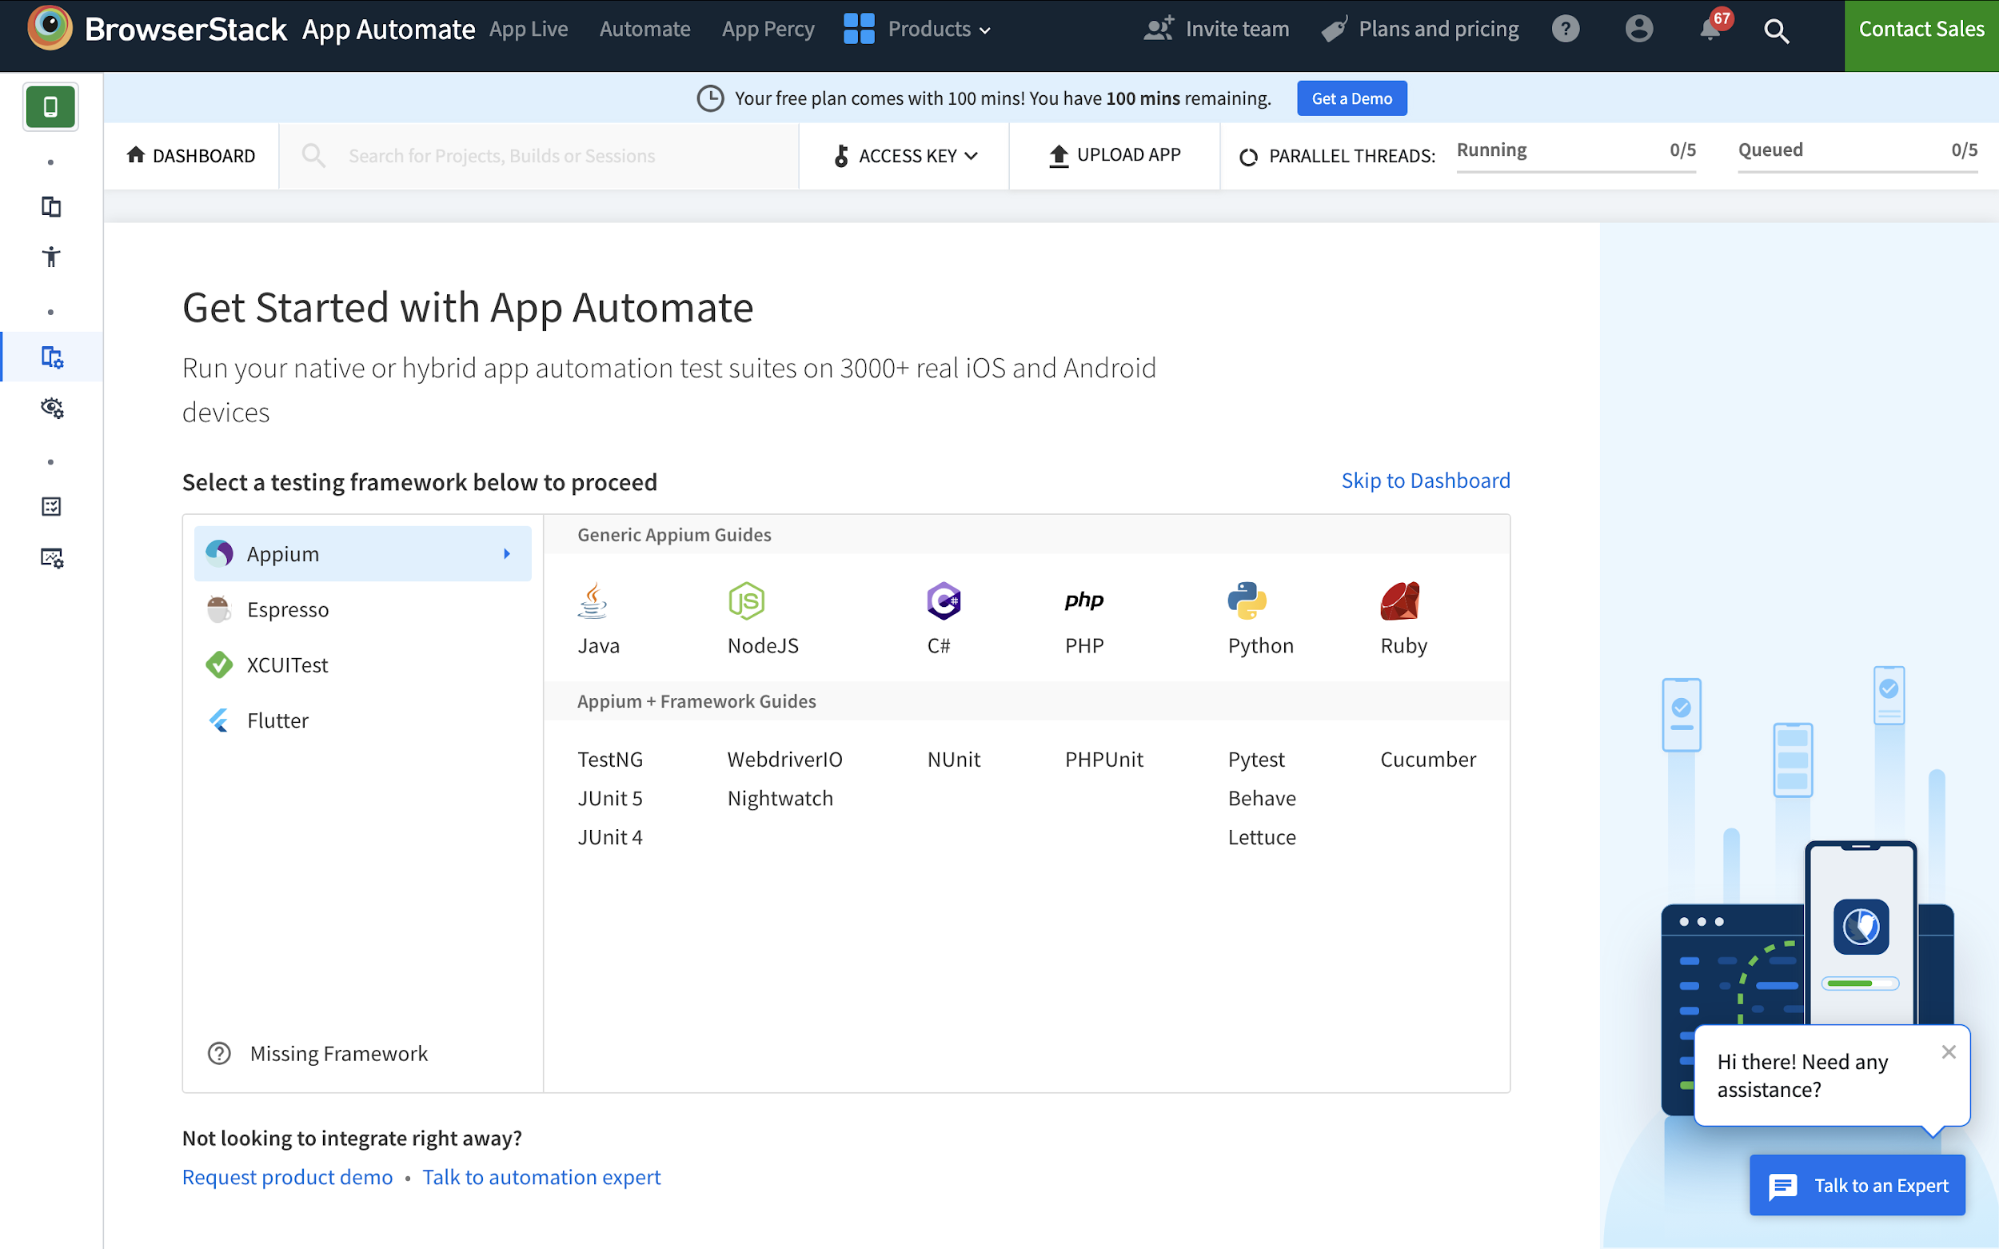
BrowserStack App Automate allows automated testing on a wide range of Android devices using popular frameworks like Appium, Espresso, and XCUITest. It helps developers run automated test scripts in parallel on multiple devices, significantly reducing testing time. With App Automate, debugging becomes faster and more scalable, enabling de
Key Features
- Automated parallel testing on multiple real Android devices to accelerate the debugging process.
- Allows remote ADB commands on real devices for advanced debugging and device control. For more, refer to this BrowserStack ADB documentation.
- Integration with popular IDEs and CI/CD tools like Jenkins, CircleCI, and GitHub Actions.
- Supports leading frameworks like Appium, Espresso, and XCUITest.
- Comprehensive test reports with logs, screenshots, and videos.
- Scalable testing for advanced scenarios like geolocation and background behavior.
BrowserStack is ideal for teams needing real Android devices for debugging and cross-browser testing. BrowserStack’s cloud platform ensures accurate, real-world testing without physical infrastructure, offering a scalable solution.
2. Android Studio
Android Studio is the official IDE for Android development, offering a comprehensive suite of debugging tools tailored for app development. It’s designed to streamline development and debugging through a variety of features and plugins.
Key Features:
- A flexible Gradle-based build system.
- A fast and feature-rich emulator.
- A unified environment where you can develop for all Android devices.
- Android Studio Debugger, Logcat, Layout Inspector and Profilers (Memory, CPU, Network)
- Inspect and debug SQLite databases within the app.
Pros:
- Free and tightly integrated with the Android development workflow.
- Comprehensive debugging capabilities for various aspects of an application.
Cons:
- Can be resource-intensive on lower-end machines.
- Debugging complex scenarios requires advanced knowledge.
Verdict: Android Studio is the go-to IDE for Android development, offering comprehensive debugging tools tightly integrated into the Android development workflow.
3. Eclipse
Although no longer officially supported by Google for Android development, Eclipse with the ADT plugin was once the go-to IDE for developers, especially for Java-based Android projects. Eclipse still has relevant debugging tools for legacy applications.
Key Features:
- Java Debugger: Supports breakpoints, variable inspection, and stepping through code.
- Logcat Integration: Similar to Android Studio, it allows real-time log monitoring.
- DDMS (Dalvik Debug Monitor Server): Provides insights into processes, threads, and heap memory. (Note: Android Device Monitor was deprecated in Android Studio 3.1 and removed from Android Studio 3.2. )
- Hierarchy Viewer: Enables UI inspection and layout debugging.
- Traceview: Visualizes method calls and CPU usage over time.
Pros:
- Familiar for developers who have used Eclipse for other Java projects.
- Might be lighter than Android Studio for older machines.
Cons:
- No longer officially supported for Android development.
- Lacks the latest features and updates provided by Android Studio.
Verdict: Not recommended for new projects, but still relevant if maintaining legacy applications developed with Eclipse.
4. Zipy
Zipy is a user experience-focused, app performance and metrics monitoring tool that can help identify and debug performance bottlenecks in real-time, especially for web or hybrid apps.
Key Features:
- Real-time performance monitoring of memory, network, and battery usage.
- Detailed method tracing to identify performance bottlenecks.
- Network request inspection and analysis.
- Customizable alerts for performance thresholds.
- Web dashboard, user session recording, and analysis.
Pros:
- SDK for easy integration with popular development frameworks.
- Provides actionable insights to improve app responsiveness.
Cons:
- Its Android SDK is awaiting full release as of date.
- The free tier has limited features compared to paid plans.
Verdict: This is suitable for teams working on hybrid apps that want to debug app behavior remotely on a user’s device. The Native Android SDK is still in early bird access mode.
5. Firebase Crashlytics
Firebase Crashlytics is a real-time crash reporting tool that helps identify and diagnose crashes in Android apps. Part of the Firebase Suite and Google Cloud platform, it offers a comprehensive set of tools for cross-platform App developers.
Key Features:
- Automatic crash reporting with AI integration, detailed stack traces and device information.
- Crash clustering to group similar crashes and prioritize debugging efforts.
- Custom logging to capture additional context around crashes.
- User identification to track crashes affecting specific users.
- Integration with other Firebase services for enhanced monitoring.
Pros:
- Flexible pay-as-you-go plan and easy to integrate with Android apps.
- Provides valuable insights into app stability and crash patterns.
Cons:
- Relies on users opting in to share crash data.
- Debugging complex crashes might require additional tools.
Verdict: Good for any Android app to monitor crashes, understand their impact, and prioritize fixes, especially for users of the Google Cloud.
6. Selendroid
Selendroid is an open-source test automation framework designed for Android apps, often called Selenium for Android. It enables automated testing of both native and hybrid apps by simulating user interactions on real devices or emulators. Selendroid supports testing of Android UI elements and web views, making it versatile for different app types.
Key Features:
- Automates user interactions on Android devices for testing and debugging purposes.
- Supports native Android views and web views for hybrid app testing.
- Provides an API to write test scripts in Java and other languages.
- Integrates with testing frameworks like TestNG and Junit.
- Allows for testing on real devices and emulators.
Pros:
- Open-source and free to use.
- Enables automated UI testing and debugging.
Cons:
- Setting up and writing test scripts can have a learning curve.
- Might not be as feature-rich as some commercial automation tools.
Verdict: Suitable for developers who want to automate UI testing and debugging as part of their development process and have working knowledge of Selenium.
Read More: How to start with Selenium debugging
7. Appium
Appium is an open-source automation framework that acknowledges Selenium and adds support for various platforms and programming languages, including Android. It’s widely used for UI testing and can be adapted for debugging purposes.
Key Features:
- Cross-platform testing support for Android with drivers and plug-ins.
- Supports multiple programming languages for writing test scripts.
- Can interact with page elements like Selenium.
- Integration with various testing frameworks.
- Allows automation on real devices and emulators.
Pros:
- Open-source and has a large active community.
- Provides a unified framework for testing across multiple platforms.
Cons:
- Can have a steeper learning curve for beginners.
- Setting up and configuring Appium can be complex.
Verdict: A great choice for teams working on cross-platform apps or requiring a flexible framework for automation, testing, and debugging in scenarios including different device/code environments.
Read More: How to perform debugging in Appium
8. Smartlook
Smartlook is a user behavior analytics tool designed to provide insights into how users interact with mobile and web apps. It enables developers and product teams to analyze user actions through session recordings and heatmaps, helping identify UX issues and optimize app performance.
Key Features:
- Session recordings to replay user interactions and identify UI/UX issues.
- Heat maps to visualize user behavior and identify areas of interest.
- Event tracking to monitor specific user actions within the app.
- Crash reporting with basic information about crashes.
- User segmentation to analyze user behavior based on demographics or actions.
Pros:
- Great for tracking user behavior around conversion and sales.
- It offers a free plan for beginners and customizable enterprise packages.
Cons:
- Primarily focuses on qualitative analytics rather than traditional debugging.
- Might require additional tools for in-depth technical debugging.
Verdict: Useful for understanding user behavior, identifying UI/UX bottlenecks, and gathering insights to improve the overall app experience and conversion prospects.
9. UXCam
UXCam is a mobile app analytics platform focusing on user behavior insights and optimization of experience. UXCam’s tools are designed to identify UX bottlenecks, enhance user flows, and improve overall app performance by providing detailed insights into how users engage with different app features.
Key Features:
- Session recordings with user interaction data.
- Heat maps to visualize user engagement on specific screens.
- Event tracking and funnel analysis to understand user flows.
- Issue reporting for capturing user feedback and bug reports.
- A/B testing to compare different versions of app features.
Pros:
- Strong focus on user experience optimization.
- Provides insights into user behavior and pain points.
Cons:
- Might not be suitable for traditional code-level debugging.
- Requires integration with analytics and event tracking systems.
Verdict: A valuable tool for product managers and UX designers to understand user behavior and optimize the app for better engagement and conversions.
10. UserExperior
UserExperior is a mobile app analytics tool specializing in user journey analysis and experience optimization. It offers features like session recordings and user journey tracking to help product teams understand user behavior and identify pain points.
With additional capabilities like crash and error reporting, UserExperior provides valuable insights to improve app usability and engagement while supporting feedback and defect resolution workflows.
Key Features:
- Session recordings with detailed user interaction data.
- Heat maps to visualize user activity on different app screens.
- User journey analysis to identify common paths and drop-off points.
- Crash and error reporting with basic information.
- Integrations with analytics and user feedback tools.
Pros:
- Specialized in user experience monitoring and optimization.
- Helps identify usability issues and improve app engagement.
Cons:
- Not a dedicated debugging tool for technical issues.
- Might require additional tools for in-depth code analysis.
Verdict: Most suitable for product teams understanding and optimizing the business experience along with support and defect resolution workflows.
11. New Relic
New Relic is a comprehensive application performance monitoring (APM) tool that provides deep insights into app performance, including mobile applications.
Key Features:
- Real-time performance monitoring of key metrics like response time, error rate, and resource consumption.
- Distributed tracing to follow requests across different services and identify bottlenecks.
- Error tracking and alerting to proactively address issues.
- User segmentation and custom dashboards to monitor performance for specific user groups.
- Integration with various other tools and platforms.
Pros:
- Provides a holistic view of app performance across different layers.
- Offers advanced features for monitoring and optimizing complex applications.
Cons:
- Can be costly for large-scale applications.
- Steeper learning curve compared to more specialized tools.
Verdict: Ideal for teams requiring comprehensive application performance monitoring, especially for complex applications with multiple services or microservices.
Read More: Mobile App Performance Monitoring Tools
12. Instabug
Instabug is a comprehensive bug reporting and feedback management tool designed for mobile apps. It allows users to report bugs in-app with detailed information such as screenshots, annotations, and device data.
Instabug also offers crash reporting with stack traces and contextual data, as well as user feedback collection through surveys and feature requests.
Key Features:
- In-app bug reporting with screenshots, annotations, and device information.
- Crash reporting with stack traces and contextual data.
- User feedback collection through surveys, feature requests, and in-app chats.
- Integration with project management and bug-tracking tools.
- Customizable bug reporting workflows.
Pros:
- Streamlines the bug reporting process and makes it easier for users to provide feedback.
- Provides a unique set of tools to capture feedback and issue summaries.
Cons:
- Limited technical depth in some features can be restrictive in edge cases.
- Pricing could be steep for beginners.
Verdict: A great tool for gathering user feedback, identifying bugs, and improving app quality through a user + release-centric approach.
Read More: How to write an effective bug report
13. Bugsee
Bugsee is a mobile app debugging tool that automatically captures video recordings of user sessions leading to crashes or issues. This gives developers valuable visual context for debugging, along with crash reports, network logs, and console logs.
Key Features:
- Video recording of user sessions, capturing interactions, network logs, and console logs.
- Crash and exception reporting with stack traces and device information.
- User feedback collection through in-app bug reports.
- UI debugger for checking visual elements in-app events.
- Integration with popular bug tracking and project management tools.
Pros:
- Provides valuable visual context for debugging by showing exactly what happened before a crash.
- Reduces the need for users to provide detailed bug reports.
Cons:
- Data sharing limits applicability to sensitive app categories.
Verdict: A powerful tool for debugging crashes and understanding user behavior in the moments leading up to an issue, especially for applications where visual context is crucial.
What are the most Common Issues in Android Debugging?
Here are the most common issues in Android debugging:
- Code Exceptions: Occurs when improper coding causes the app thread to throw exceptions.
- Memory Leaks: This happens when objects are no longer needed but are not garbage collected, leading to increased memory consumption.
- Layout Issues: Problems with UI elements not displaying correctly, overlapping, or being cut off.
- Network Connectivity Issues: Errors related to network requests, such as timeouts, connection errors, or incorrect data formatting.
- Concurrency Issues: Problems arising from multiple threads accessing or modifying shared resources simultaneously.
- Performance Bottlenecks: Slow app performance caused by inefficient code, excessive resource consumption, or other factors.
How to choose an Android Debugging Tool?
The choice of the right Android debugging tool here depends on several factors:
- Debug Target: The specific area to be debugged, like the UI, network, or some part of App behavior. Cannot choose a tool without having a clear target for debugging.
- Team Expertise: Choose tools that align with the team’s skills and experience.
- Integration: Ensure compatibility and seamless integration with existing development tools and workflows.
- Budget: Consider free and open-source options and paid tools with advanced features.
- Scalability: Select tools that can scale with the app’s growth and complexity.
How to Debug using BrowserStack App Live and App Automate?
BrowserStack offers App live and App Automate for testing Android Apps on real Android devices, covering manual and automation testing.
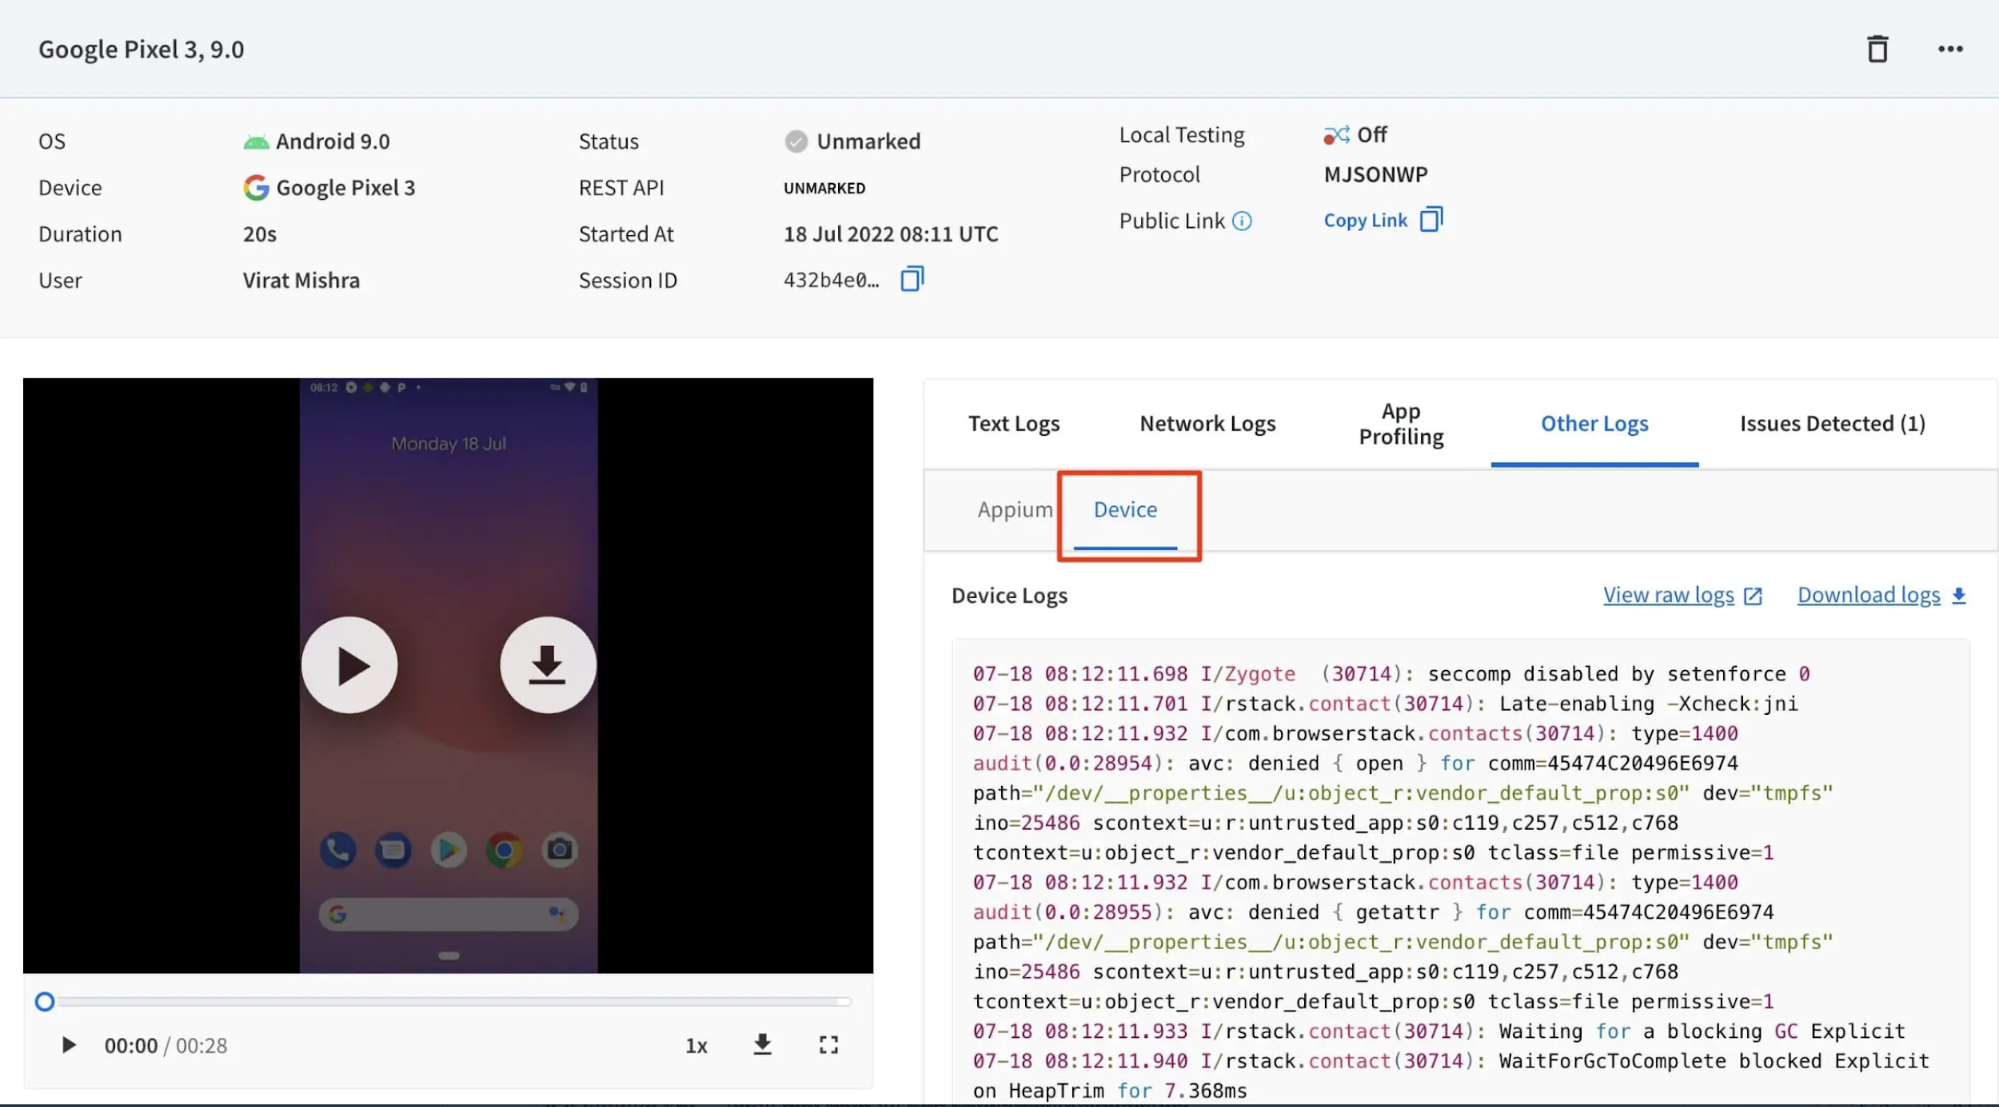
These tools can be used to debug Android apps. They offer system insights like logcat traces, UI layout inspectors, and control over device features, giving you full access to the real device over the internet.
Get started with a free account or a plan depending on your needs.
App Live:
Here are the steps in brief to get you started with debugging on App Live.
Step 1: Upload your app to BrowserStack.
Step 2: Select a real Android device from the device cloud.
Step 3: Launch your app in the App Live Dashboard.
Step 4: Use the interactive debugging tools.
App Automate:
To debug using App Automate, you need to write automation test scripts and integrate them with BrowserStack SDK. Then, you can access the system information for debugging on the BrowserStack Dashboard.
Step 1: Write test scripts using Appium or other supported frameworks.
Step 2: Configure your test scripts to run on BrowserStack’s Android device cloud.
Step 3: Execute your tests and analyse the results to identify and debug issues.
Conclusion
Effective debugging is crucial for developing high-quality Android apps. By leveraging the right combination of Android debugging tools, developers can streamline identifying, diagnosing, and resolving issues, ultimately improving app stability, performance, and user satisfaction.
By using BrowserStack App Live and App Automate for debugging Android apps, developers can capture visual recordings of app behavior and other system-level details, enabling them to precisely debug issues at scale.
Combined with the ability to automate testing, select multiple devices, and exclusive debugging features, BrowserStack is a must-have end-to-end Android App Debugging platform for ensuring app quality.
