Jest is a powerful JavaScript testing framework designed to streamline application testing. It integrates seamlessly with most projects and offers advanced features like mocking, code coverage, and snapshot testing.
Debugging Jest tests is crucial for identifying and fixing issues and ensuring your code functions as expected.
This guide covers effective debugging techniques to improve Jest test accuracy and efficiency.
What is Jest?
Jest is a popular JavaScript testing framework Meta (formerly Facebook Open Source) developed. It is well-suited for testing React applications—Babel, TypeScript, Node, Angular, Vue, etc.
- Jest plays a vital role in JavaScript testing by providing a robust and feature-rich framework that simplifies the process of writing tests.
- It encourages test-driven development to ensure the reliability and quality of JavaScript applications, particularly those built with React.
Must Read: VueJS vs AngularJS: Core Differences
Role of Jest in JavaScript Testing
Here’s an overview of Jest and its role in JavaScript testing:
- Comprehensive Testing: Jest provides comprehensive features for testing JavaScript code, including unit tests, integration tests, and end-to-end tests.
- Inbuilt assertion Functions: Jest provides its own assertion functions and error reporting mechanisms that allow you to write tests and handle failures effectively. Some commonly used Jest functions include expect, describe, test, and various matchers like toBe, toEqual, and toThrow.
- Simplicity and Ease of Use: Comes pre-configured with sensible defaults. allowing you to start writing tests without spending time on complex setup or configuration.
- Snapshot Testing: One of its notable features is Jest snapshot testing which allows you to capture the rendered output of a component or the JSON representation of an object and store it as a reference snapshot.
- Mocking and Spies: Provides powerful mocking capabilities that allow you to isolate your tests and simulate different scenarios.
- Fast and Parallel Test Execution: Optimizes test execution time through intelligent test parallelization, resulting in faster overall test execution.
- Code Coverage Analysis: It generates detailed reports that show which parts of your code are covered by tests and identifies areas that lack coverage.
- Integration with React: Seamlessly integrates with React and provides additional utilities for testing React components like shallow rendering.
Understanding Common Issues in Jest Testing
When working with Jest testing, developers may encounter several common issues. These issues can occur when writing test cases, configuring Jest, or running tests.
- Test Failures: Test failures can occur due to incorrect assertions, unexpected behavior in the code being tested, or issues with the test setup. In a test failure analysis, It’s important to carefully review the failing test, check for errors or exceptions in the code, and verify that the test expectations are correctly defined.
- Mocking Dependencies: When writing unit tests, it’s common to mock dependencies, but setting up mocks correctly can be challenging., especially when dealing with complex dependencies or asynchronous code.
- Asynchronous Testing: Asynchronous testing can be tricky, as Jest requires special handling for promises, async/await functions, and timers. Use the appropriate Jest functions like async/await, done, and waitFor to handle asynchronous code properly.
- Configuration Issues: Jest has various configuration options, such as test environment setup, test file patterns, code coverage settings, and more. Double-check your Jest configuration, including the jest.config.js file, to ensure it aligns with your project’s requirements.
How to Debug Jest Tests?
Debugging is the process of finding and resolving errors in your tests. Jest offers multiple methods to help debug your code effectively:
1. Use console.log(): Add console.log() to your code to print values and check the flow of execution.
2. Insert a debugger Statement: Place debugger in your code, then run Jest in debug mode to pause execution and inspect variables.
3 .Debug with VSCode: Use Visual Studio Code’s debugging tools to pause and inspect code with breakpoints.
Read More: Top 20 Best VS-Code Extensions
4. Debug with IntelliJ IDEA: IntelliJ provides an easy-to-use debugger to inspect code while running Jest tests.
5. Use Jest Flags: Run Jest with helpful flags like:
- —inspect to attach a debugger.
- —watch to automatically re-run tests when changes are made.
6. Third-party Tools: Cloud platforms like BrowserStack allow you to debug Jest tests across real browsers and devices, simplifying cross-browser testing.
How to Debug Jest Tests with VSCode?
Debugging Jest tests in VSCode involves setting up a debug configuration to run your test cases directly from the IDE.
Step 1: Set up Jest in your project
- Ensure Jest is installed and configured in your project.
- If not, run the following command:
npm install --save-dev jest
Step 2: Add a Debug Configuration
- Open the Run and Debug view (Ctrl+Shift+D).
- Click on create a launch.json file.
- Select Node.js and replace the configuration with:
{

  "type": "node",

  "request": "launch",

  "name": "Debug Jest Tests",

  "program": "${workspaceFolder}/node_modules/jest/bin/jest.js",

  "args": ["--runInBand"],

  "console": "integratedTerminal",

}
Step 3: Set Breakpoints
Open your test file and click on the line number where you want the execution to pause.
Step 4: Run the Debugger
Select the “Debug Jest Tests” configuration.
Click the play button or press F5 to start debugging.
Read More: Xcode vs VSCode: Everything you need to know
How to Debug Jest Tests in IntelliJ?
IntelliJ IDEA allows seamless debugging of Jest tests with its integrated debugging tools.
Step 1: Set up Jest in your project
Install Jest via npm or yarn and configure it in your package.json file.
Step 2: Create a Jest Configuration
- Go to Run > Edit Configurations.
- Click + and select Jest.
- Specify the Jest binary path and working directory.
Step 3: Set Breakpoints
Open your test file and click next to the line numbers to set breakpoints.
Step 4: Run Debug
- Select the Jest configuration from the dropdown menu.
- Click the debug icon to start debugging. The debugger will stop at breakpoints for inspection.
How to debug Jest Tests Using BrowserStack?
To debug Jest tests effectively on BrowserStack below are some pre-requisites followed by a step-by-step guide on how to execute and debug Jest tests on the real device cloud.
Prerequisites:
- You must have a BrowserStack Username and Access Key, which can be found in your account profile. If you still need to do so, you can sign up first.
- Node v12+ is installed on your machine.
- Any IDE to write and edit your JavaScript code (eg. VS Code, Atom, IntelliJ, etc.)
1. Configuring Jest for Debugging with BrowserStack
Integrating Jest with BrowserStack’s Selenium Grid allows you to run Jest tests on multiple browsers and platforms on a cloud infrastructure.
To integrate Jest with BrowserStack, follow these general steps:
1. Create a new folder and open it using your IDE.
2. Set up Jest in your project by initializing a new npm package and installing Jest as a dev dependency.
Run the following commands in your project’s root directory:
npm init -y

npm install --save-dev jest
3. Jest requires a WebDriver implementation to communicate with the Selenium Grid. Install the Selenium WebDriver package as a dev dependency using npm.
npm install --save-dev selenium-webdriver
4. Install the necessary dependencies for running Jest tests with BrowserStack.
You’ll need the browserstack-node-sdk, which can be installed using the below command:
npm i -D browserstack-node-sdk@latest
5. Use the following command to create a browserstack.yml file in the root directory of your project and configure your access credentials:
npx setup --username your-username --key your-key
The auto-generated browserstack.yml file in the root folder of your project contains all of the settings required to run tests on BrowserStack.
1. Set platforms to test on
Set the browsers and devices you want to test under the platforms object. Our config follows W3C formatted capabilities.
Run the script on the below configs:
platforms:

  - os: OS X

    osVersion: Big Sur

    browserName: Chrome

    browserVersion: latest

  - os: Windows

    osVersion: 10

    browserName: Edge

    browserVersion: latest
2. BrowserStack Reporting
You can use the following capabilities to take advantage of BrowserStack’s broad reporting features:
projectName: BrowserStack Tutorial

buildName: bstack demo

buildIdentifier: '#${BUILD_NUMBER}
3. Enable Debugging features
BrowserStack includes prettified session logs, screenshots of every unsuccessful Selenium command, and a video of the full test by default.
You can enable the following features:
debug: true # Set to true if you need screenshots for every selenium command ran

networkLogs: true # Set to true to enable HAR logs capturing

consoleLogs: info # Remote browser's console debug levels to be printed
Now your framework is ready. You can create a new JavaScript file and add a script as per your requirement.
The sign-in process will be demonstrated on BrowserStack Demo Website in two examples.
- The first Jest debugging example one will cover the execution Locally
- In the Second Jest debugging example automate the same flow to run it on BrowserStack.
2. Running Jest Tests Locally
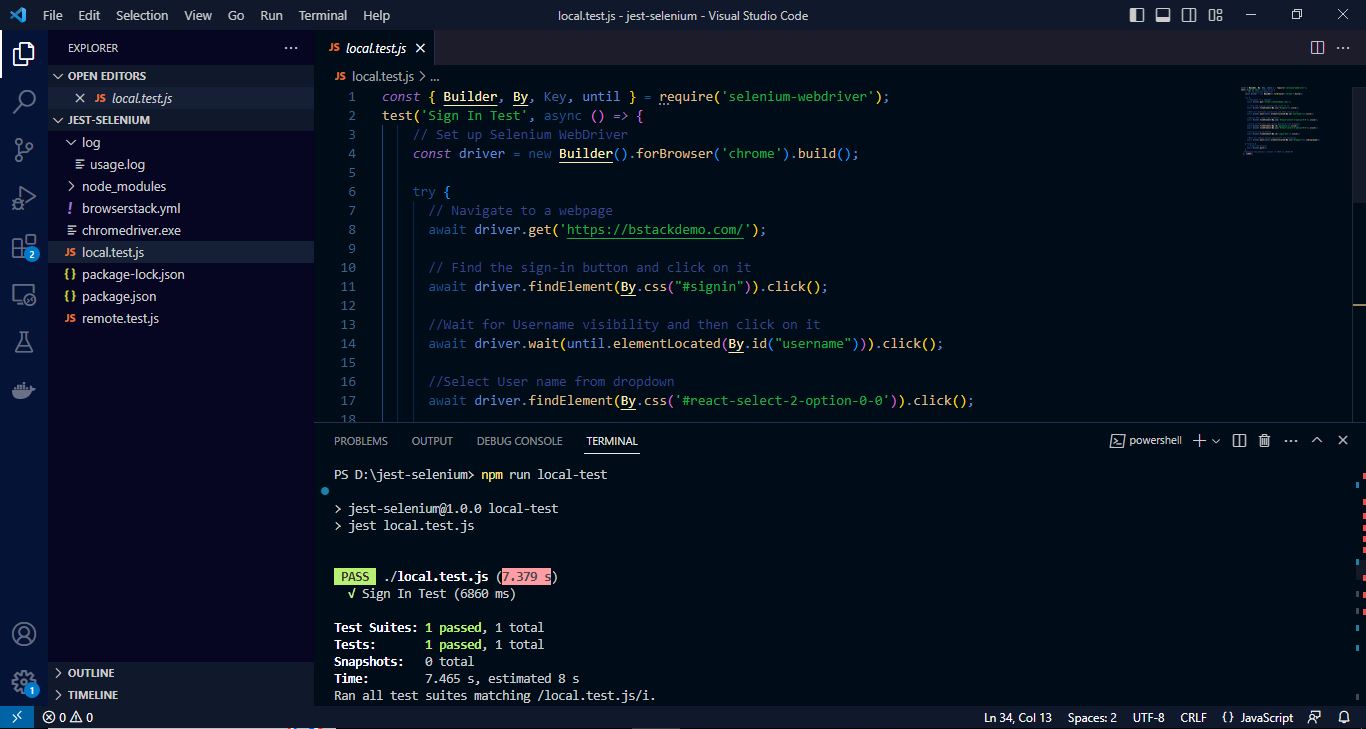
For running your test script locally. You must download and add the desired driver to the project root directory. You can quickly get that from the official websites Chrome, Firefox, Safari, and Microsoft Edge. Chrome WebDriver is used for this example.
First, add a new js file in <name>.test.js format (eg. local.test.js). And will write our test script as per our test case.
const { Builder, By, Key, until } = require('selenium-webdriver');

test('Sign In Test', async () => {

    // Set up Selenium WebDriver

    const driver = new Builder().forBrowser('chrome').build();

    try {

      // Navigate to a webpage

      await driver.get('https://bstackdemo.com/');

      // Find the sign-in button and click on it

      await driver.findElement(By.css("#signin")).click();

      //Wait for Username visibility and then click on it

      await driver.wait(until.elementLocated(By.id("username"))).click();

      //Select User name from dropdown

      await driver.findElement(By.css('#react-select-2-option-0-0')).click();

      //Click on Password and select password from the Dropdown

      await driver.findElement(By.id('password')).click();

      await driver.findElement(By.css('#react-select-3-option-0-0')).click();

      //Click on Log In Button

      await driver.findElement(By.id('login-btn')).click();

      //Wait for logout button and assert its visibility

      await driver.wait(until.elementLocated(By.css("#logout"))).isDisplayed();

    } finally {

      // Close the browser

      await driver.quit();

    }

  });
To run that test script modify the scripts part in package.json file as per that snippet:
"scripts": {

    "local-test": "jest filename"

  }
By using the below command our test case will be executed:
npm run local-test
You will see the result in the terminal.
3. Connecting Jest to BrowserStack for Remote Debugging
The test script above executes on a local browser to execute the same test remotely on BrowserStack.
Let’s create another test file remote.test.js and understand the code changes step by step.
const { Builder, By, Key, until, Capabilities } = require("selenium-webdriver");

describe("BStack demo", () => {

  let driver;

  beforeAll(() => {

    driver = new Builder()

      .usingServer(`http://localhost:4444/wd/hub`)

      .withCapabilities(Capabilities.chrome())

      .build();

  });


  test('Sign In Test', async () => {


    try {

      // Navigate to a webpage

      await driver.get('https://bstackdemo.com/');

      // Find the sign-in button and click on it

      await driver.findElement(By.css("#signin")).click();

      //Wait for Username visibility and then click on it

      await driver.wait(until.elementLocated(By.id("username"))).click();

      //Select User name from the dropdown

      await driver.findElement(By.css('#react-select-2-option-0-0')).click();

      //Click on Password and select password from Dropdown

      await driver.findElement(By.id('password')).click();

      await driver.findElement(By.css('#react-select-3-option-0-0')).click();

      //Click on Log In Button

      await driver.findElement(By.id('login-btn')).click();

      //Wait for the logout button and assert its visibility

      await driver.wait(until.elementLocated(By.css("#logout"))).isDisplayed();

    } finally {

      // Close the browser

      await driver.quit();

    }

  //Changing the default timeout of 5000 to 10000 MS

  }, 120000);

});
To add the script to run the remote-test, update the package.json file as shown below:
"scripts": {

    "remote-test": "browserstack-node-sdk jest filename",

    "postinstall": "npm update browserstack-node-sdk",

    "local-test": "jest local.test.js"

  },
To run that test case, use the below command and your test case will execute on BrowserStack:
npm run remote-test
You can see the result on BrowserStack Dashboard:
- Here, the same test case is executed on two different configurations. Once the test execution is complete, you can view the test results in your BrowserStack Automate dashboard. It provides detailed information about the test runs, including logs, screenshots, and video recordings.
- As you can see in the above example, almost zero code changes were done to run the script on Remote.
- Also, Broswerstack SDK enabled easy configuration on real devices and browsers, parallelization, and execution on localhost.
4. Inspecting Test Execution in Real Browsers and Devices
BrowserStack allows you to run your Jest test suite on real browsers and devices, providing detailed logs, screenshots, and video recordings. These resources are invaluable for debugging and identifying the cause of any failures or inconsistencies.
By leveraging BrowserStack’s extensive browser matrix and device matrix, you can test your Jest tests across various platforms, including popular browsers, operating systems, and mobile devices.
How to Run Failed Test Cases in Jest
Jest can rerun only the failed test cases using the –onlyFailures flag.
Step 1: Run All Tests
Run your test suite using the following command:
jest
Or, if you’re using npm:
npm test.
Step 2: Identify Failed Tests
Jest automatically tracks failed tests in its cache.
Step 3: Rerun Failed Tests
Use the following command to rerun only failed tests:
jest --onlyFailures
Note: This command will automatically find and rerun only those tests that failed in the previous run.
Read More: How to write Test Cases in Software Testing?
Debugging Jest Tests with BrowserStack Test Observability
BrowserStack Test Observability enhances Jest test debugging by providing comprehensive insights and real-time reporting. It consolidates all debugging tools into a single platform, making issue detection and resolution faster and more efficient.
- Identify Failures Instantly: ML-driven failure categorization helps pinpoint whether issues stem from the product, automation, or environment.
- Comprehensive Log Access: View framework logs, video recordings, screenshots, terminal outputs, network requests, and application logs—all in one place.
- Analyze Test Suite Health: Built-in dashboards provide key metrics like test stability and flakiness, helping maintain reliable test execution.
Try BrowserStack Test Observability
Useful Resources for Jest
- Understanding Jest Mock Hook
- How to Configure Jest
- it.each function in Jest
- Snapshot Testing with Jest
- How to write Snapshot Tests for React Components with Jest?
- How to Run Jest Tests for a Specific File/Folder
- Jest Framework Tutorial: How to use it?
- Understanding Testing Library Jest DOM
- Understanding Jest-Globals
- Unit Testing of React Apps using JEST : Tutorial
- How to test React App using Jest
- Understanding Jest beforeEach Function
- Performing NodeJS Unit testing using Jest
- Jest vs Mocha: Comparing NodeJS Unit Testing Frameworks
- Jest vs Mocha vs Jasmine: Which JavaScript framework to choose?
Conclusion
Debugging Jest tests efficiently requires a combination of tools, strategies and practices. Whether you are using console logs, debugger statements or IDE integrations like VSCode and IntelliJ, the goal is to gain clarity and fix issues promptly.
Tools like BrowserStack can further enhance your testing by providing cloud environments to debug Jest tests across multiple browsers and devices, ensuring more comprehensive test coverage.
Frequently Asked Questions
1. How do I run a test in debug mode?
You can run Jest tests in debug mode by using IDE tools like VSCode or IntelliJ or by running Jest with the –inspect flag to attach a debugger.
2. How to test for errors in Jest?
Use Jest’s built-in toThrow() matcher to test error scenarios.
For example:
test('throws an error', () => {

  expect(() => someFunction()).toThrow('Error message');

});
With these approaches, you can easily debug and fix issues in your Jest test cases.


