iOS users form a significant part of mobile web traffic, making it essential for businesses to ensure their websites perform seamlessly on Safari, the default iOS browser.
Optimizing websites for Safari ensures a seamless user experience. However, debugging on Safari is challenging for Windows users as the latest versions aren’t available. Reliable solutions are needed to test on real iOS devices.
This article explores effective methods for debugging iPhone Safari on Windows, including using BrowserStack’s real device cloud for accurate testing.
Why Debug iPhone Safari on Windows?
Since Safari uses the WebKit engine, it behaves differently from other browsers. Debugging on Windows is crucial to ensure a smooth experience for iOS users.
Websites may have layout issues, touch responsiveness problems, or performance inconsistencies that need to be fixed.
- Identify Safari-Specific Issues: Safari has unique rendering behaviors that can affect CSS, JavaScript, and animations.
- Ensure Touch Responsiveness: iPhones rely on touch gestures, which may function differently compared to desktops.
- Fix Compatibility Problems: Websites should work consistently across different browsers, including Safari on iOS.
- Optimize Performance: Debugging helps analyze load times, responsiveness, and overall user experience.
Must Read: Remote Debugging on iOS and Mac Safari
How to Debug iPhone Safari on Windows?
Debugging iPhone Safari on Windows can be done using two primary methods. If you have access to a Mac, you can use Safari Web Inspector for remote debugging.
Alternatively, BrowserStack provides a seamless way to test and debug iPhone Safari directly on real devices from a Windows system.
Method 1: Using Remote Debugging with Safari Web Inspector
If you have access to a Mac, Safari Web Inspector provides a robust way to debug iPhone Safari directly. It allows real-time inspection of elements, network requests, and performance metrics.
- Enable Develop Mode in Safari: Allows you to access debugging tools when an iPhone is connected.
- Inspect and Modify Elements Live: Check HTML, CSS, and JavaScript directly on the iPhone Safari browser.
- Analyze Network Requests: Monitor API calls, load times, and potential bottlenecks.
- Debug JavaScript Issues: View errors, run scripts, and test code fixes in real-time.
Method 2: Debug iPhone Safari on Windows using BrowserStack
You can use BrowserStack to debug iPhone Safari on Windows. BrowserStack makes iPhone Safari debugging simple, irrespective of the operating system being used.
Windows users (on Windows XP, 7,8,10) can test and debug on the desired iPhone – Safari combination directly from their web browser (Firefox, Chrome, Safari, etc). One simply needs to create a free account on BrowserStack to start testing on a real Safari browser on a real iPhone.
Follow the steps below to get started:
- Sign-up for a free trial on BrowserStack Live.
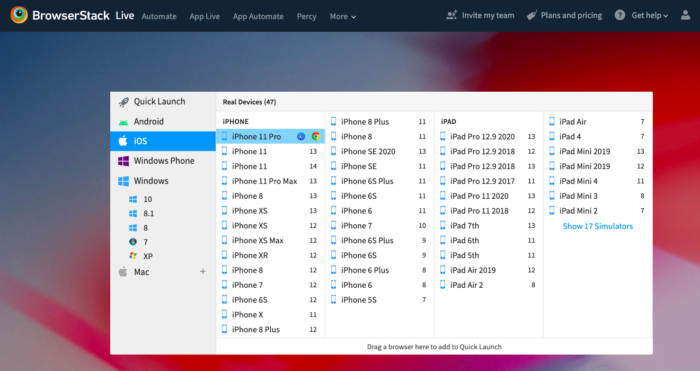
- Once the account is created, navigate to the Live Dashboard.
- From the available operating systems, choose iOS
- Hover over the desired handset. (Let’s take iPhone 11 Pro for this example)
- From the two options available – Chrome and Safari icon. Click on the Safari logo.
- Clicking on the Safari icon will initiate a new Safari session on a real iPhone 11 Pro.
- Now, the user can navigate to the desired website that needs to be debugged.
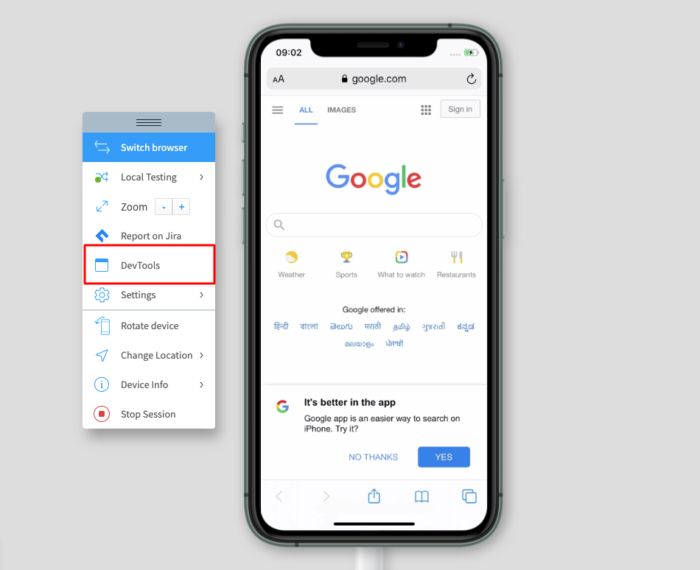
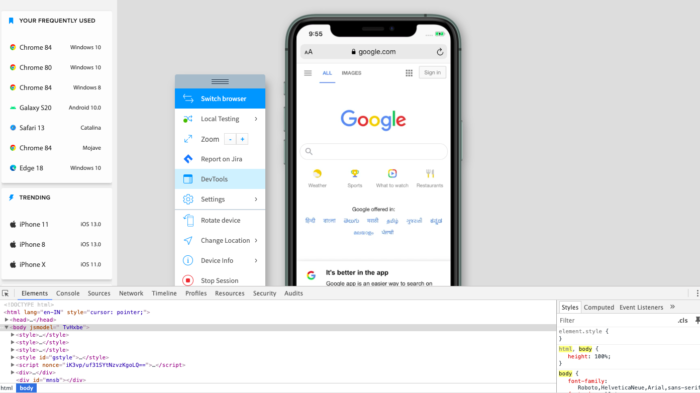
- For debugging a specific web-element, a developer or QA engineer may need access to browser-specific DevTools. For convenient testing, BrowserStack offers users upfront access to Safari DevTools on all iOS devices. This is similar to the Web Inspector feature used by developers on Mac-Safari.
- Developers or QAs can instantly access Safari DevTools from the floating toolbar available next to the iPhone. Refer to the images below.
The images above represent how BrowserStack’s real device cloud makes debugging effortless on any iPhone-Safari combination.
Try Debugging on iPhone Safari for free
DevTools on BrowserStack enables a user to remotely inspect the HTML, CSS, and JavaScript components for a particular web-element. Additionally, as teams get access to the latest and legacy versions of iPhones, debugging any issues for a specific iOS device becomes much easier for them.
Apart from remote testing, BrowserStack also allows developers to locally test their work-in-progress web-apps on real devices using the Local Testing feature. One can refer to the Local Testing Documentation to learn more about how to get started with it.
Recommended Read: How to test a website from different countries
Best Practices for Debugging iPhone Safari on Windows
Without a Mac, debugging on Windows requires alternative approaches. Following these best practices ensures an efficient debugging process.
- Use Real Device Testing: Platforms like BrowserStack provide access to real iPhones for accurate testing.
- Check CSS Compatibility: Safari may handle flexbox, viewport units, and animations differently than other browsers.
- Test Touch and Gesture Interactions: Ensure smooth scrolling, tapping, and swiping, as these may differ from desktops.
- Monitor Performance Metrics: Use tools like Lighthouse to analyze load times and responsiveness on iOS.
- Validate Cross-Browser Compatibility: Compare rendering across Safari, Chrome, and Firefox to maintain consistency.
Conclusion
As mentioned earlier, the latest versions of Safari are not available for Windows users. This makes it very challenging for teams (Windows users in particular) to debug websites on iPhones using a feature like Web-Inspector.
However, platforms like BrowserStack help address this issue by offering real iOS devices for testing purposes, irrespective of the tester’s operating system. Additionally, Local testing and DevTools for iPhones help individuals eliminate testing pain points and make the entire process noticeably easier.
Also, teams do not have to worry about purchasing new handsets or creating an on-premise device lab in order to test software. Simply sign up on BrowserStack, choose the desired iPhone-Safari combination and start debugging.
Frequently Asked Questions
1. Can I debug iOS on Windows?
You can debug iOS apps on a Windows machine using a third-party tool like Xamarin or React Native. You can also access BrowserStack from your windows device and debug iOS devices.
2. How do I inspect my iPhone on Windows 10?
- Login to BrowserStack Live from windows 1o.
- Select iOS as the operating system and select the iPhone that you want
- Browse the website and then right click > Inspect
3. How do I debug Safari mobile browser?
You can debug Safari mobile browser using Safari’s built-in developer tools or BrowserStacj. To enable Safari developer tools, go to Settings > Safari > Advanced, and toggle on the “Web Inspector” option. Then, connect your iPhone to your Mac, open Safari on your Mac, and go to Develop > [Your iPhone’s Name] to access the developer tools. Alternatively, you can debug Safari by logging into BrowserStack Live and selecting the device.
4. Can I use Xcode on Windows?
No, Xcode is only available on macOS, so you cannot use it on a Windows machine. However, you can use third-party tools like Xamarin or React Native to develop iOS apps on a Windows machine.


