Debugging is an essential step in building robust Angular applications. Chrome DevTools provides powerful features that make it easier to inspect components, trace errors, and fix issues efficiently.
Overview
What is Angular
Angular is a popular open-source web application framework developed and maintained by Google. It’s used to build dynamic, single-page web applications using HTML, CSS, and TypeScript.
What is Chrome DevTools
Chrome DevTools is a set of built-in tools in the Google Chrome browser that helps developers inspect, debug, and optimize websites and web applications.
In this guide, we’ll show you how to debug Angular apps in Chrome to streamline development and improve code quality.
How to Debug an Application Using Chrome DevTools
Let us see the steps you can use Chrome DevTools for debugging an application.
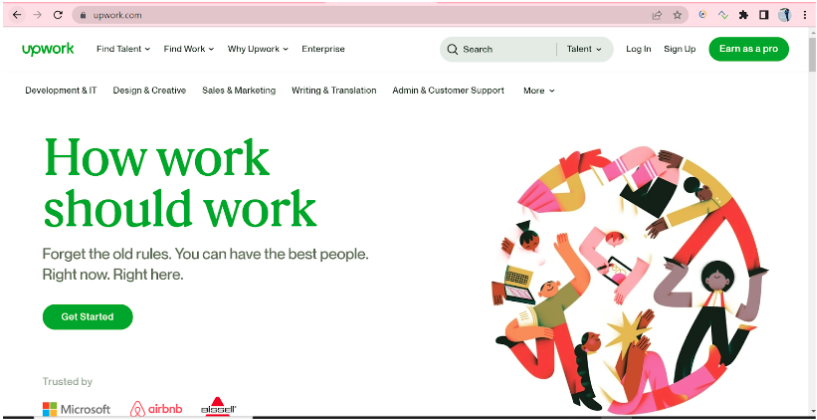
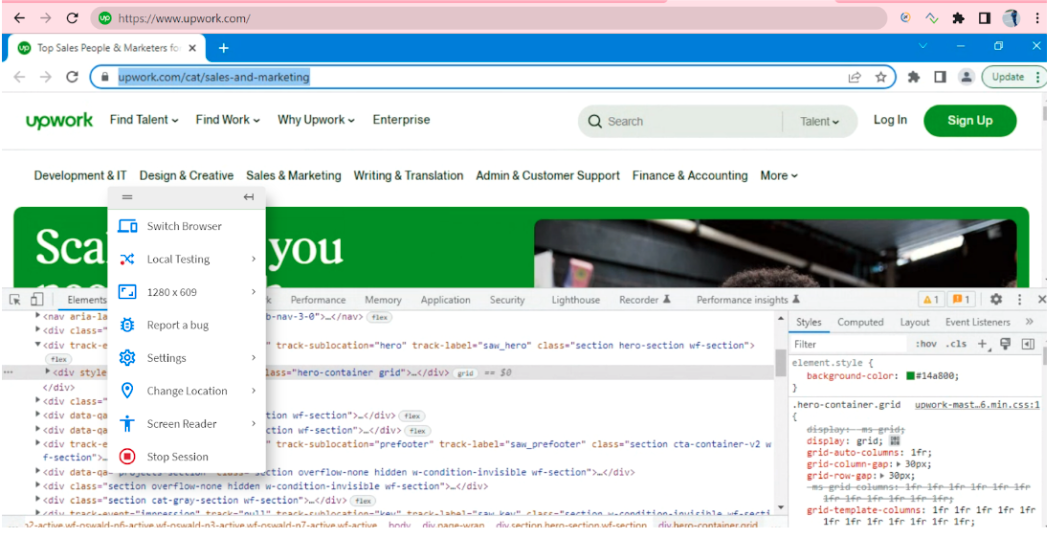
Step 1: Open Chrome and navigate to your Angular app. For example – Upwork.
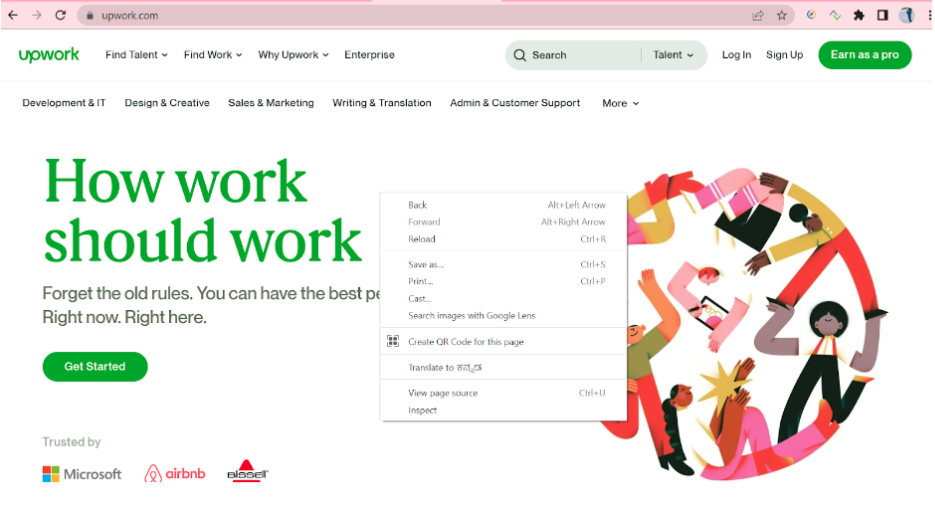
Step 2: Right click and choose the Inspect option.
Also Read: How to Inspect Element on Android Device
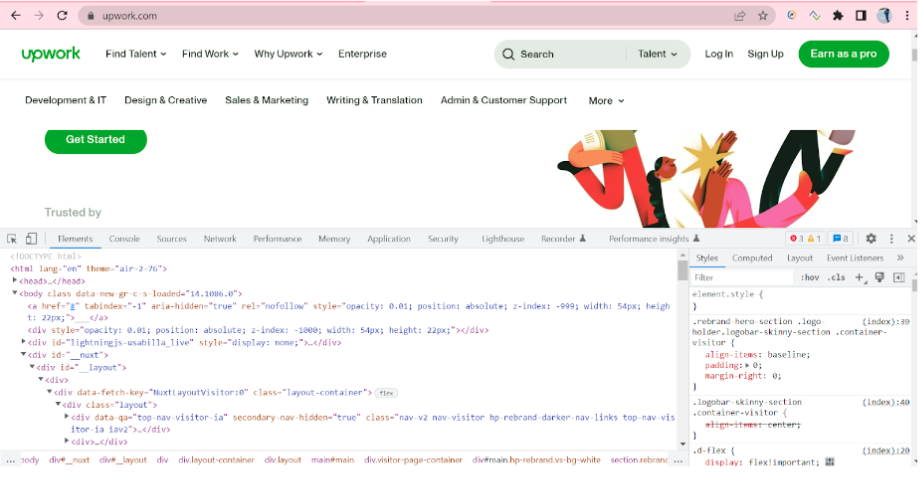
Step 3: Once you click on Inspect you will see the Chrome Dev tools opening up.
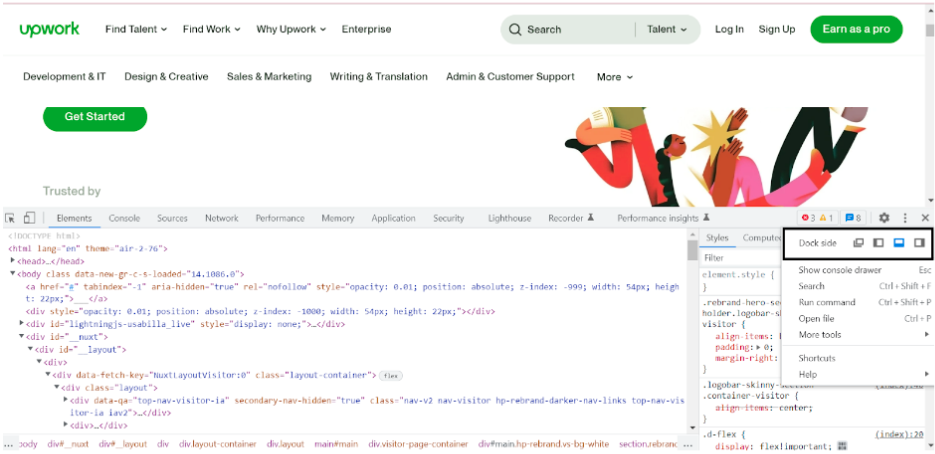
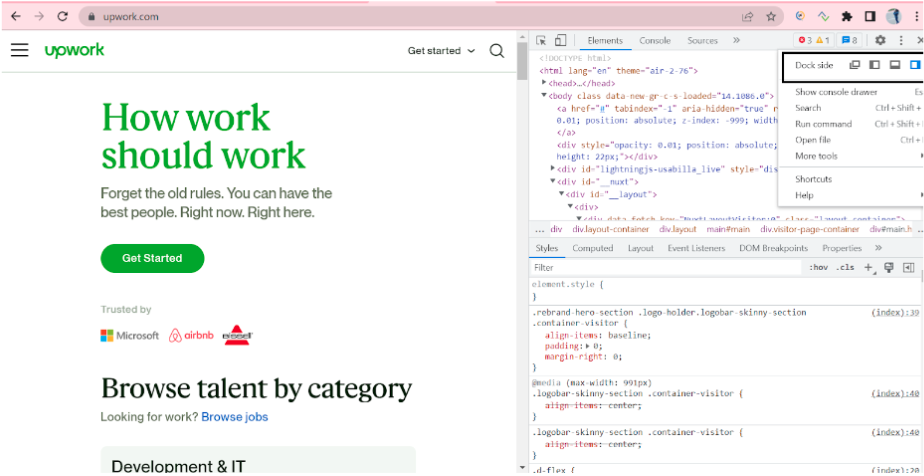
Step 4: You can choose the convenient position of the DevTools using any of the available dock options.
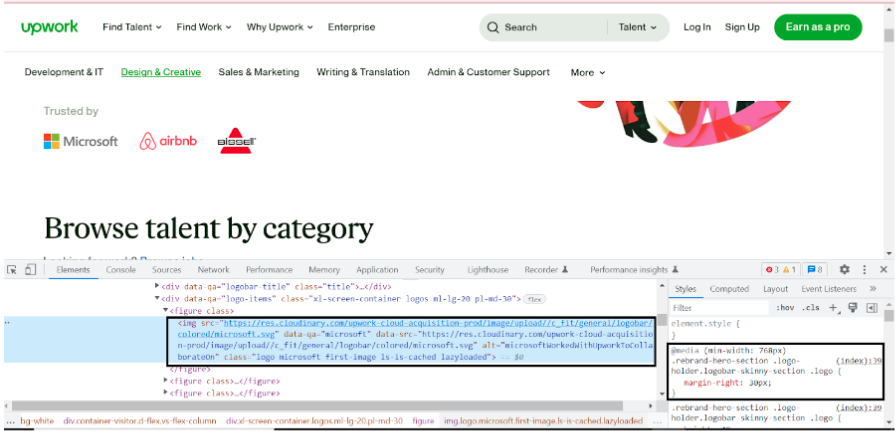
Step 5: You can make use of the Elements tab for inspecting any of the dom elements to check their CSS attributes, styles, IDs, etc.
Step 6: You can use the Console tab for multiple purposes, such as executing any custom JS code, checking the application’s logs for any runtime errors, etc.
Developers can also log messages using console.log in order to inspect the value of any variable or to simply ensure that the code is flowing in the correct order.
Step 7: You can use the Network Panel to check the entire application’s Network activity.
Network Panel is the place where the application’s entire network activity gets logged. All uploaded or downloaded resources can be inspected in the Network panel. These resources are chronologically listed, such as HTTP response code, initiator, loading time, size, and state. The footer here contains an overall summary of the total number of requests and the size of the resources transferred.
Step 8: You can inspect any of the HTTP requests
This list view in Network tab here helps in easily spotting the failed requests as they are marked in red and those that are pending or may timeout.
When you click on a specific resource here, it further opens a detailed panel where the HTTP headers are shown along with the response.
You can use these request headers and their corresponding response for debugging any issue in the code further.
Step 9: You can use the Timing breakdown option for each of the individual requests for investigating any performance statistics.
The timing breakdown here can prove to be very useful while investigating requests that take a long time to download, which can be either due to a poor connection between your Angular application and the server or due to a slow backend.
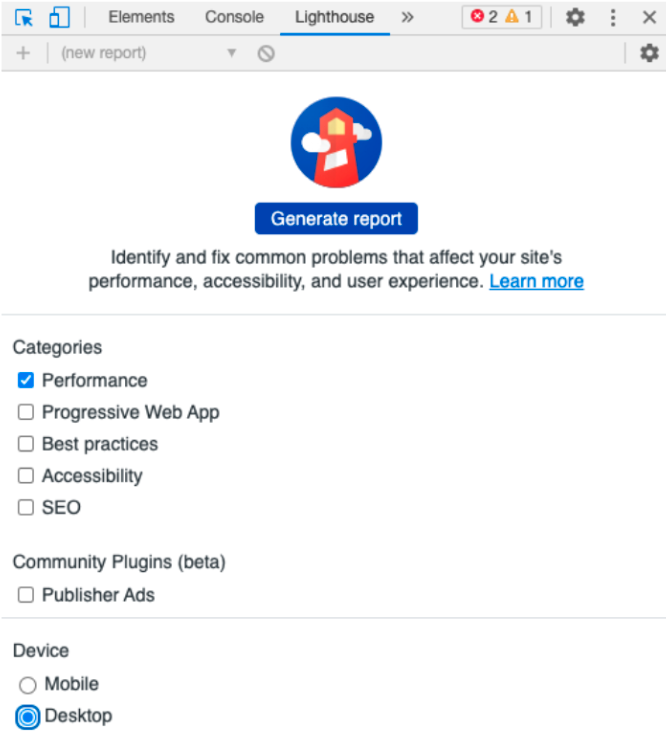
Step 10: You can use the Lighthouse Report for debugging any performance-related issues.
If you need any performance statistics, Lighthouse Report can help identify the problems that could be affecting your Angular app’s performance and user experience.
How to Debug Angular Apps with Angular DevTools
Angular DevTools is an official Chrome extension designed specifically to help developers debug and profile Angular applications. Here is how you can debug Angular apps with Angular DevTools:
Install Angular DevTools
- Go to the Chrome Web Store.
- Click “Add to Chrome” to install the Angular DevTools extension.
Open Your Angular Application
Launch your app and ensure it runs in development mode (not production), as Angular DevTools only works with development builds.
Open Chrome DevTools
- Right-click anywhere on the page and select “Inspect”, or press Ctrl+Shift+I (Windows/Linux) or Cmd+Option+I (Mac).
- Navigate to the “Angular” tab that appears in the DevTools panel.
Start Debugging
- Use Component Explorer to view the app’s component structure.
- Inspect component inputs, outputs, and state.
- Use Profiler to analyze performance and understand change detection behavior.
Read More: The Ultimate AngularJS Testing Guide
Debugging Applications on Chrome Using Browserstack Live
BrowserStack makes Chrome debugging on Desktop as well as Mobile devices quite effortless. Developers and testers get instant access to Chrome DevTools on their chosen Desktop or Mobile handset. This makes it even easier for them to trace specific bugs on a device.
Maintaining a large variety of devices for testing and debugging is not a cakewalk as it requires a lot of investment and effort in procuring and maintaining them. BrowserStack enables developers and testers to test and debug their websites and mobile applications across 3000+ real browsers, operating systems, and mobile devices.
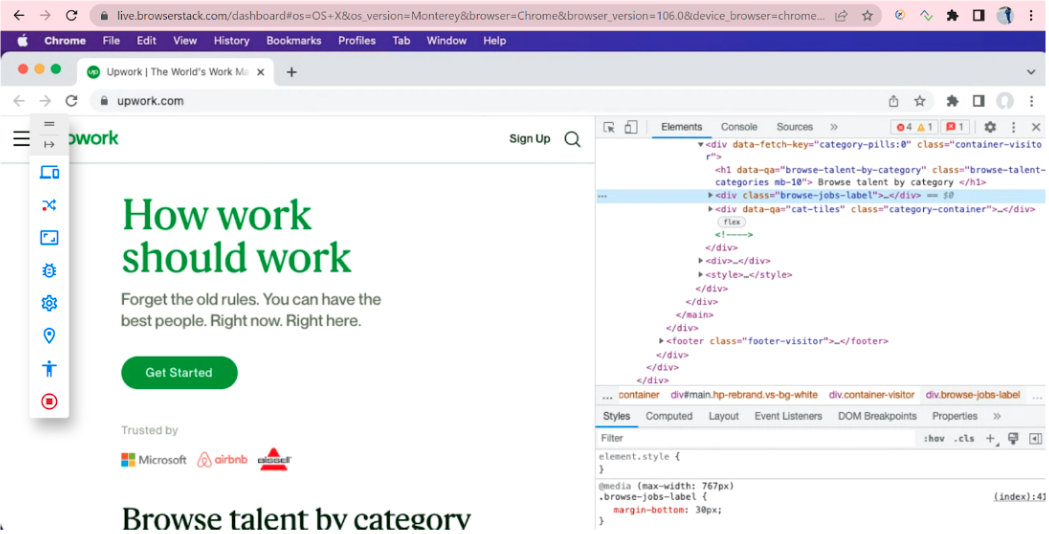
Let us test a sample angular app Upwork across different desktop and mobile devices using BrowserStack.
To do this, you need to first create a BrowserStack.
Create a free account on BrowserStack
Follow the below steps to get started:
1. Once the account is created, you can navigate to the Live Dashboard.
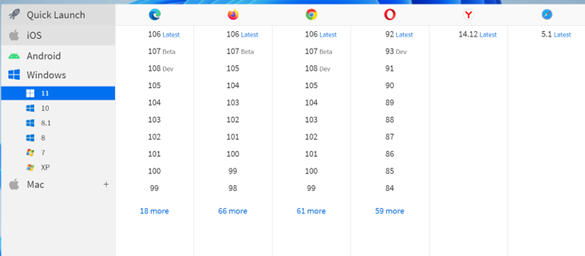
2. Choose the Operating System; you can choose any of the desired OS from Android, iOS, Windows, or Mac
3. Depending on the chosen OS, you can choose from any supported version and browser.
4. Clicking the desired browser version will start the session.
5. Once the session begins, you can navigate to the website to be tested and start debugging using DevTools option.
Once the device is initialized, you can start the test.
Also Read: Browser Compatibility for AngularJS Web Apps
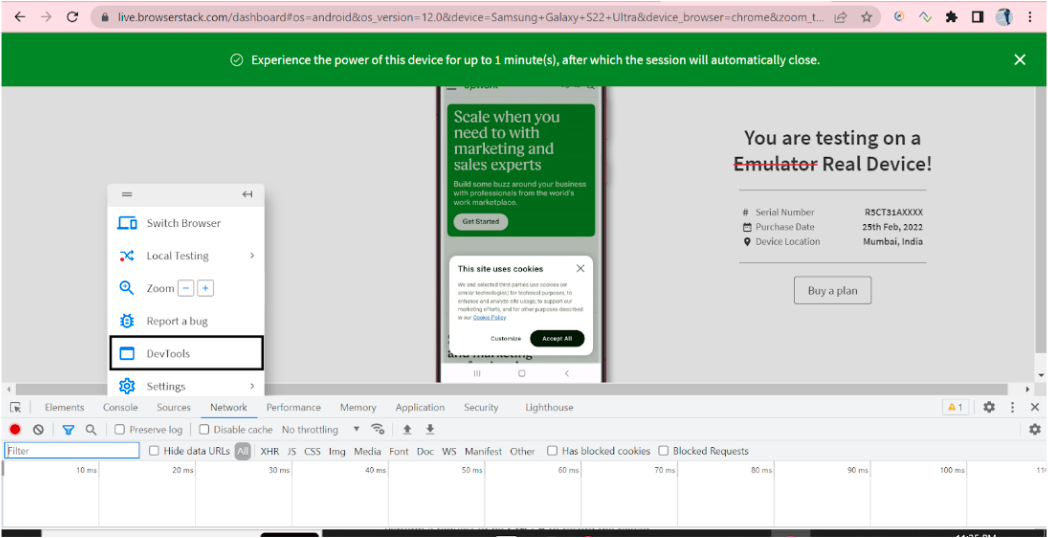
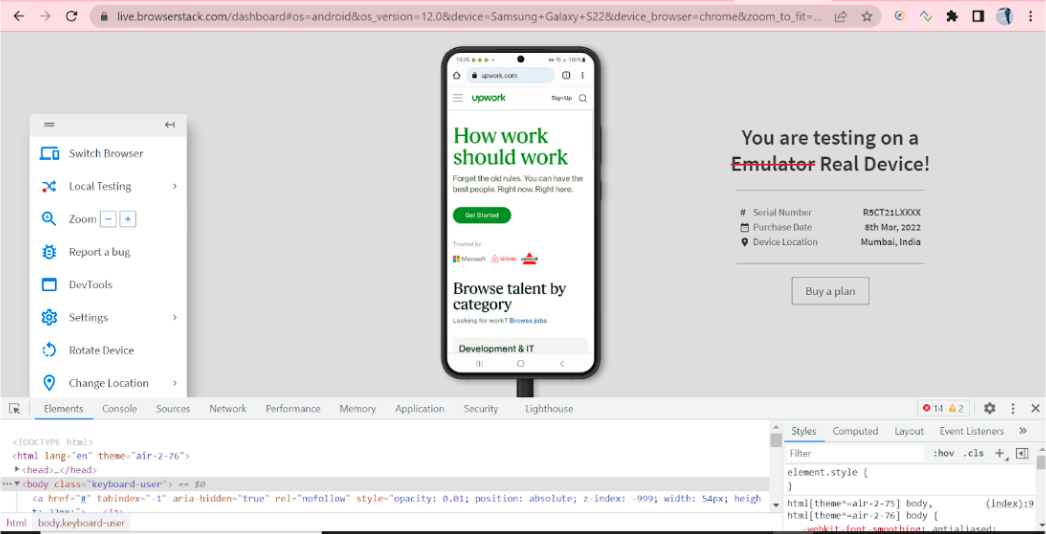
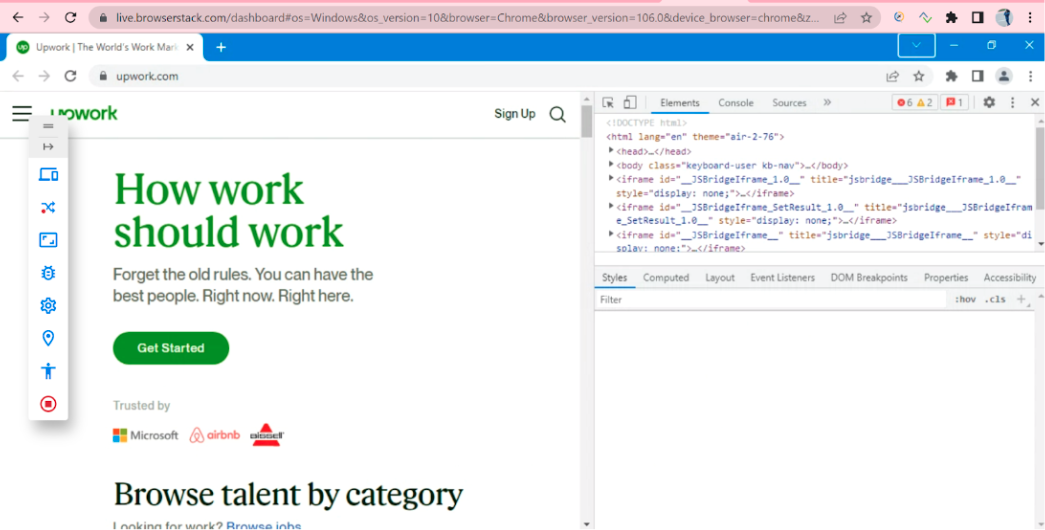
Here are a few snapshots of the test performed on different device-browser combinations.
Samsung Galaxy S22 with Chrome 106
Google Pixel 6 with Chrome
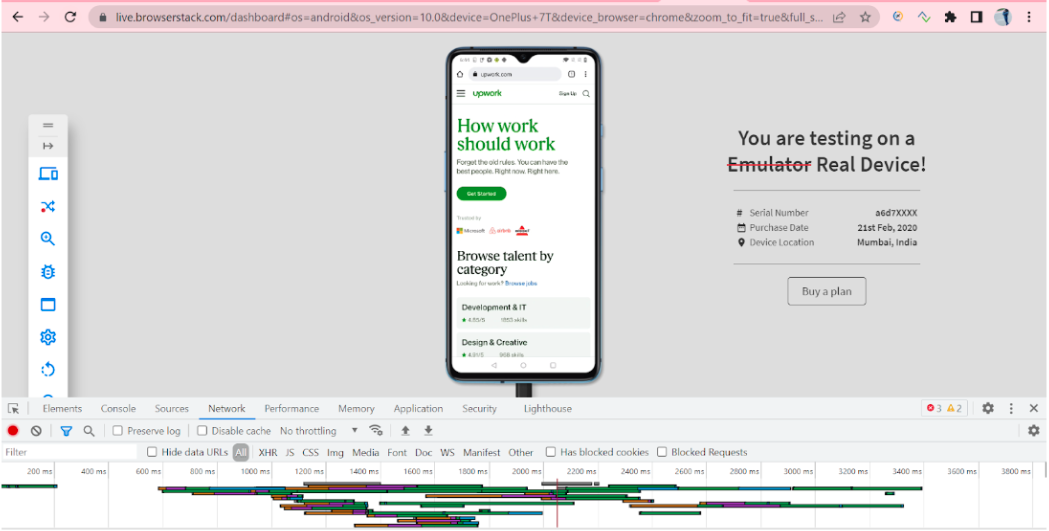
Windows 10 with Chrome 106
Mac OS Monterey with Chrome 106
Conclusion
Using Chrome dev tools, you can easily play around with code changes in the DOM and see the actual changes of it reflecting in your Angular app.
Using platforms like BrowserStack empowers teams by providing them with an ideal infrastructure for debugging and testing their applications seamlessly across multiple devices and OS combinations. They do not need to worry about maintaining those devices and can just sign up for free, choose the desired device-browser combination, and start testing. Additionally, using features like Local testing and DevTools on mobile browsers easily helps in debugging critical issues and makes the entire process easier.
Frequently Asked Questions
1. How to Check Angular Version in Chrome Console
Here’s how you can check your Angular Version in Chrome Console
1. Open the Angular app in Chrome.
2. Then, Open Chrome DevTools and:
- Right-click on the page and select “Inspect”
or - Press Ctrl+Shift+I (Windows/Linux) or Cmd+Option+I (Mac).
- Right-click on the page and select “Inspect”
3. Go to the Console tab and enter the command
ng.version.full
Note: This works only if the app runs in development mode and exposes the Angular global ng object.
2. How to view Angular source code in browser?
You can view Angular source code in the browser by following the steps below:
- Open Chrome DevTools by right-clicking and selecting Inspect.
- Navigate to the Sources tab.
- Go to the webpack:// or ng:// folder (if source maps are available).
- Explore the app’s TypeScript files, components, and services.
Note: This works only in development mode with source maps enabled.


