Code coverage in Cypress helps track which parts of your application code are executed during end-to-end tests. This ensures your tests are not only passing but also effectively covering critical logic. Setting it up involves instrumenting the app code, configuring plugins, and running tests to collect and visualize coverage data.
Overview
What is Code Coverage in Cypress?
Code coverage in Cypress is the process of measuring how much of an application’s source code is executed while running end-to-end tests. Integrating tools like @cypress/code-coverage allows you to collect and view detailed reports to identify untested parts of your codebase and improve overall test quality.
Benefits of Code Coverage in Cypress
- Improved Test Quality
- Identify Gaps
- Better Confidence in Release
- Supports Test-Driven Development (TDD)
- Optimized Testing Efforts
- Visual Feedback
Learn how to set up Cypress code coverage, understand UI coverage, how it differs from code coverage, and more.
What is Code Coverage in Cypress?
Code coverage in Cypress is the process of measuring how much of an application’s source code is executed while running end-to-end tests.
It shows which lines, functions, and branches were tested, helping you evaluate the effectiveness of your test suite.
Integrating tools like @cypress/code-coverage allows you to collect and view detailed reports to identify untested parts of your codebase and improve overall test quality.
Code coverage is not a standard feature of Cypress testing library. Hence, Cypress code coverage requires some setup and configuration.
Importance of Cypress Code Coverage
Code coverage is a term used in testing to describe how well a source code is being executed. This reveals the sections of the source code that are executed during test execution.
As additional tests are generated and stacked, the necessity of testing particular application components may be questioned. We can look at metrics such as functional, statement, branches, condition, and line by employing code coverage.
- Function coverage: It measures how many of the defined functions have been called.
- Statement Coverage: Used to track how many program statements have been run.
- Branch Coverage: A measure of how many branches in a control structure have been successfully executed.
- Condition Coverage: Used to observe boolean subexpressions that are examined for true and false.
- Line Coverage: Counts the number of lines of source code that have been tested.
By measuring these different types of coverage, Cypress code coverage ensures thorough testing and highlights exactly where your tests need improvement. This makes it a vital tool for maintaining high-quality, dependable applications.
Follow-Up Read: Measuring Code Coverage
Benefits of Code Coverage in Cypress
Here are the benefits of code coverage in Cypress:
- Improved Test Quality: Ensures critical code paths are tested, minimizing the risk of bugs in untested areas.
- Identify Gaps: Highlight your application’s untested lines, functions, or branches.
- Better Confidence in Releases: Ensures your test suite properly covers your app’s logic before deployment.
- Supports Test-Driven Development (TDD): Encourages writing tests that align closely with feature development.
- Optimized Testing Efforts: Helps avoid redundant or ineffective tests by showing which areas are already well-covered.
- Visual Feedback: Generates easy-to-read reports that help teams monitor and improve test coverage over time.
Setting up Code Coverage in Cypress
It takes three steps to set up Cypress code coverage:
- To find out which statements are being executed, first instrument code.
- For those statements to be executed, run the instrumented code.
- Report the results and check the execution, if any.
1. Instrumentation
The instrumentation procedure includes the following steps: calculating the number of lines of source code that were executed during testing, parsing it to identify all functions, statements, and branches, and finally adding counters to the code. These counters indicate the frequency of execution of these statements, functions, and branches.
// square.js
function square (num) {
return num**2
}

module.exports = { square }
The source code for instrumenting the code above might resemble this.
const c = (window.__coverage__ = {
// we have just one function, thus [0]
f: [0],
// we have three statements, thus [0,0,0]
s: [0, 0, 0],
})
For our program, let’s create a test.
// square.spec.js
const { square } = require('./square')

it('squares a number', () => {
expect(square(5)).to.equal(25)
})
The aforementioned test will add counters to the coverage object that may resemble this.
const c = (window.__coverage__ = {
f: [1],
s: [1, 1, 1]
})

// Our function is defined in the first statement, which is incremented.
c.s[0]++
function square(num) {

c.f[0]++

c.s[1]++

return num**2
}

// 3rd statement is called and incremented as well
c.s[2]++
module.exports = { square }- In this instance, our test covers 100% of the code.
- The created report for this coverage object will be preserved in a human-readable format.
- Cypress does not instrument our code; instead, we must do so manually using either the nyc or the babel-plugin-istanbul as part of the code translation pipeline (a command-line interface to istanbul).
2. Installation & Configuration
- Let’s install and set up each of our required dependencies.
- You can instrument your code with Istanbul coverage using the babel plugin “babel-plugin-istanbul.” It is compatible with Karma and Mocha (which is used by Cypress as well)
- A coverage information summary API is available from istanbul-lib-coverage, which can read and integrate coverage data.
- An HTML file is one of the several output formats for a code coverage report from the Istanbul command line interface nyc.
sh$ yarn add babel-plugin-istanbul istanbul-lib-coverage nyc
Install the Cypress Code Coverage Plugin
sh$ yarn add cypress @cypress/code-coverage
Configure.babelrc (if you don’t already have one, create one)
{
"plugins": ["istanbul"]
}
Make a nyc configuration file. In this instance, I want to examine the coverage for both.js and .vue
{
"extension": [".js", ".vue"]
}
3. Setup for the Cypress Code Coverage Plugin
To use the Cypress Code Coverage plugin after adding Cypress to your project, you must configure the Cypress plugin file, located at cypress/plugin/index.js.
import '@cypress/code-coverage/support'
module.exports = (on, config) => {
on('task', require('@cypress/code-coverage/task'))
}
Let’s take a time to ponder some philosophical ideas now that everything is set up. Should we try to cover everything? Though it may seem wonderful, achieving 100% code coverage does not imply that we are bug-free.
You’ll see that this test contains zero assertions:
it('generates a random fact', () => {

cy
.visit('/')

cy
.get('button')
.click()

});
However, there are many things that might go wrong in our app. Any number of things may go wrong, including our layout, improper character rendering, and a malfunctioning API. Nevertheless, our test covered every possible scenario.
Running through the app doesn’t truly assert the values it returns. This is something to bear in mind when writing tests that incorporate test coverage.
- Finding areas of a project that are not covered by tests and navigating it can be made easier using code coverage.
- It is an excellent navigational tool that is quick to set up and offers many benefits.
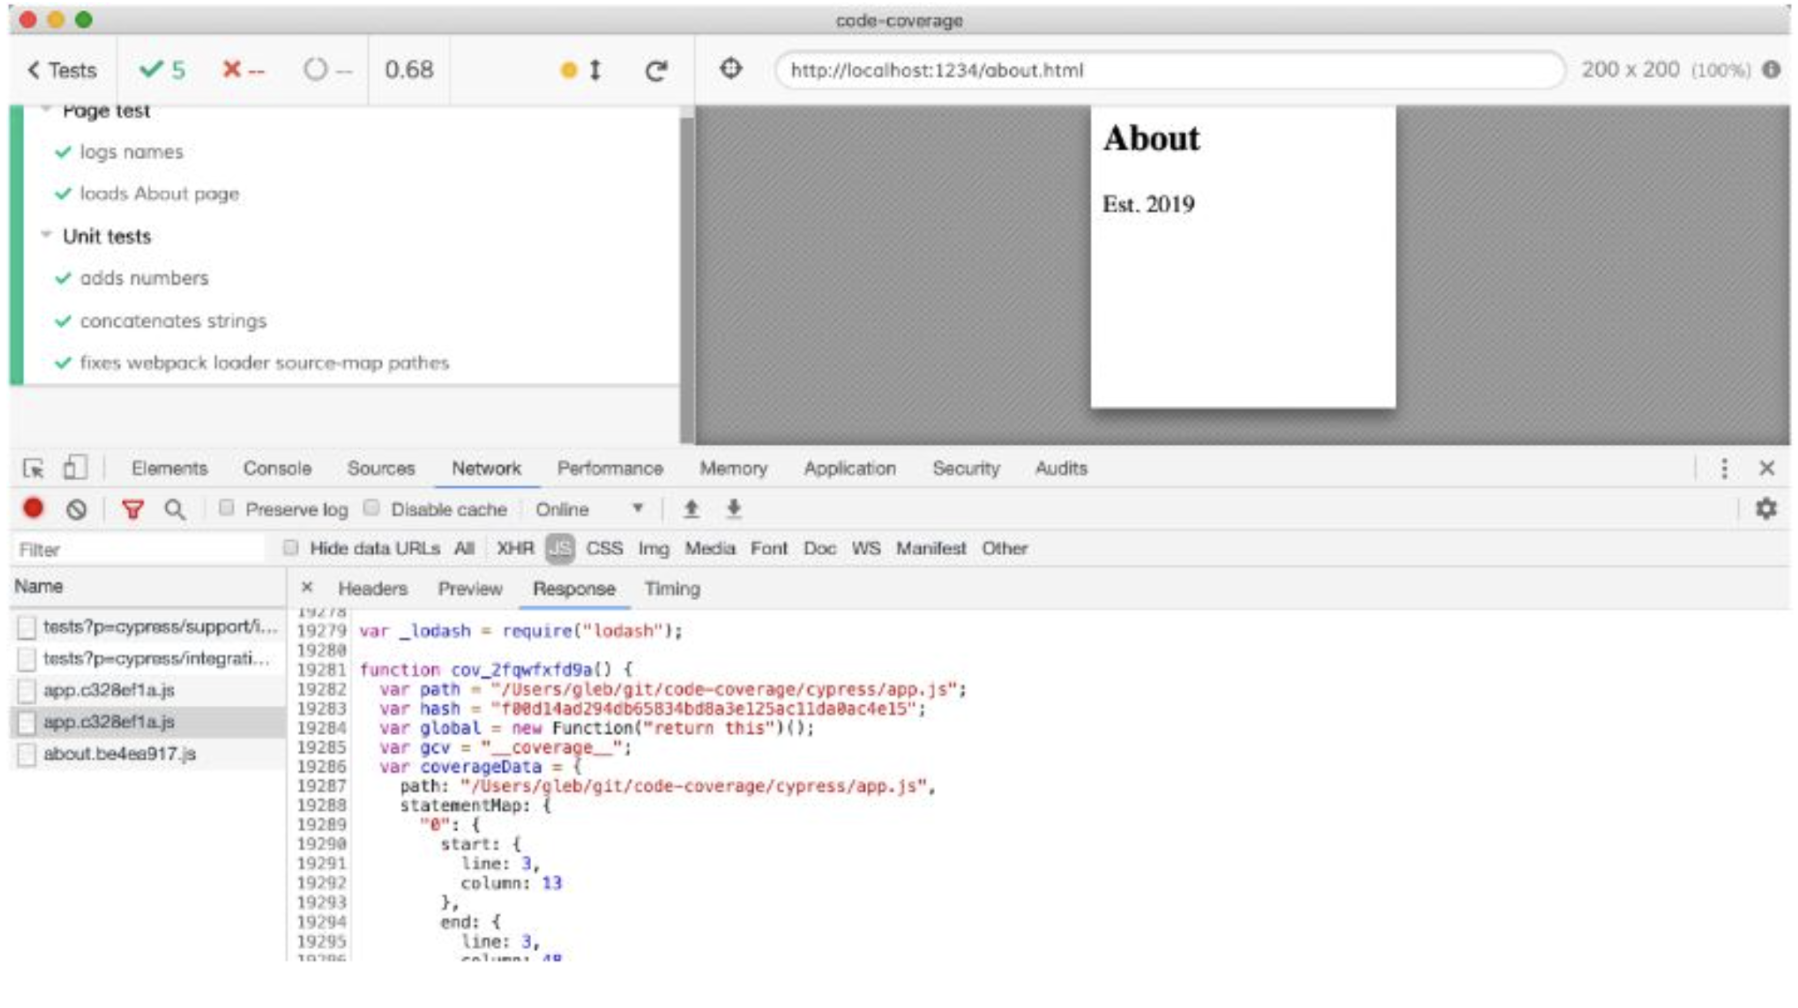
The image below shows additional counters and instructions that should be present in the JavaScript resources of your application if it has been properly instrumented.
When viewing the “Application under test iframe,” you will notice the window.__coverage__ object.
If you have instrumented the code for your application and saw the window. __coverage__ object, this plugin will save the coverage into the.nyc_output folder and generate reports once the tests have been completed (even in the interactive mode). The folder coverage/lcov-report contains the LCOV and HTML report.
How to Merge Code Coverage from Parallel Tests
When running Cypress tests in parallel, each instance generates its own code coverage report. You need to merge these individual reports into a single coverage summary to get a unified view. Here’s how to do it:
Step 1: Install Required Packages
Make sure install these tools:
npm install nyc @cypress/code-coverage --save-dev
Step 2: Save Coverage Outputs per Machine
Make sure each parallel test run saves its .nyc_output folder (usually generated in your project root) as an artifact or shared folder.
Step 3: Merge .nyc_output Folders
After all parallel runs complete, gather all .nyc_output folders into one location. For example, in your CI pipeline, you might do:
mkdir -p merged_output/.nyc_output

cp */.nyc_output/* merged_output/.nyc_output/
Step 4: Generate Merged Report
Once the files are merged, run the following command in the merged directory.
nyc report --reporter=html
Step 5: Upload to Coverage Tools
This is an optional step. You can also upload the merged results to code coverage tools.
What is UI Coverage in Cypress?
UI coverage in Cypress refers to tracking how much of the user interface (UI) elements are interacted with or exercised during end-to-end tests.
It helps answer questions like:
- Are all important screens or user flows tested?
- Are critical elements (e.g., submit buttons, modals) interacted with?
- Do your tests simulate real user behavior across the UI?
While Cypress doesn’t offer built-in UI coverage tracking, it can be estimated with custom logging, plugins, or visual testing tools that monitor element interactions and page coverage during test execution.
Code Coverage vs UI Coverage
Unlike code coverage, which measures how much of the application’s source code is executed, UI coverage focuses on whether key UI components (like buttons, forms, etc.) are actually visited, clicked, or tested in your test suite.
| Aspect | Code Coverage | UI Coverage |
|---|---|---|
| What it Measures | How much of the application’s source code is run during tests | How much of the user interface (UI) is interacted with during tests |
| Focus | Backend logic, functions, conditions, and statements | Screens, buttons, forms, links, and user flows |
| Purpose | Ensures your code is being tested | Ensures the UI behaves correctly under user interactions |
| Tools Used | @cypress/code-coverage, Istanbul (nyc) | Custom logging, visual testing tools, Cypress commands |
| Output | Detailed reports showing which parts of code were executed | Insights into which UI elements were tested or left untouched |
| Common Use Case | Validating logic coverage in APIs or app internals | Verifying that critical user interactions are tested |
App vs Unit Tests
A web application needs to be instrumented. This means that you should instrument the requests for index.html whenever the test uses the cy.visit(‘localhost:3000’) function. Often, you need to add the babel-plugin-istanbul to your pipeline somewhere.
Unit testing is testing individual functions from your application code by importing them straight into Cypress spec files. Cypress can instrument this process for you. Check out the section on instrument unit tests.
- The coverage folder contains results in various forms, and the raw coverage data is kept in the.nyc_output folder.
- The coverage statistics are available for your inspection.
- Since nyc is dependent on this plugin, it should be immediately accessible.
Here are a few typical instances:
# see just the coverage summary
$ npx nyc report --reporter=text-summary
# see just the coverage file by file
$ npx nyc report --reporter=text
# save the HTML report again
$ npx nyc report --reporter=lcov
Why Run Cypress Tests on BrowserStack
BrowserStack is a cloud-based testing platform that lets you run Cypress tests efficiently across multiple device-OS-browser combinations. Here are a few reasons why you should choose BrowserStack:
- Cross-browser testing: Cypress runs on limited browsers, mainly Chrome-based ones. BrowserStack helps you expand your Cypress tests to many other browsers, such as Safari, Edge, IE, and more.
- Video Recording: The ability to record videos of test execution is a significant benefit of using BrowserStack to execute Cypress tests.
- Cloud Infrastructure: This cloud-based platform does not require setting up or maintaining browsers or physical devices locally.
- Parallel Testing: With parallel testing, you can run multiple Cypress tests concurrently, speeding up test execution and eventually the release cycles.
- Real-device testing: BrowserStack offers you a vast real-device cloud, letting you run Cypress tests on 3500+ real device, browser, and OS combinations, thus allowing you to test under real user conditions.
- Integrations: BrowserStack offers seamless integrations with several CI/CD tools like Jenkins, Travis CI, Circle CI, Bamboo and more.
- Scalability: BrowserStack supports real-device and parallel testing on a cloud-based infrastructure, enabling you to run hundreds of Cypress tests across different environments.
Conclusion
This article teaches you how to generate code coverage from local E2E tests and use the nyc command to produce reports in various formats. This can be integrated into your CI system to monitor coverage trends easily.
It helps you manage test coverage better and gain confidence in your product’s quality, by improving code quality.
For scalable automated testing, use BrowserStack, which runs tests without changing your scripts. With Parallel Testing, you can test across multiple browsers and devices faster.
Useful Resources for Cypress
Understanding Cypress
- Cross Browser Testing with Cypress : Tutorial
- Run Cypress tests in parallel without Dashboard: Tutorial
- Handling Test Failures in Cypress A Comprehensive Guide
- Cypress Test Runner: Tutorial
- Handling Touch and Mouse events using Cypress
- Cypress Automation Tutorial
- CSS Selectors in Cypress
- Performance Testing with Cypress: A detailed Guide
- Cypress Best Practices for Test Automation
- Test React Native Apps with Cypress
- Cypress E2E Angular Testing: Advanced Tutorial
- Cypress Locators : How to find HTML elements
- Maximizing Web Security with Cypress: A Step-by-Step Guide
- Conditional Testing in Cypress: Tutorial
- Cypress Web Testing Framework: Getting Started
- Cypress Disable Test: How to use Skip and Only in Cypress
- What’s new in Cypress 10? How it will change your current testing requirements
Use Cases
- How to Record Cypress Tests? (Detailed Guide)
- How to run your first Visual Test with Cypress
- How to Fill and Submit Forms in Cypress
- How to Automate Localization Testing using Cypress
- How to run Cypress Tests in Chrome and Edge
- How to use Cypress App Actions?
- How to Run Cypress Tests for your Create-React-App Application
- How to Run Cypress Tests in Parallel
- How to handle Click Events in Cypress
- How to Test React using Cypress
- How to Perform Visual Testing for Components in Cypress
- How to run UI tests in Cypress
- How to test redirect with Cypress
- How to Perform Screenshot Testing in Cypress
- How to write Test Case in Cypress: (with testing example)
Tool Comparisons


