Fast-loading websites keep users engaged while slow ones often lead to early exits, lower engagement, and fewer conversions.
Overview
What is Website Loading Time?
Website loading time is the total time it takes for a webpage to fully load and become usable after a user clicks a link or enters a URL. This includes loading all visible content, images, scripts, and interactive elements in the browser.
Factors That Affect Loading Time
Several factors affect website loading time, including
- Server response time: Delays from the hosting server can slow down the start of the loading process.
- Page size and number of resources: Large files and multiple assets increase the time needed to load a page fully.
- Image formats and compression: Uncompressed or high-resolution images take longer to load.
- JavaScript and CSS complexity: Heavy scripts or unoptimized stylesheets can block rendering.
- Third-party scripts or plugins: External tools like ads or analytics can delay loading.
- Caching strategy: Poor or no caching leads to repeated data transfers on each visit.
- Browser and device performance: Older devices or browsers may process content more slowly.
- Network speed and location: Slower connections or distant servers increase loading time.
This article explains everything you need to know about website loading time, its importance, key metrics, and tips for checking and improving your page loading speed.
What is Page Load Time?
Page load time refers to the total amount of time it takes for a web page to fully load and become interactive after a user initiates a request to view it.
This includes the time it takes for the browser to receive and render all the elements of the page, such as HTML, CSS, JavaScript, images, and other resources.
Why Do You Need a Fast Loading Website?
A fast-loading website keeps users engaged, reduces bounce rates, and supports better SEO performance. Here are some key reasons why you need a fast-loading website.
Here are some of the core reasons why you need a fast loading website:
- User Experience (UX): Slow website speeds can frustrate users, leading to a decrease in user satisfaction and engagement. A smooth, responsive user experience can encourage users to stay on your site longer, interact more with your content, and be more likely to convert (for example, make a purchase, sign up for a newsletter, etc.).
- Mobile Internet Use: The use of mobile devices for internet browsing has grown exponentially. Mobile users often have different connectivity and speed conditions, making speed and performance optimization even more crucial.
- SEO Ranking: Search engines, like Google, consider site speed as a ranking factor. Faster websites are more likely to rank higher in search engine results pages (SERPs), resulting in more visibility and traffic. Google implemented a new ranking algorithm called Core Web Vitals, which focuses on user experience, including loading speed, interactivity, and visual stability.
- ECommerce Growth: For online retailers, website speed and performance directly impact sales and revenue.
Read More: How to Test an E-commerce Website
- Increasing Web Complexity: Web applications are becoming increasingly complex with more scripts, images, third-party integrations, and high-resolution content than ever before. Making it critical to prioritize speed and performance optimization to ensure the best user experience.
- 5G and Edge Computing: With the ongoing global roll-out of 5G technology and the rise of edge computing, users’ expectations for website performance are higher than ever. These technologies promise significantly faster load times and lower latency.
- Sustainability: There’s an increasing awareness of the environmental impact of digital technologies. More data means more energy consumed, so an optimized, efficient website could also be a more sustainable choice, reducing its carbon footprint.
- Scalability: As your website grows, you will have more users, more page views, and more content. If your website is already slow, growth will only exacerbate the problem. Optimizing your website’s speed ensures that as you grow and scale, your website can handle the increased traffic and content.
- Competitive Advantage: A faster website can give you a competitive advantage. If your website is faster than your competitors’, you’re more likely to retain and attract users. In the online world, where users can go from one site to another in seconds, speed can be a key differentiator.
- Conversion Rates: Slow websites can have a direct impact on conversion rates. So if your website is an online store or relies on user conversions for revenue, optimizing your website’s speed is crucial.
Reasons for a Slow Page Load Time
Here are some of the common reasons for a Slow Page Load Time in a Website:
- Large File Sizes: Large images, videos, or other media files can significantly increase page load times.
- Unoptimized Images: Images that are not compressed or properly scaled can slow down a page.
- Too Many HTTP Requests: Each element on a page (scripts, images, stylesheets) requires an HTTP request, which can add up and increase load times.
- Inefficient Code: Bloated or poorly written HTML, CSS, and JavaScript can cause delays in rendering the page.
- Lack of Browser Caching: Not leveraging browser caching means that resources are downloaded every time a user visits a page, rather than being reused.
- Server Response Time: Slow server response times due to server overload, inefficient code, or high traffic can delay page loading.
- Web Hosting Issues: Shared hosting or low-quality hosting providers can impact load times if server resources are limited.
- Too Many Redirects: Multiple redirects can add additional load time as the browser has to process each one.
- Heavy JavaScript Execution: Large or inefficient JavaScript files, or scripts that run complex tasks, can block the rendering of the page.
Read More: How to Reduce Page Load Time in JavaScript
- Render-Blocking Resources: CSS and JavaScript files that block the rendering of the page until they are fully loaded can delay the display of content.
- Unoptimized Database Queries: Inefficient or slow database queries can increase server response time, affecting page load speed.
- Too Many Plugins or Extensions: For CMS platforms like WordPress, excessive plugins or poorly optimized plugins can slow down page performance.
- Network Issues: Poor internet connections or high network latency can also contribute to slower page load times.
How is Page Load Time Different from Response Time?
Page load time is the total time it takes for a webpage to fully display in the browser, including rendering, images, scripts, and other assets. Response time refers to how long it takes for the server to send the first byte after a user requests the page.
What is a Good Page Load Time on a Website?
While an Ideal Page Load Time is a typically between 0-2 seconds, however, a load time of 3 seconds is also considered as fine. Anything beyond 3 seconds i.e. 4 seconds or more is considered as slow.
Read More: How fast should a Website Load?
Key Metrics That Affect Page Speed
Here are some of the key metrics used for checking the load time performance of the website:
- Time to First Byte (TTFB) represents the time taken by a web or mobile browser to receive the first byte of response from the server after it requests a specific URL
- Page load time represents the time taken to completely display the content of a specific page
- Response Time represents the time taken to fully receive the first response from the server
- DOM processing Time represents the time required to parse the HTML into a DOM and retrieve or execute scripts
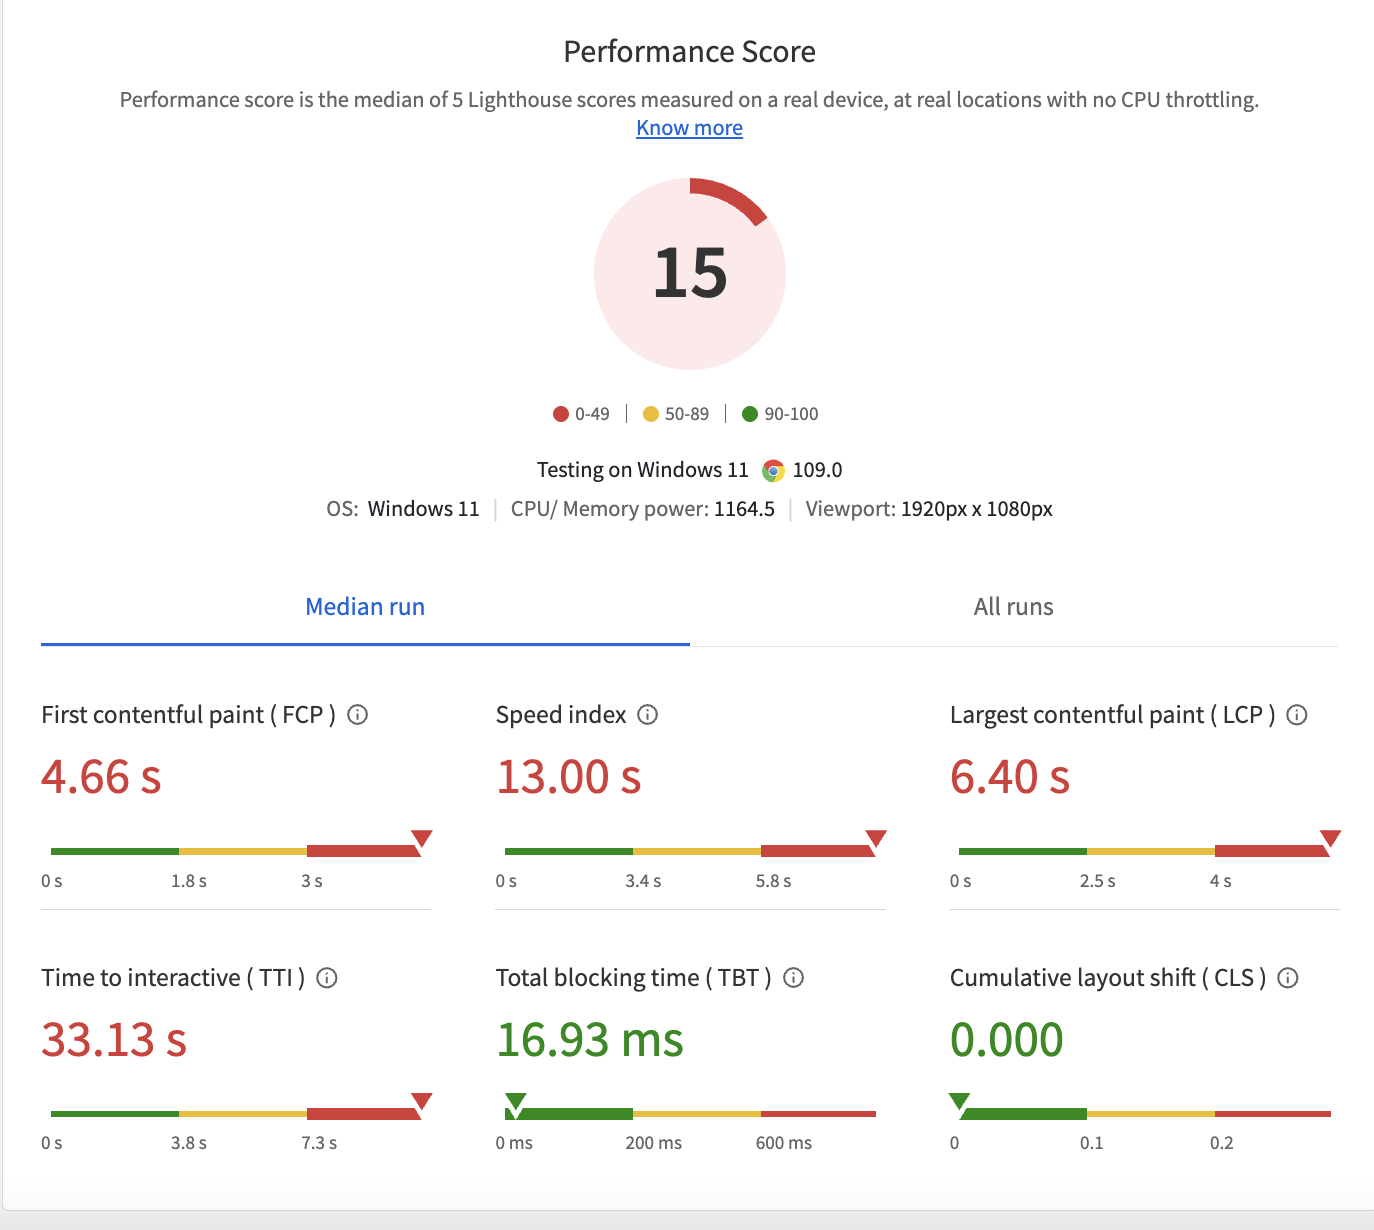
- Largest Contentful Paint (LCP) is a metric that conveys the time it takes to render the largest text block or images within the viewport. The time is judged relative to when the page starts loading.
- First Input Delay (FID) tracks the time from a user’s first interaction with a page (for example, clicking a link or a button to when the browser actually starts to process events handlers to respond to that interaction.
- Time to Interactive (TTI): The time it takes for the page to become fully interactive, meaning all JavaScript has been executed, and the page responds to user inputs. It measures how quickly users can interact with the page.
- Total Blocking Time (TBT): The total amount of time between FCP and Time to Interactive (TTI) during which the main thread is blocked and unresponsive. It Indicates how much time the user is blocked from interacting with the page.
- DNS Lookup Time: The time taken to resolve the domain name into an IP address.
- Connection Time: The time required to establish a connection between the browser and the server.
- Server Response Time: The time the server takes to process the request and send the response.
- Content Download Time: The time required to download all the necessary files and resources (e.g., HTML, CSS, JavaScript, images) from the server.
- Rendering Time: The time the browser takes to render and display the page content, including parsing HTML, applying CSS, and executing JavaScript.
- Interactive Time: The time it takes for the page to become interactive, meaning that all elements are fully loaded, and users can interact with them.
Read More: Key Metrics to Improve Site Speed
How to Check Website Loading Time?
To test website loading time across different devices and browsers, QA teams need a tool that provides reports on key metrics like TTFB, response time, and page load time. That’s where BrowserStack can help.
BrowserStack SpeedLab lets QA testers evaluate website speed on real devices and browsers, providing more accurate and realistic performance data.
Here’s a simple 3 step process to test your website loading speed using SpeedLab for Free:
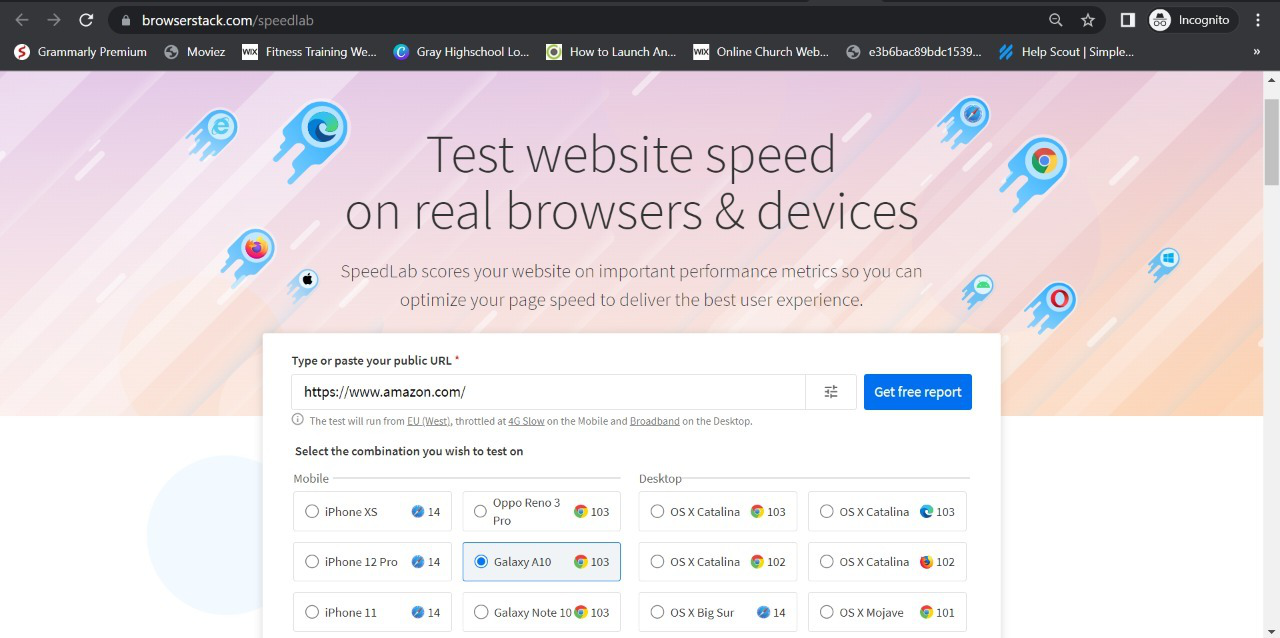
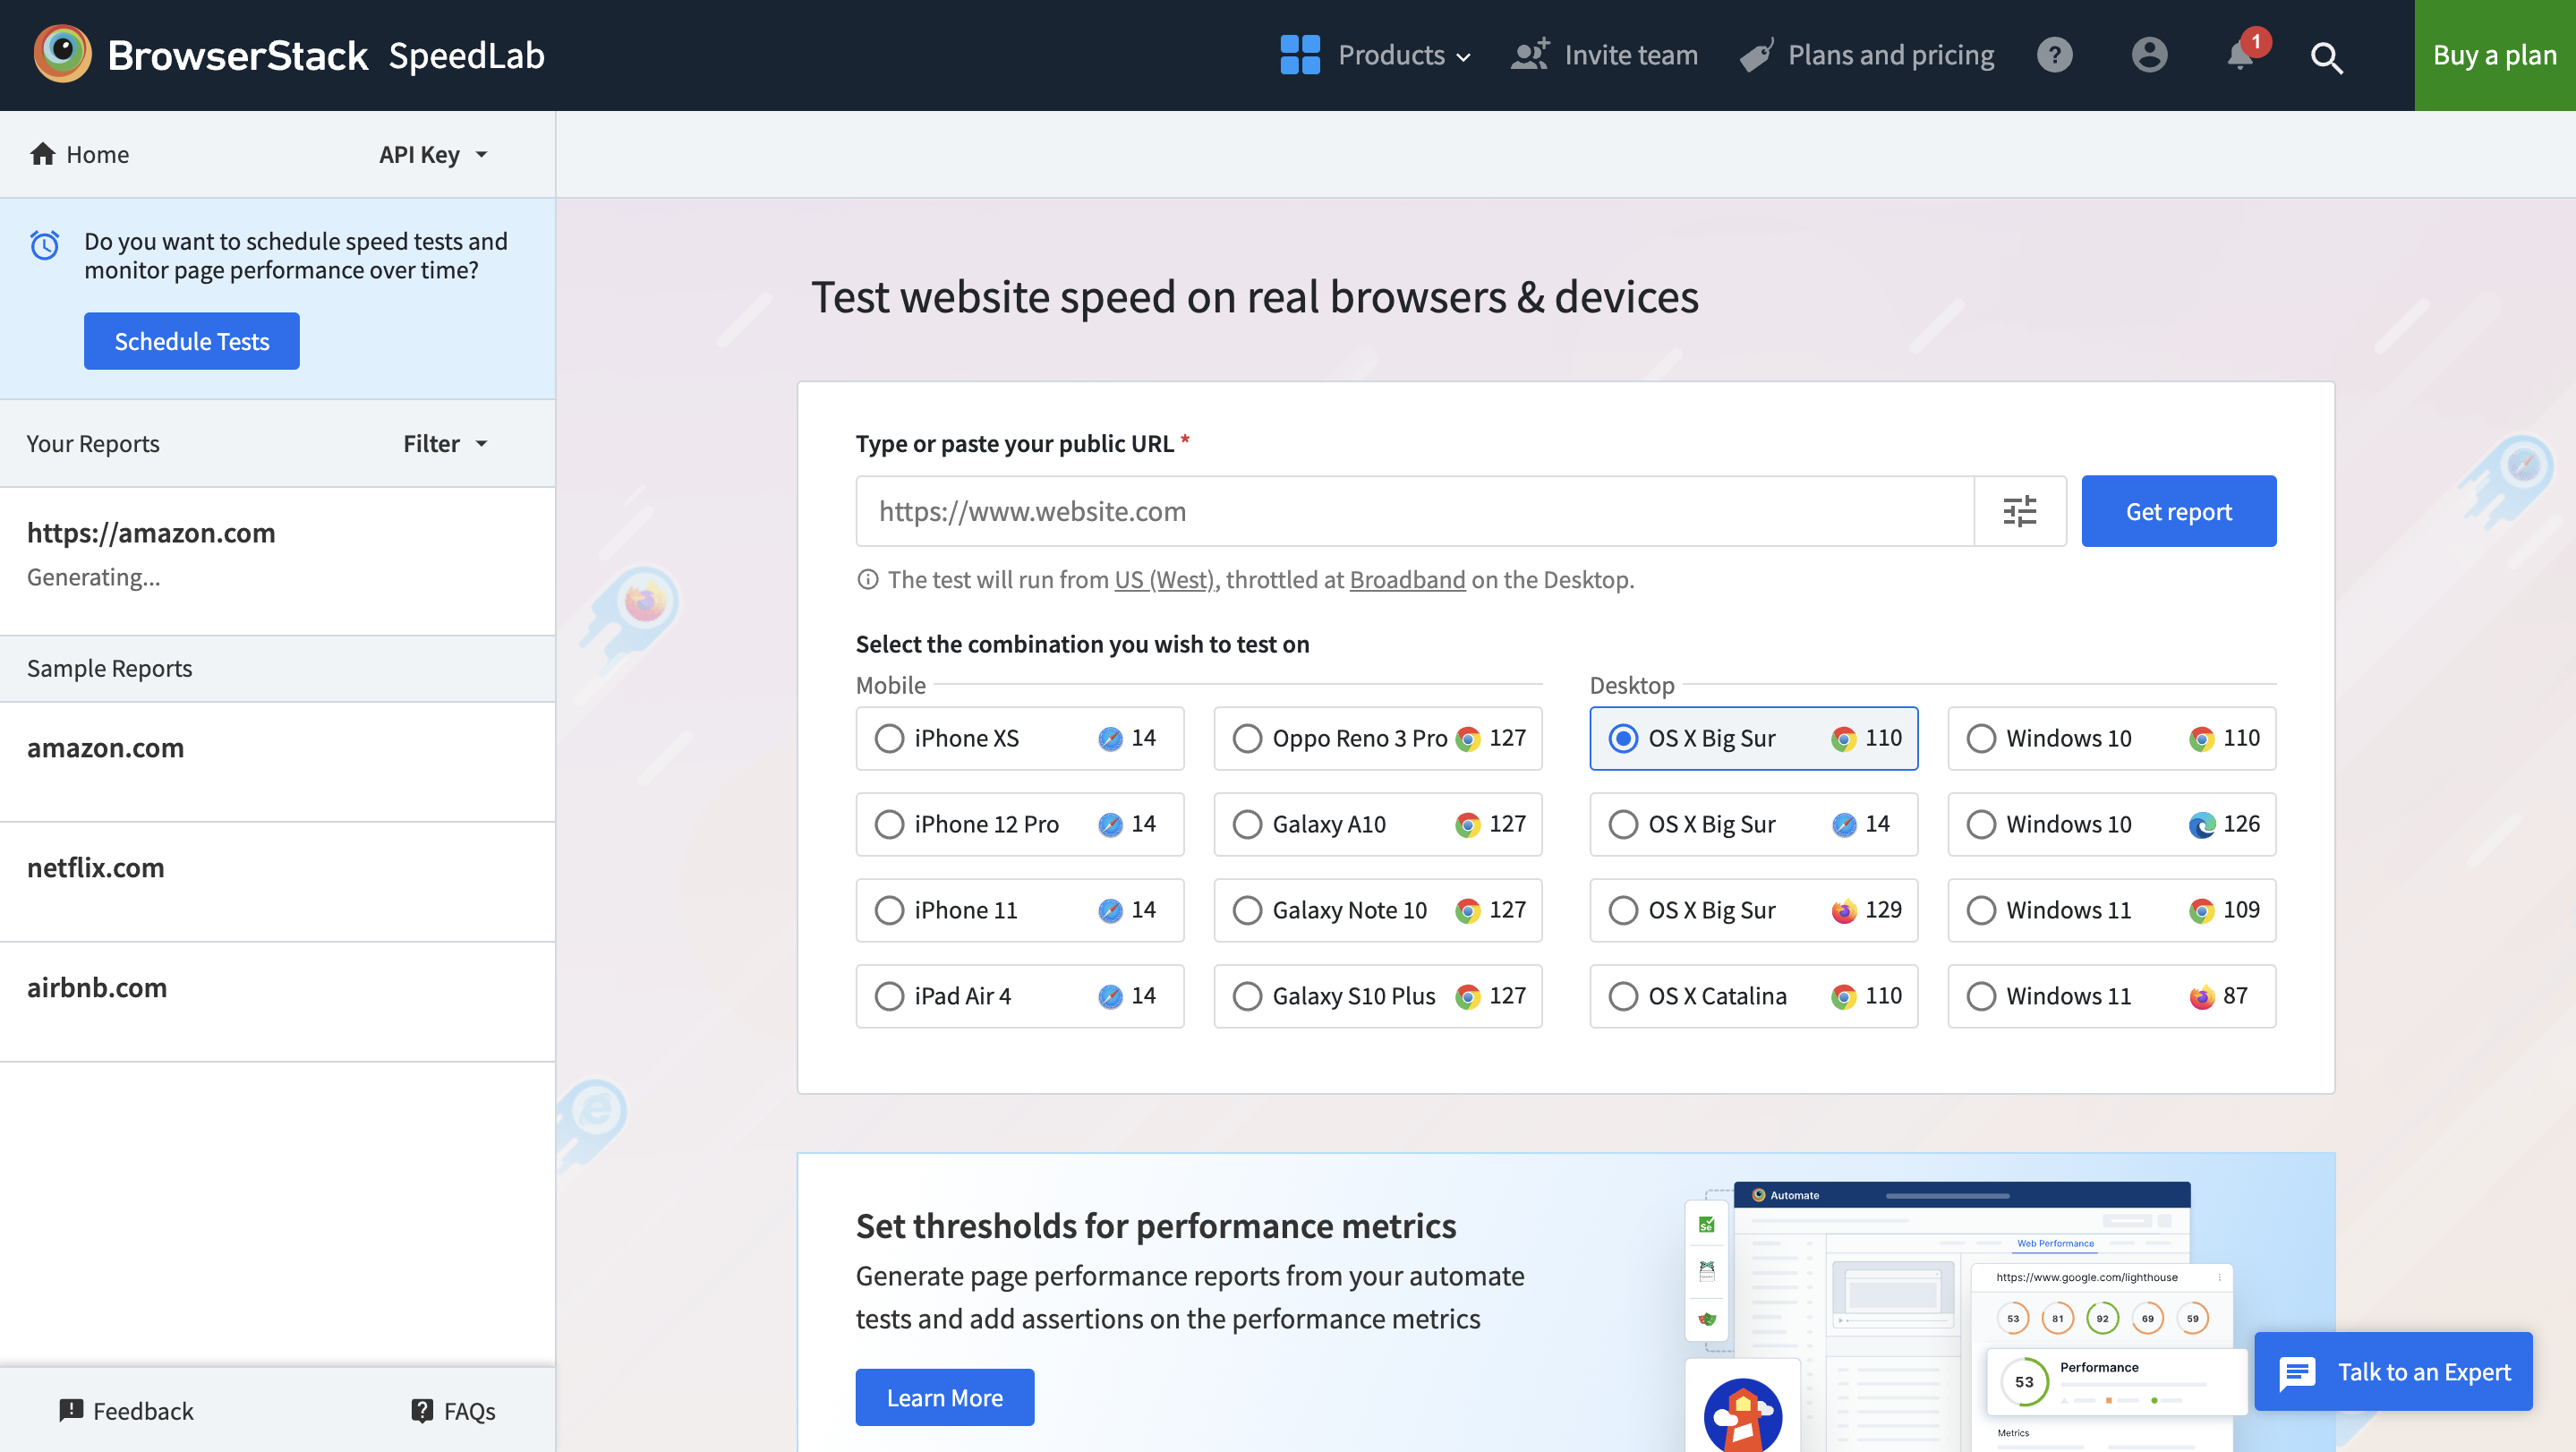
Step 1. Choose your preferred device for testing on SpeedLab
Step 2. Insert your website URL and select a browser for testing
Step 3. Click on “Get Free Report”
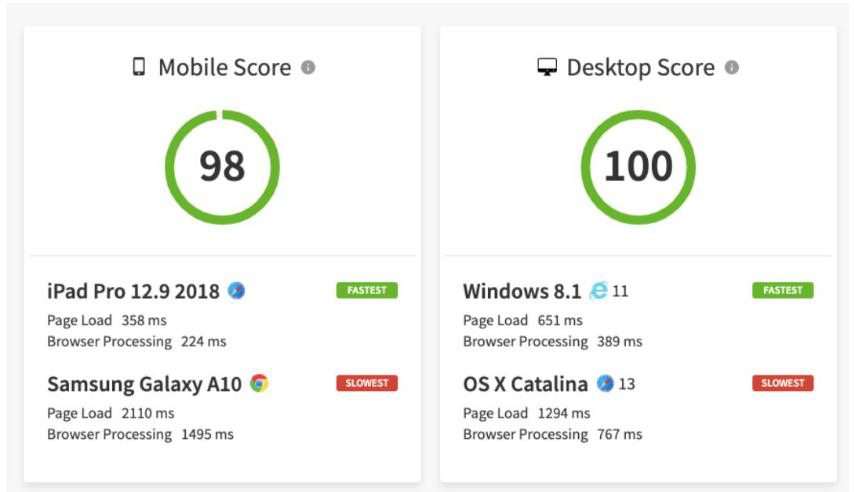
Once you’ve completed the testing process with the selected Browser, a detailed report will be generated that shows complete insights on key metrics such as mobile & desktop speed score, cross-browser compatibility, page load time, and many other factors.
The report covers key metrics for each platform and load time is represented in milliseconds (Refer to the image above). With such extensive detail at hand, teams can instantly analyze performance bottlenecks for specific device-browser combinations.
Users do not need to worry about evaluating separate reports for unique device-browser combinations. This is because SpeedLab collates results for all combinations and presents them in a single report, designed for easy visibility and analysis.
How to Improve the Average Page Loading Time?
Here are a few tips to improve the average Page Loading Time of your website:
- Optimize Images and Media by using image compression tools to reduce file sizes without significant quality loss. Use different image sizes for different devices and modern image formats like WebP for better compression and quality.
- Minimize HTTP Requests by merging multiple CSS and JavaScript files into single files to reduce the number of requests. Use CSS Sprites to combine multiple images into a single sprite sheet to reduce the number of image requests.
- Leverage Browser Caching by setting expiry dates to Cache headers and using cache-control headers by implementing Cache-Control and ETag headers to control caching behavior.
- Use a Content Delivery Network (CDN) to serve static assets (images, stylesheets, scripts) from geographically distributed servers and reduce Latency, hence improving load times.
- Minify and Compress Code by removing unnecessary characters, whitespace, and comments from code to reduce file sizes. Also, enable server-side compression for text-based resources like HTML, CSS, and JavaScript.
- Optimize Server Performance by selecting a high-performance hosting provider that suits your website’s traffic needs. Implement server-side caching solutions and optimize Database Queries.
- Reduce Redirects to avoid additional HTTP requests and delays.
- Defer Loading of Non-Essential Resources by lazy loading of images and iframes to load content only when it’s visible to the user. Use async and defer attributes for JavaScript to prevent blocking the rendering of the page.
Read More: How to Lazy Load Images in Javascript
- Optimize CSS and JavaScript by using Inline critical CSS needed for the initial rendering of the page, and load non-critical CSS asynchronously. Place JavaScript at the bottom of the page or use asynchronous loading to prevent blocking the rendering of HTML.
- Monitor and Analyze Performance by using tools like Google PageSpeed Insights, Lighthouse, or GTmetrix to improve page load times. Continuously monitor performance to identify and address new issues as they arise.
- Improve Web Design and Layout by reducing complexity in web design to minimize rendering times. Use lightweight and efficient frameworks and libraries to avoid unnecessary bloat.
Conclusion
Website loading time directly impacts user experience, engagement, and SEO performance. Track key metrics like TTFB, page load time, response time, and LCP to assess website performance. Then, optimize server speed using caching, minimize resource sizes, and streamline code to improve loading time across devices and browsers to ensure a faster, smoother user experience.
Use BrowserStack Speedlab to test your website’s loading time for free. You’ll then get detailed insights into performance score, core web vitals, and recommendations to optimize page speed.


