How to use App Profiling in UI Testing to improve App Performance?
By Vivek Mannotra, Community Contributor - November 30, 2022
Mobile applications are consumed on mobile devices, of which there are thousands of varieties. Mobile devices are portable computers with limited resources hence app optimization is a necessary part of the development process.
In a modern setup, technologies like hybrid device clouds enable QA teams to multitask and make app profiling a part of the test automation strategy.
Role of App Profiling during Development
For a functional tech product, these are the broad steps in their journey from inception to scale:
- Ideation and market research: The goal here is to identify a business opportunity and focus available resources on capturing the market using technology.
- Prototyping: Building early versions of what the product should be like, building multiple versions with different features, and evaluating them on the ground with real users.
- Building the MVP: Identifying the central functionality and features during the prototyping phase, abstracting them into workflows building a minimum viable product accordingly.
- User testing: Testing the minimum viable product with the prospective user base and assessing production viability and financial viability.
- Launching a beta version: Adding security and business-related functionality to the MVP and launching as a pre-production version.
- Application Profiling and Resource Optimization: Once actual users start using the application, you get a trace of what resources are being consumed and how the devices are reacting to your application.
- Releasing updates: Incorporating outcomes from the profiling exercise into action items for improving the codebase.
In these roughly laid out steps, of course, at any time, you can profile the application resources, but after beta launch, when real users start spending time on the application, that is where you are getting the most realistic information regarding resource consumption.
The last two steps mentioned here are being focussed in the article, as most growing products will routinely work on these two activities in sequence or phases.
Whether you are building a web application or a mobile application, consistently identifying users’ pain points and updating the application accordingly is a prerequisite for smooth scaling.
What is Application Profiling
Application profiling is a process of monitoring the performance of your application under various scenarios and conditions. This helps you understand the behavior of your application under load and identify the areas you need to work on.
This is often overlooked in the early stages of the development journey. Once the application is launched and the user base starts to grow, the application is more likely to go through sudden changes in load patterns.
Many new features are added over time, and additional functionality is built on top of the existing functionality. This can cause the performance of the application to change and often deteriorate if not monitored.
Application profiling can be done in multiple ways. Each platform has a number of different possible approaches. But also, each platform differs from the other hence slightly different ways of profiling apps.
Factors to monitor during Application Profiling
Here is what you should be looking to monitor while profiling apps:
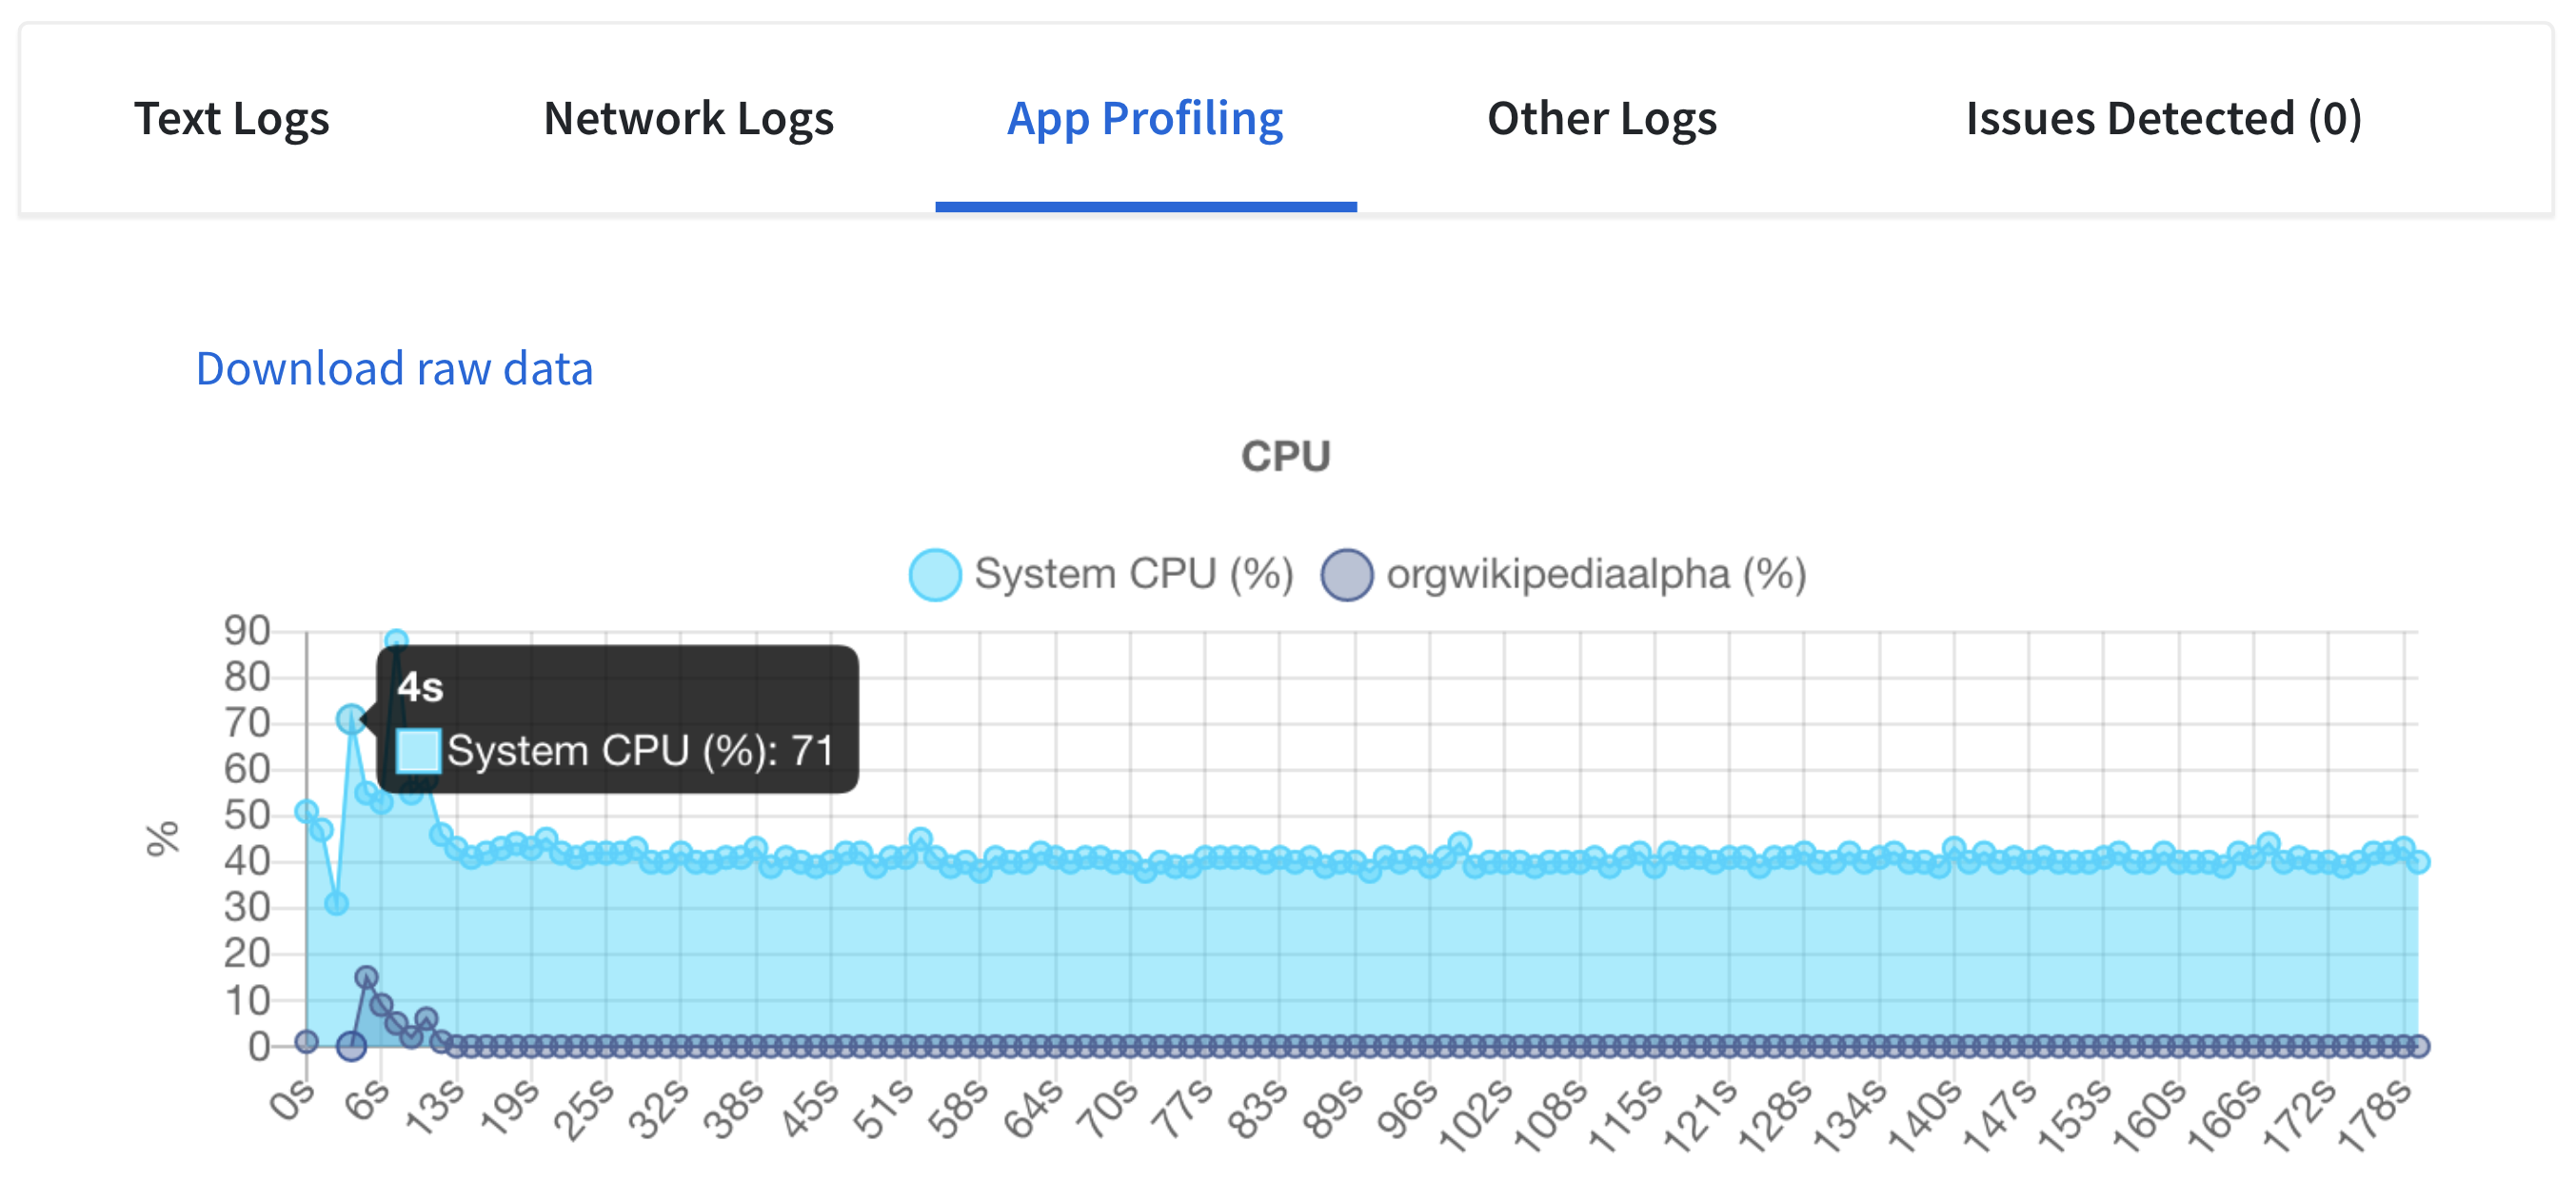
- CPU: Check compatibility with CPU architecture and capacity. Measure percentage usage and thread monitoring. CPU profiling can help identify what parts of the code are taking up the most CPU time.
This can be useful for identifying areas of the code that may be causing performance issues. CPU profiling can also help to identify any potential race conditions that may be causing problems with resource consumption. - Memory: Measure memory impact across cache, system, and hard storage. Memory profiling can help developers identify what parts of their code are using the most memory, which can help them pinpoint where optimization is needed.
Additionally, memory profiling can also reveal memory leaks, which are often responsible for significant resource consumption issues. - Battery: Impact on battery life across different usage patterns. Battery profiling helps developers identify resource-consuming bugs and optimize their apps to improve battery life.
- Network: The amount of data downloaded/uploaded and the aggregate network consumption. Network profiling can help identify which parts of an app are using the most data, which can help pinpoint areas where there may be issues with resource consumption. Additionally, network profiling can also help identify potential bottlenecks in an app’s networking performance and cost.
Some of these factors are not completely independent, as optimizing one of these could result in better outcomes for the others as well. Profiling is especially important for studying resource consumption and response times during key events like:
- App Startup / Website load
- Feed / Dashboard render time
- Screen transitions and navigation events
- Long-running work on the app
- Operations in the background, such as I/O and networking
Profiling Web Apps
Profiling web applications is an activity that can be performed relatively easily, and there are plenty of tools available for you to get into the weeds of how your application interacts with the system underneath it.
By default, you can use the developer tools section of any popular web browser to get access to tools that can help you profile, analyze and debug various aspects of your application.
You can find detailed documentation for developer tools on Chrome, Safari, Firefox, and Edge.
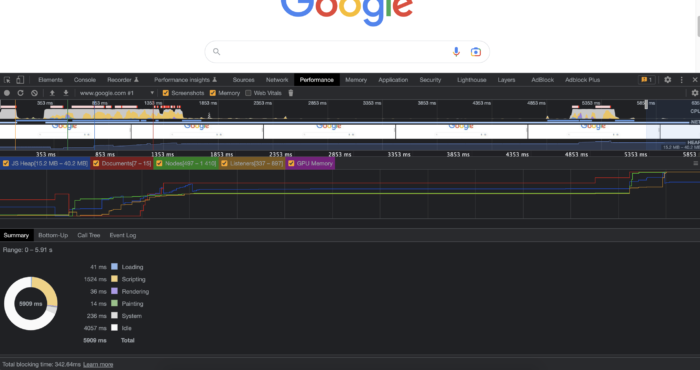
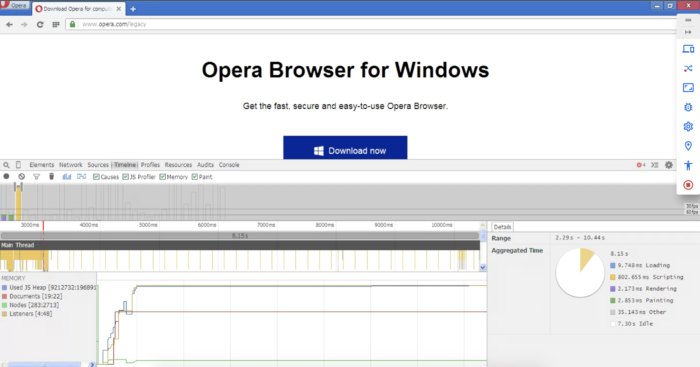
Performance profile in chrome dev tools
The challenge for web developers is to find access to physical devices on which a given website has to be profiled. Although there is a mobile device simulator built into chrome, it is not the same as accessing dev tools on the actual device, and hence the two cannot be considered equally useful.
Having access to BrowserStack Live device cloud can enable you to test on any possible device browser combined with a layer of advanced features like network throttling, geolocation control, etc., built in.
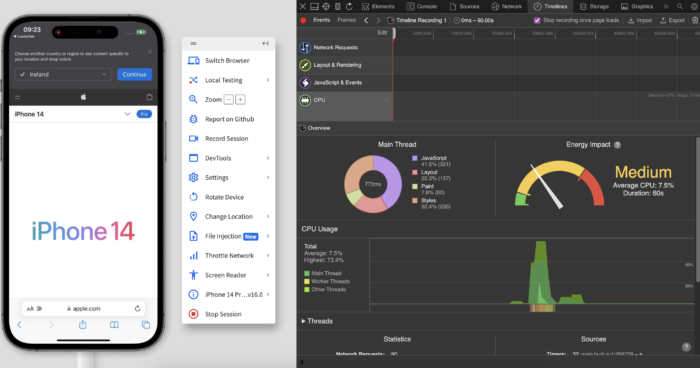
Inspect websites on real devices with developer tools
And not only can you test on the latest and greatest devices, but you also get the ability to check for legacy compatibility on systems such as Windows XP and Mac Snow Leopard onwards.
Test on the latest and legacy systems with Live
For web applications, CPU and battery consumption will be clocked under the browser app and not the specific website that you are visiting hence some more breakdown is required to gather data on these two variables.
Profiling Android Apps
Android Studio has built-in tools for profiling apps and measuring resource consumption across the above-mentioned criteria. You get access to the CPU profiler, network profiler, memory profiler, and battery profiler.
Android official documentation provides details and step-by-step instructions on how to implement each type of analysis. The point to be noted here is that in order for some analysis, you need to spin up an emulator and then profile on the emulator.
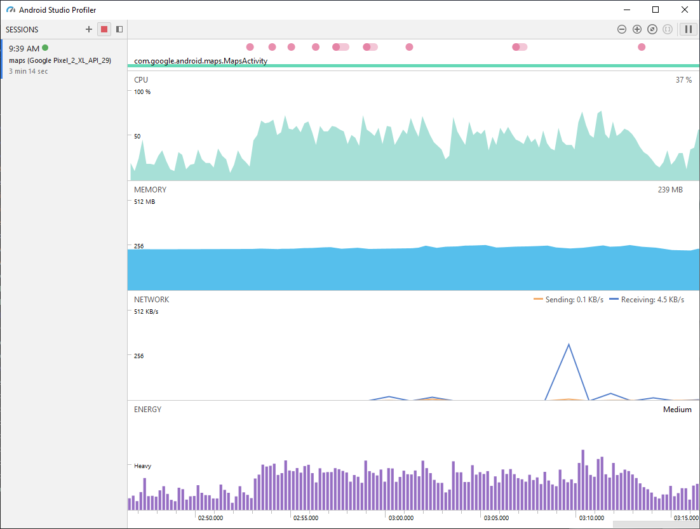
Android profiler recorded a session with Google maps running on an emulated device
If you want to profile on a real device, you can use a USB debug connection with a physical android device. If you do not have access to the right devices, you can instead access BrowserStack App Live, which provides access to a majority of devices available in the market.
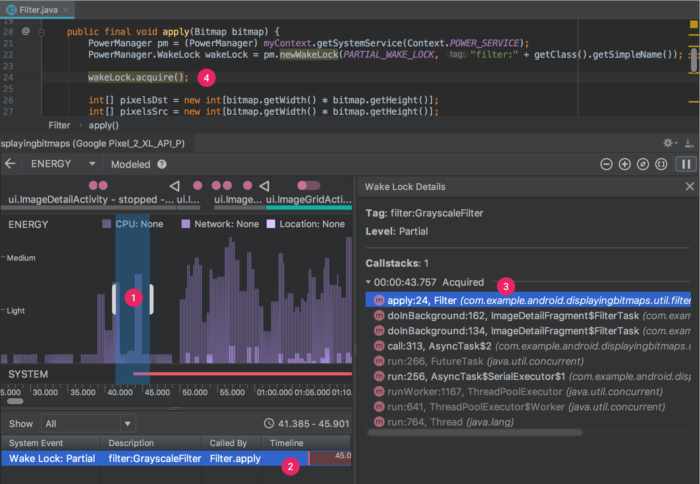
Energy profiler interface to debug a wake lock scenario in android
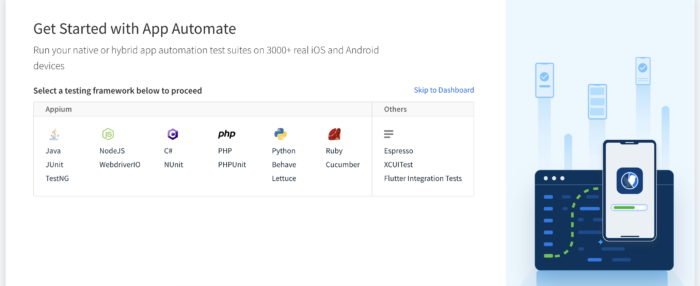
With App Automate you can implement test cases using the automation framework of your choice. And when you execute your automation scripts, the test results are displayed on the browser stack dashboard.
- Sign up for a free account on BrowserStack Automate
- Login to the dashboard and follow the quick integration choice with the language of your choice
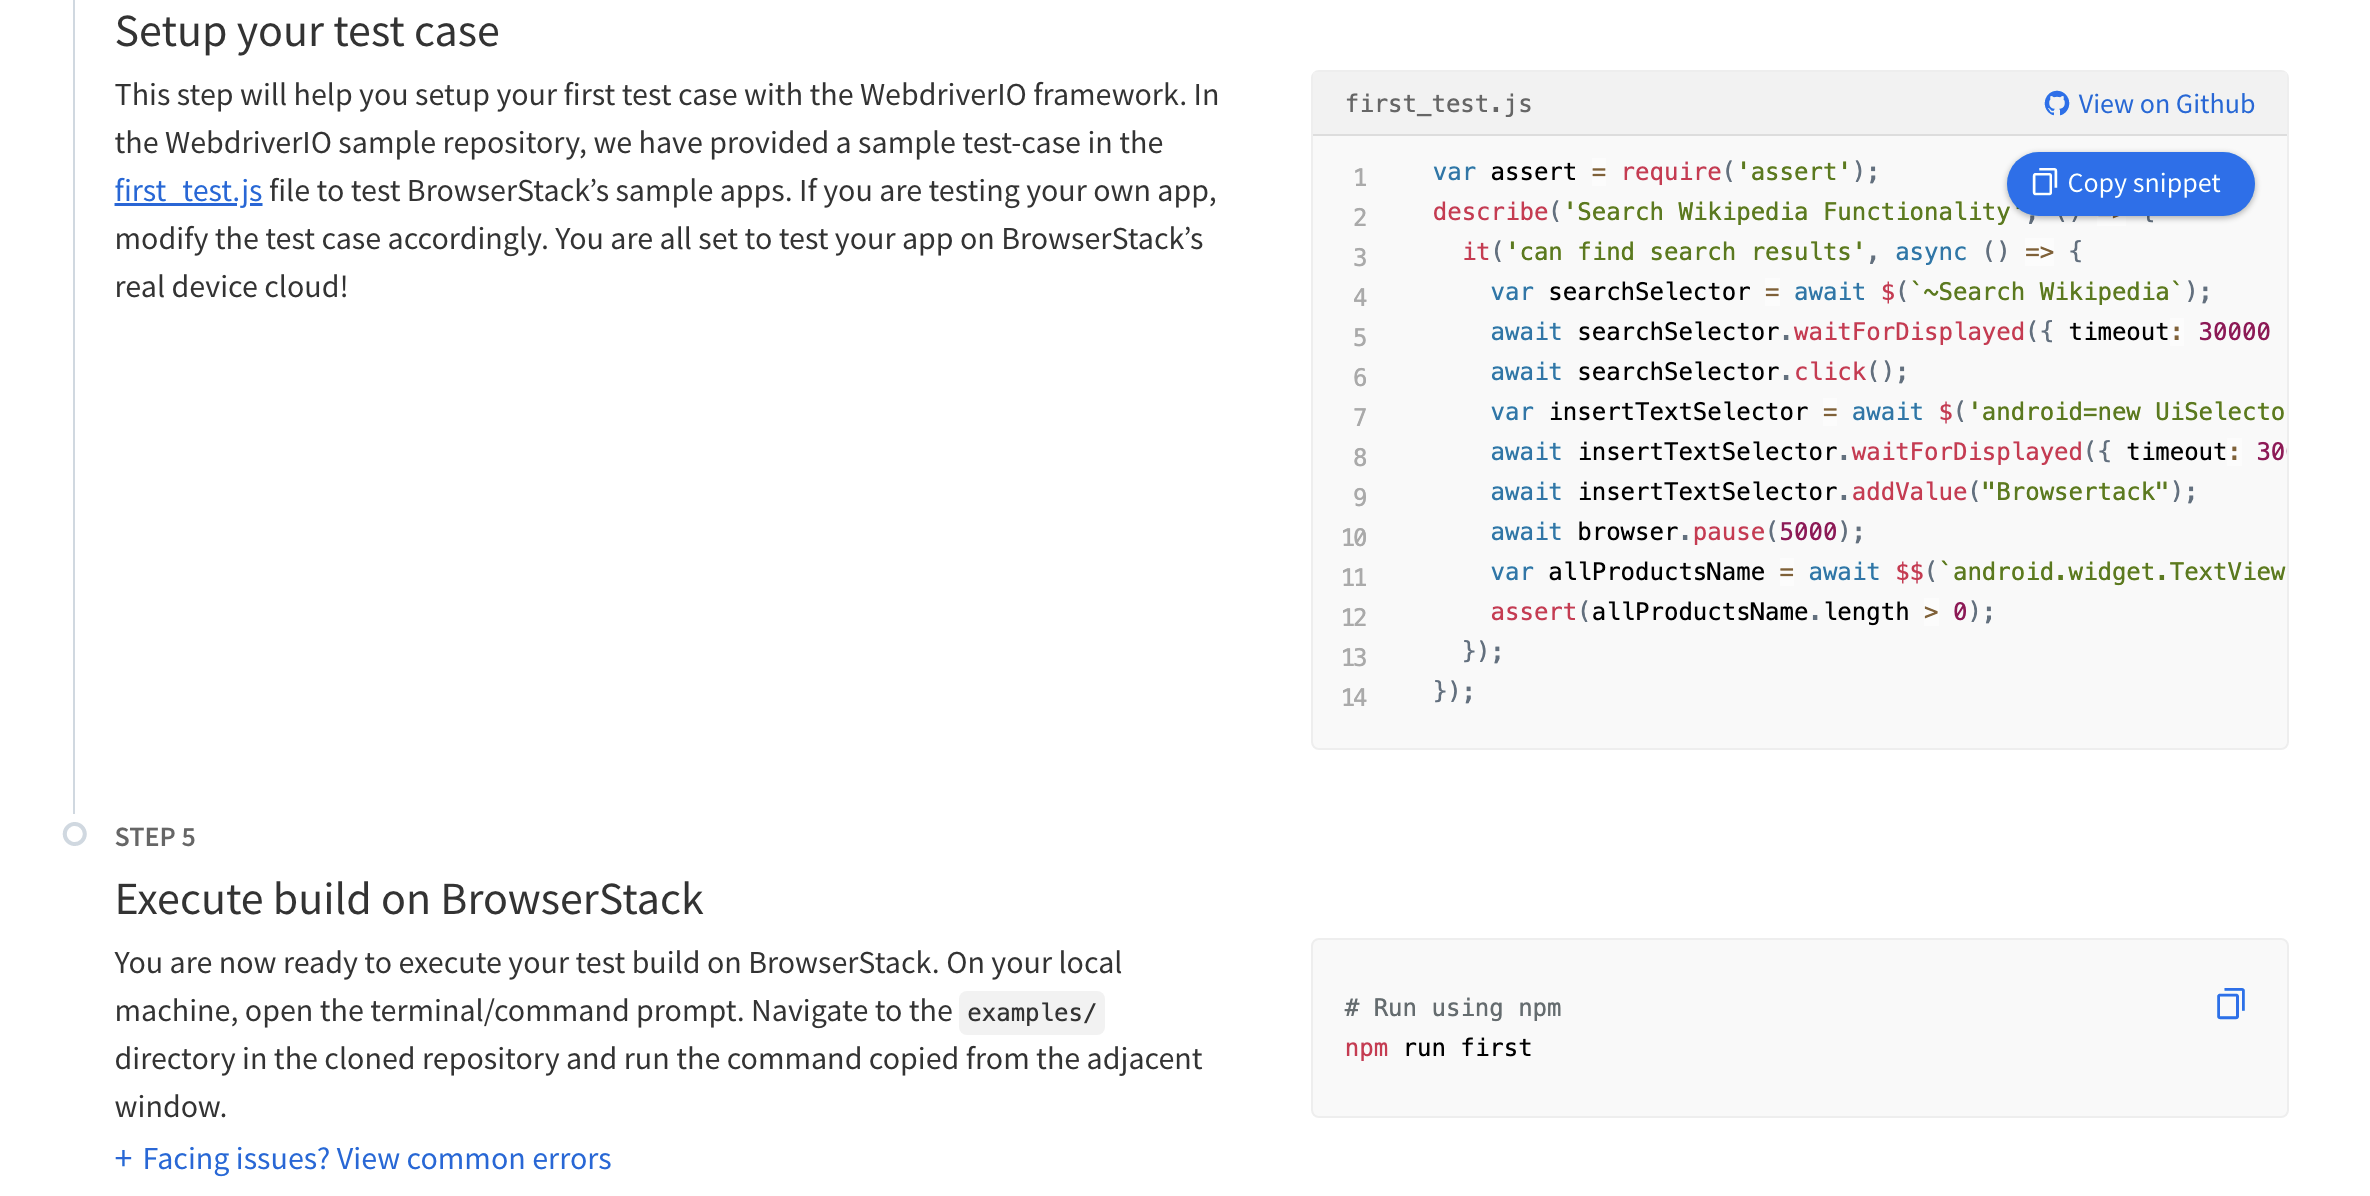
- Upload your app, get BrowserStack access token and write your first test script.
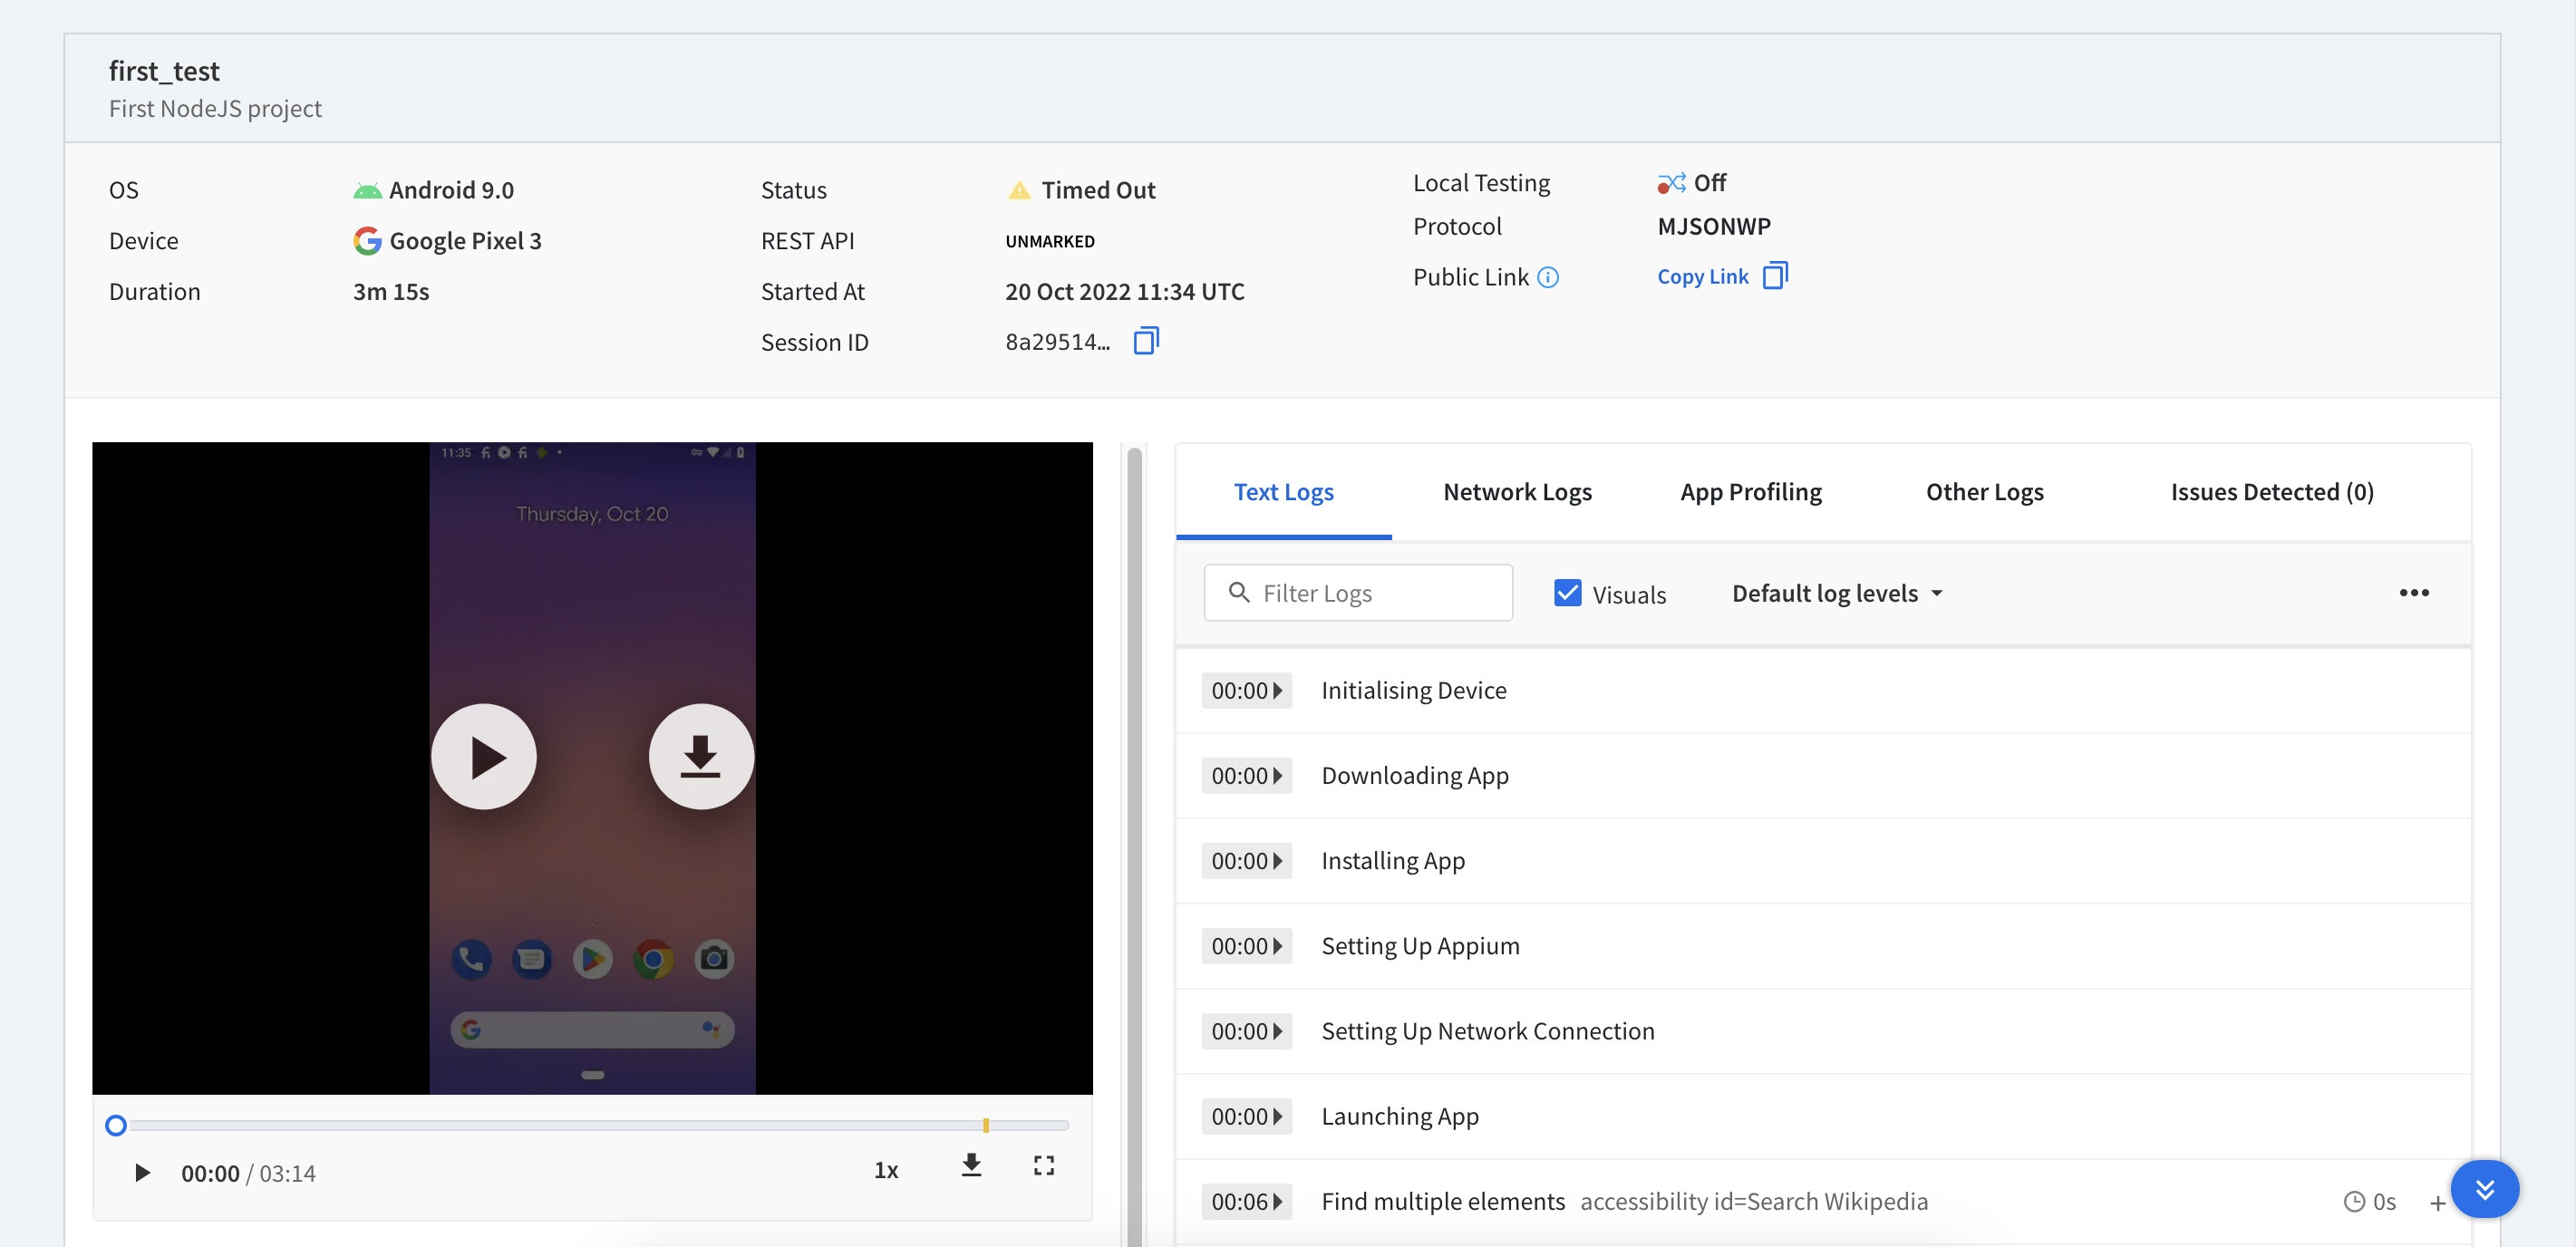
- Execute the test and check for results on the App Automate Dashboard
- Use the App profiler to debug resource consumption as required:
- Slow performance, battery drainage, overheating, and app crashes are some of the main issues caused by improper CPU utilization in android applications.
- Improper memory utilization can cause a number of issues in android applications, including memory leaks, poor performance, stuttering or choppy app behavior, and apps crashing or freezing.
- One of the most common issues is that improper battery utilization can cause your phone to overheat. This can lead to all sorts of problems, including data loss, a shortened battery life, and even damage to your phone.
- Improper network utilization can lead to a number of issues, including data breaches, data loss, and decreased performance.
With the test run, you get all the details, including the recording of the session and the profile of resource consumption which can help you debug and fix issues.
Profiling iOS Apps
For iOS applications, profiling is not supported on BrowserStack yet. Because of tight constraints around developer workflow in Apple’s ecosystem, the best way to approach app profiling for iPad and iPhone applications is to use native tools built into Xcode.
It is important to profile resources while developing applications for web and mobile in order to identify performance bottlenecks and optimize application performance. Resource profiling can help developers to improve application responsiveness, reduce memory footprint and improve overall user happiness.
Hybrid cloud technologies like BrowserStack Live and App Automate provide developers with an easy way to manage, profile and debug their applications.
