How to Analyze Data to Predict Device Coverage
By Sakshi Pandey, Community Contributor - September 30, 2022
Designing an application is backbreaking work. Consider that after all that work and time creating a complex piece of software, it all amounts to nothing. Upon release, most customers are unable to use the application as it’s not functional on most devices.
This constitutes a major loss of revenue. Therefore, it’s essential for developers to take into consideration compatibility when designing applications.
Instead of guessing the devices that may represent their target audience, the developer teams need to use data analytics to understand what their consumer market truly looks like and increase device coverage for their application. This guide describes data analysis strategies to accurately predict the device coverage for an application and address any issues prior to release.
Understanding Device Fragmentation
Device fragmentation can best be defined as such: There are multiple devices, browsers, and operating systems. Every user can have a different device and use a different browser or a different OS with different versions. This indicates that the potential user market for an application can have a plethora of potential combinations of devices, browsers, OS, and other software.
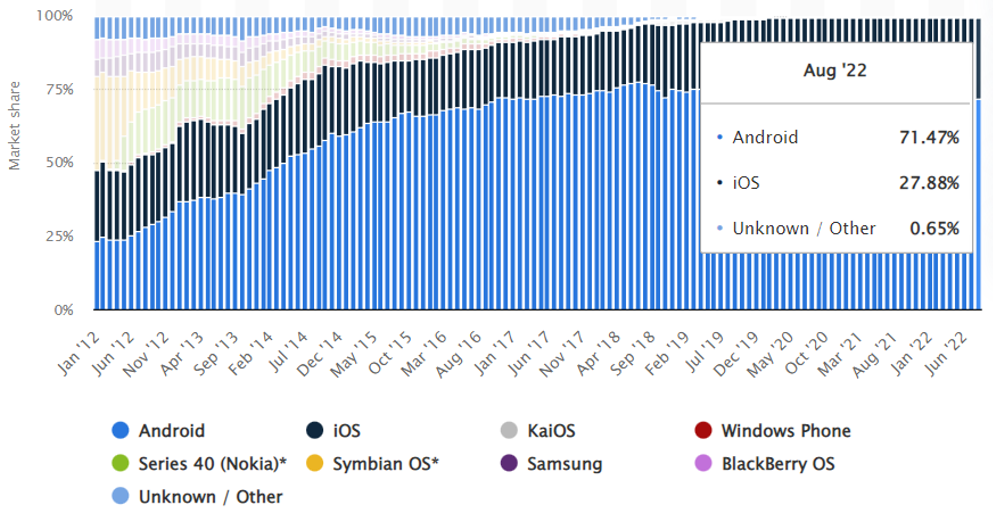
The two most popular OS today, illustrated in the figure above, are iOS and Android. As of August 2022, Android dominates with a market share of 71.47%, with iOS coming in second with a market share of 27.88%.
All iOS devices receive new releases and upgrades simultaneously unless there are hardware compatibility issues. It can be seen that as of August 2022, 73.18% of iOS users are on version 15.6 or 15.5.
Unfortunately, although Google regularly releases updates for Android; Most users with Android devices aren’t on the most current version of the OS. Where iOS controls its software releases, phone manufacturers control the Android versions offered on their devices; Often, new Android devices have highly outdated versions of Android installed.
The latest Android version as of August 2022 was 12.0. However, it can be seen that it is not the most used version. Android 11.0, an outdated version released in 2020, is the most used Android OS version.
In fact, 76.42% of Android device users are on antiquated OS versions, as a result of which they are surely more susceptible to malware and other security flaws. This inevitably puts a greater burden of responsibility on application developers who have to create software for these out-of-date OS versions.
Looking at this data, it’s clear why the device fragmentation problem is an absolute nightmare for application developers. When it comes to fragmentation, the iOS market share is manageable. However, the Android market share is the largest and the most problematic. With the multitude of versions, users, and devices, the Android fragmentation problem should be taken into consideration when attempting to achieve greater data coverage for a software application.
How to Analyze Data to Infer Potential Device Coverage
There are several facets that need to be taken into consideration when attempting to obtain maximum device coverage for a software application.
For a pre-existing application, it is possible to collect data regarding the users’ devices and attempt to increase coverage on that basis. However, survivorship bias will come into play since the user traffic will be from devices that can already support and run the application; Therefore, this method of data collection won’t suffice.
Using market data to carry out analysis would be most optimal to infer device coverage.
One method to carry out data analysis could be to identify the target customer base for the application in question. Based on this further device groups can also be created on the basis of the goals of the application and the technologies used.
In some cases, mobile device manufacturers make customizations in the Android architecture to enhance the user experience; This is done by using custom ROM[1]. By introducing these changes to the lower level system architecture, there will also be changes introduced in the higher level system. This leads to compatibility issues since the API will have difficulty communicating with the device drivers.
Numerous companies, including Xiaomi, One Plus, Huawei, and others, regularly release new smartphones with customized ROMs[1].
It may be pertinent to identify and obtain market data regarding brands that are prone to making these changes and identify the application’s functionality across these devices. Eventually, it may be reasonable to determine which of these devices has a sizable enough market share that it is advantageous to adapt the application to run on them.
Another method to predict device coverage could be to collect research data for pre-existing applications which have similar functionality and design. This data could include information regarding users’ devices, OS versions, and browser usage.
By observing the market share of users and device coverage for reference applications, it’s possible to obtain a rough estimate for the application being designed. The data can be segmented to identify which devices are covered and which are not, and further analysis could be carried out to identify which devices, that fall under the target customer base, are not covered.
If a specific application can’t be found, more generic applications can also be used since this data analysis is being performed to simply gauge the potential device coverage.
Also Read: How to approach Cross Platform Testing
Popular Data Sources for Data Analysis
There are several potential data sources that can be used to carry out the data analysis processes detailed above.
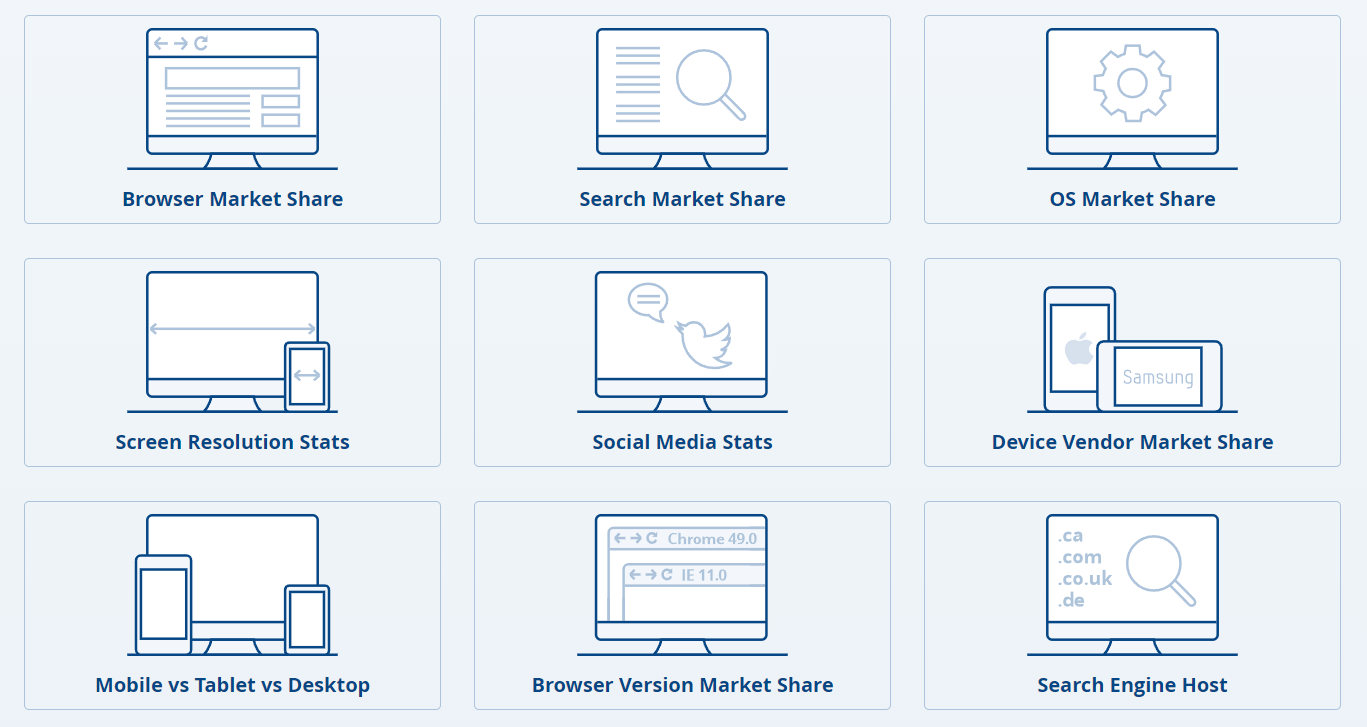
1. https://gs.statcounter.com/ : This website offers statistics regarding market shares for device vendors, OS, and various other components which may be useful for compatibility testing. The statistics available on this website are based on aggregate information gathered by Statcounter from over 1.5 million websites, representing a sample of over 5 billion pageviews every month. Every day, statistics are updated and made available, but they are also subject to quality control checks and revisions for 45 days after publication.
2. statista.com : Statistics on more than 80,000 topics are compiled by Statista.com from more than 22,500 sources. This website offers useful infographics and research with references for market data. This is yet another helpful tool for exploring and contrasting mobile device models, features, and traffic analysis.
3. deviceatlas.com : DeviceAtlas offers a method for detecting devices accessing online material. All firms who wish to optimize revenue from their applications require knowledge pertaining to devise traffic.
Must Read: Test on the right mobile devices
Testing to Ensure Device Compatibility and Coverage
In order to ensure that the application being designed has sufficient device coverage, it is imperative to test early and to test continuously. To keep up with the thousands of device/OS combinations released every year, you can use tools like BrowserStack.
With BrowserStack Automate, you can integrate with several popular automation frameworks such as Selenium, Cypress, Playwright, Puppeteer, and more to carry out testing across 3000+ desktop browsers and real mobile devices. BrowserStack offers integration with several continuous integration tools like Jenkins, Bamboo, TravisCI, and several others so that continuous testing can be carried out to keep your application relevant and functional across all new releases.
