Automation Test Debugging
Identify & fix issues in automated tests through Automation Test debugging.
Run your tests and capture all logs to debug interactively for faster fixing of issues.
Trusted by more than 50,000 customers globally
Automation Test Debugging using rich artifacts
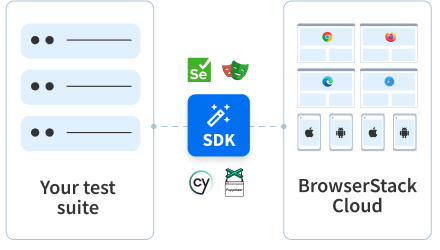
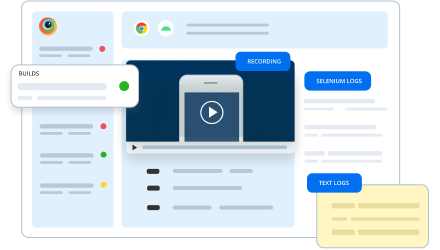
Access all logs including text, console, network, screenshots, and video recording logs through the dashboard or API, or, use breakpoints to debug interactively to pinpoint issues faster.

How to perform Automation Test Debugging
You can perform Automation Test Debugging easily with few steps
- Open your browserstack.yml file for the project in your development environment.
- Set the debug capability to true.
- Run your tests and check your dashboard to view screenshots.
The Text Logs, Visual Logs, Video Logs, Selenium Logs, and Appium Logs are set to true by default. Start accessing them on the Automate dashboard as soon as you run your tests.

Features
Text/Visual/Video Logs
Capture Text/Visual/Video Logs to deep dive and find root cause of error to fix it faster and efficiently by comparing before/after
Framework Logs
View the Selenium, Appium, & Cypress frameworks-specific logs for insight into the cause of test failure.
Terminal Logs
Upload & view your Selenium/Appium terminal logs using REST API with BrowserStack Automate.
Telemetry Logs
With Selenium 4 and OpenTelemetry support, you get greater visibility into the tracing of requests and event logs for each request.
Console Logs
Troubleshoot JavaScript issues with Console logs by retrieving them using Automate dashboard & REST API to access console logs.
Network Logs
Capture browser’s performance data, like network traffic, latency, HTTP requests & responses in HAR format with Network logs.
Frequently Asked Questions
Automation Test Debugging is essential to maintain the reliability and effectiveness of your automated tests lifecycle. It involves identifying the issues by accessing logs, iterating the resolutions, and re-running tests to ensure the issues are fixed.
By implementing automation test debugging, you can ensure test reliability that your test automation process functions as intended. It also reduces the maintenance time since debugging ensures that issues are caught before application can go into production. Overall, employing various robust automation test debugging strategies ensures that your customer experience remains free of defects and increases their confidence in the product.
BrowserStack provides multiple automation debugging artifacts by default, such as:
- Selenium Logs
- Appium Logs
- Text Logs
- Visual Logs
- Video Logs
- Telemetry Logs
- Console Logs
It also provides additional logs such as Network Logs, Screenshots, and Interactive sessions.
While many of the essential logs and features are enabled by default and available out of the box on the Automate dashboard as soon as you run a test, you can also access additional logs by setting the capability to true in your browserstack.yml configuration file.
BrowserStack Automate doesn’t just supply you with rich artifacts, such as Text Logs, Visual Logs, Video Logs, etc, it also helps you generate reports and send out test summaries regularly. With Interactive sessions, you can also add a breakpoint to pause your automated tests at the point of where the issue occurred, and continue running the test manually to debug accurately.
Perform Automation Test Debugging
Access to rich artifacts and detailed debugging options, for faster and efficient automation test debugging

