Debugging Options
You can use various logging options to debug your failed test cases and fix them with ease.
This document explains the capabilities for enabling the different debugging options that Automation Grid supports.
Text logs
These are a comprehensive record of your test. They are used to identify all the steps executed in the test and troubleshoot errors for the failed step. Text Logs are accessible from the Builds dashboard for each session.
You don’t need to set any options for text logs, as these are enabled by default, and cannot be disabled.
Video logs
Every test run on your grid is recorded exactly as it is executed on your browser node, even in headless mode! This feature is particularly helpful whenever a browser test fails, so you can see the entire test in action. You can access these videos from the Builds dashboard for each session. You can also download the videos from the Dashboard.
Video logs are enabled by default. Note that video recording increases the text execution time slightly. You can disable them by using the video capability.
| Capability | Description | Expected values |
|---|---|---|
video |
Enable video recording | A string. Defaults to true true if you want to enable the video recording. false otherwise. |
For example, this is how you disable video logs:
// Disabling video logs

MutableCapabilities capabilities = new MutableCapabilities();
HashMap<String, Object> browserstackOptions = new HashMap<String, Object>();
browserstackOptions.put("video", "false");
capabilities.setCapability("bstack:options", browserstackOptions);
// Disabling video logs

var capabilities = {
	'bstack:options' : {
		"video" : "false"
	}
}
// Disabling video logs

Dictionary<string, object> browserstackOptions = new Dictionary<string, object>();
browserstackOptions.Add("video", "false");

capabilities.AddAdditionalOption("bstack:options", browserstackOptions);
# Disabling video logs

$caps = array(
	'bstack:options' => array(
		"video" => "false"
	)
)
# Disabling video logs

desired_cap = {
	'bstack:options' : {
		"video" : False
	}
}
# Disabling video logs

capabilities = {
	'bstack:options' => {
		"video" : "false"
	}
}
Selenium logs
Selenium logs capture information about every Selenium command in your test script along with the browser preferences that you have configured. These logs provide insight into anything that might have led to your tests failing. You can access these logs on the Builds dashboard for each session.
Selenium logs are enabled by default. Set the frameworkLogs capability under bstack:options to false to disable framework logs for Selenium sessions.
| Capability | Description | Expected values |
|---|---|---|
frameworkLogs |
Enable Selenium logs | A string. Defaults to true. Set to false to disable framework logs for Selenium sessions. |
Console logs
Console Logs capture the browser’s JS console output at various steps of the test to troubleshoot JavaScript issues. You can retrieve Console logs using both the Builds dashboard, as well as the REST API to access console logs. Currently, this works only for Chrome browsers.
Console logs are enabled by default and are set to errors. You can disable them, or change verbosity options by using the console capability under bstack:options.
| Capability | Description | Expected values |
|---|---|---|
console |
Level of console logs to capture | A string. Defaults to errors disable to disable console logs. errors to capture errors. warnings to capture warnings and errors. info to capture info, warnings and errors. verbose to capture everything |
Network logs
Network Logs capture the browser’s performance data such as network traffic, latency, HTTP requests and responses in the HAR format. You can download network logs using both the Automate TurboScale dashboard, as well as the REST API to access network logs. You can visualize HAR files using the HAR Viewer.
When you run a test without the network log settings, the Network Logs tab on the dashboard shows the following message:
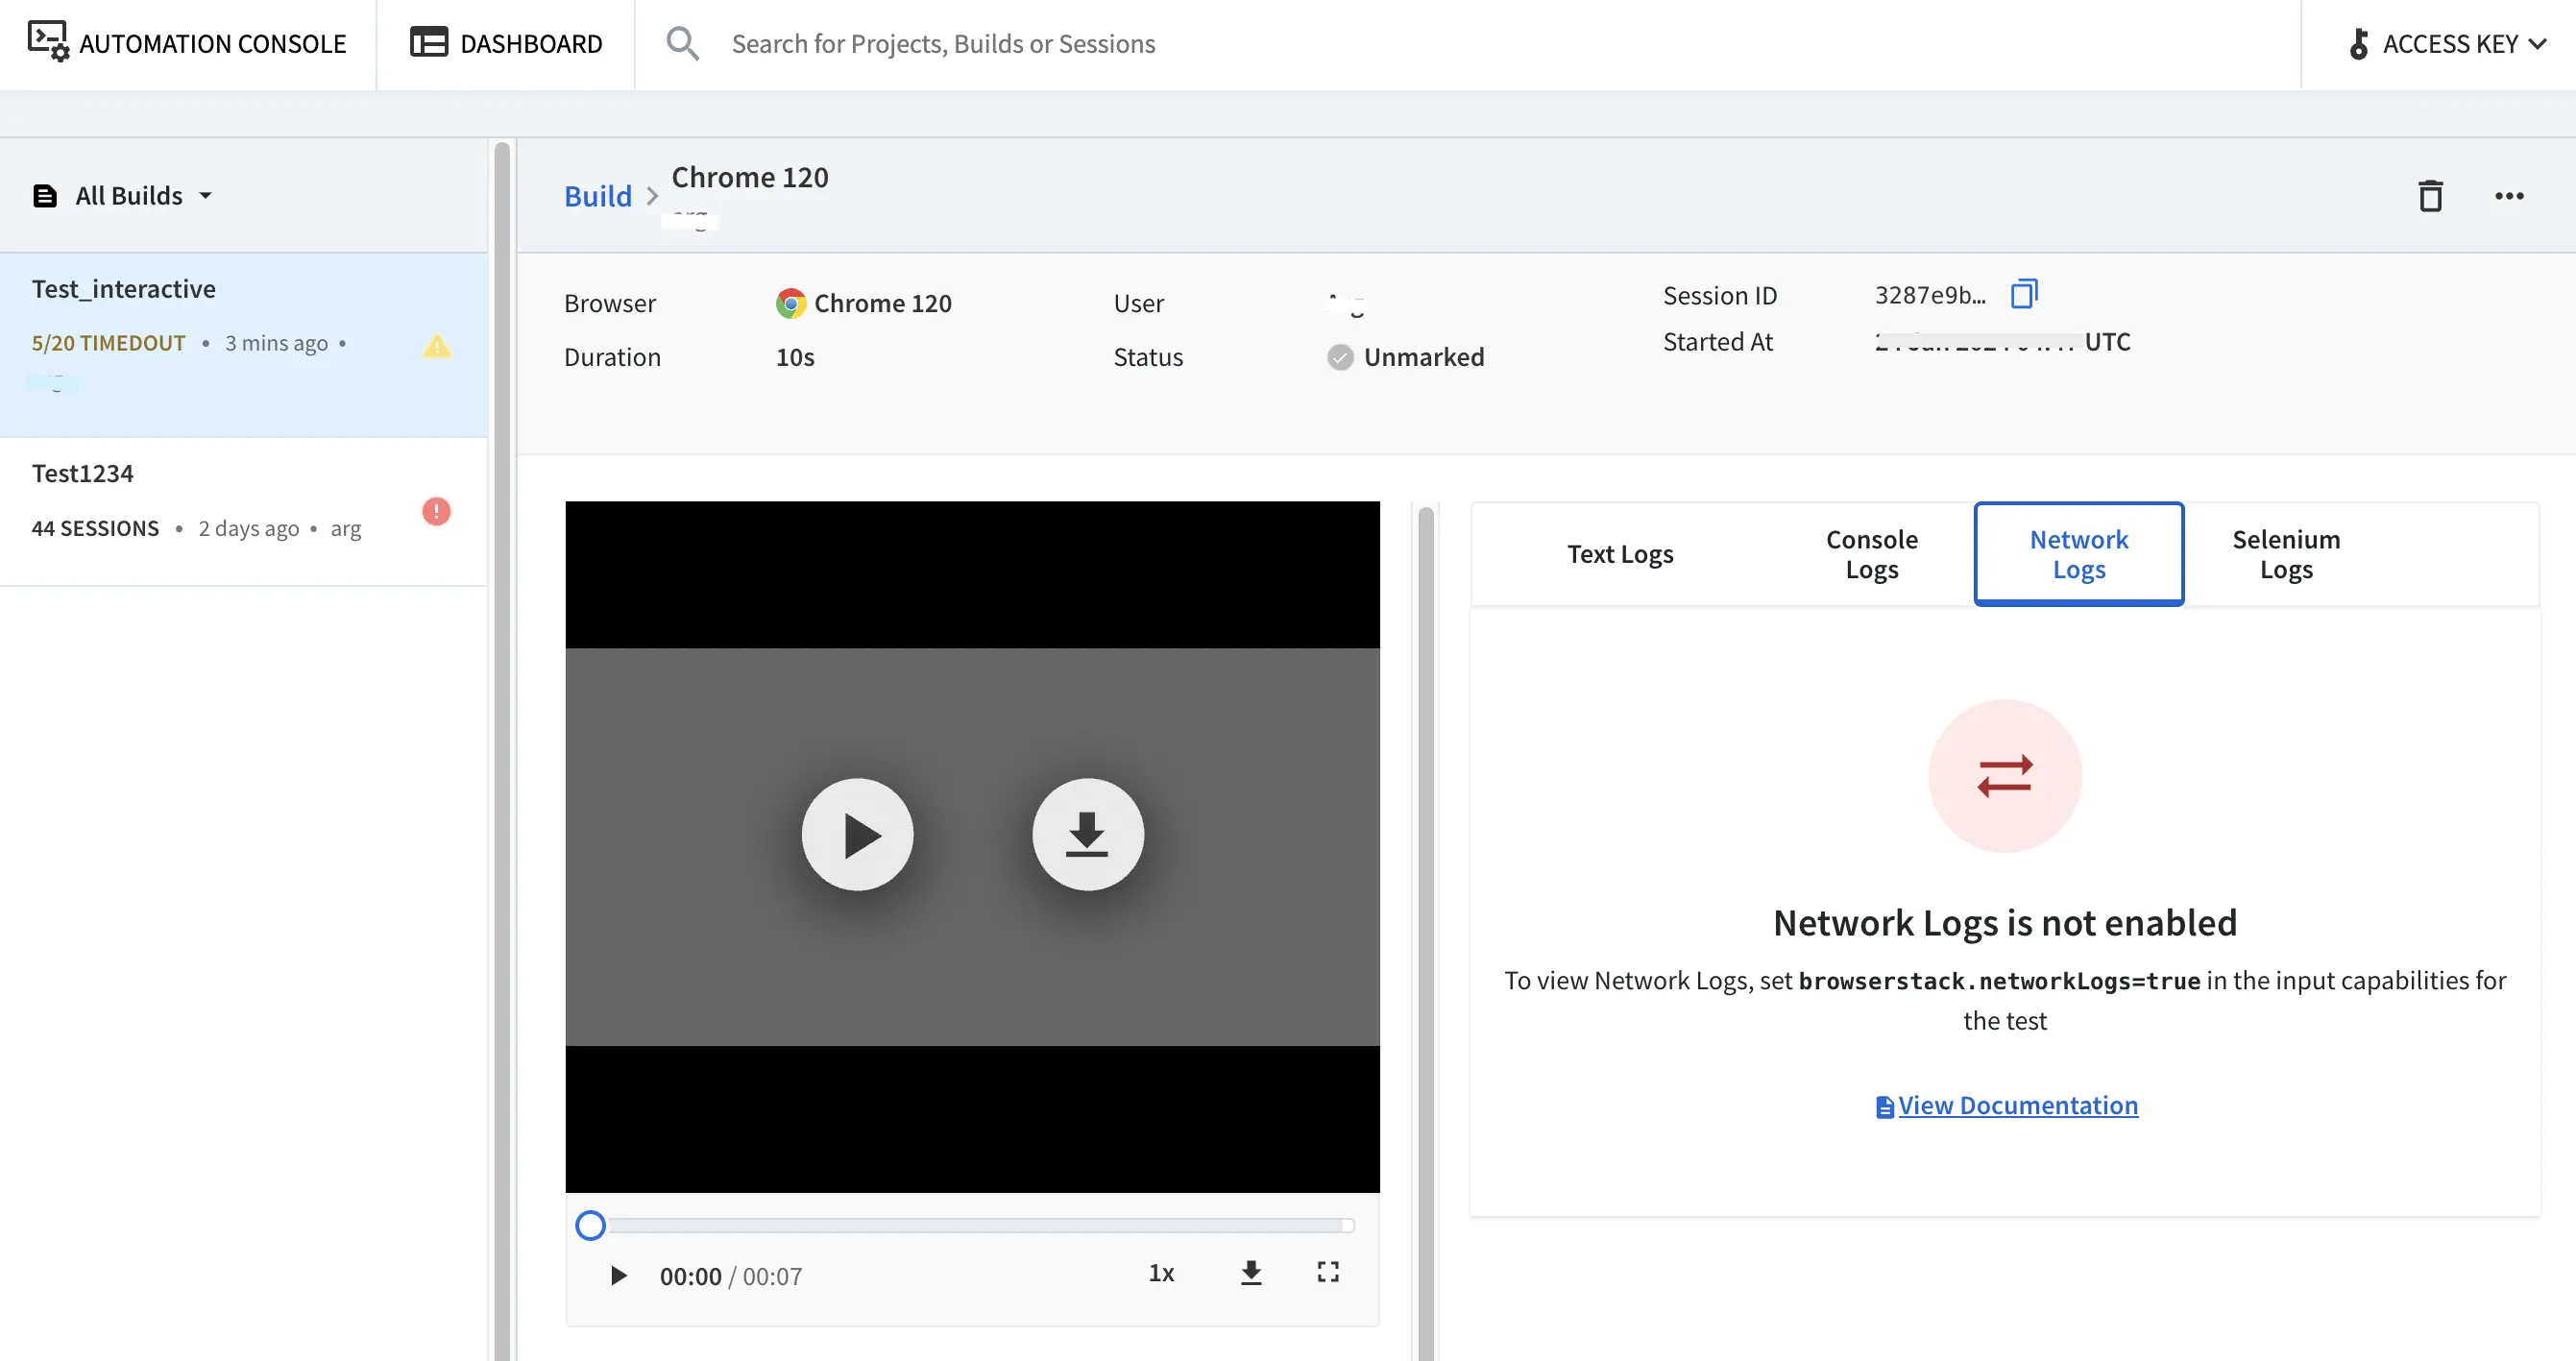
Enable Network Logs
To enable network logs use the networkLogs capability.
| Capability | Description | Expected values |
|---|---|---|
networkLogs |
Enable network logs | A string. Defaults to false true if you want to enable network logs. false otherwise. |
For example, this is how you enable network logs:
If you set the networkLogs capability to true, you will see the following result on the dashboard:

We're sorry to hear that. Please share your feedback so we can do better
Contact our Support team for immediate help while we work on improving our docs.
We're continuously improving our docs. We'd love to know what you liked
Is this page helping you?
 Yes
No
Yes
No
We're sorry to hear that. Please share your feedback so we can do better
Contact our Support team for immediate help while we work on improving our docs.
We're continuously improving our docs. We'd love to know what you liked
Thank you for your valuable feedback!