A webpage’s source code is the underlying HTML, CSS, and JavaScript that structure and style the content displayed in a browser. Viewing the page source allows developers, testers, and researchers to analyze how a webpage is built, inspect embedded resources, and troubleshoot issues.
This article covers how to view page source across different browsers, including Chrome, Firefox, Edge, Safari, and Opera. It also explores developer tools, live DOM inspection, and network analysis for deeper insights, along with techniques for extracting web content manually and through automation.
How to View Page Sources in Different Browsers
When viewing a webpage’s source code, you’ll typically find:
- HTML elements: Define the structure and content of the page.
- CSS styles: Control the appearance, layout, and design.
- JavaScript scripts: Enable interactivity and dynamic functionality
Modern browsers also provide developer tools that allow interactive inspection, debugging, and even live editing of the code. The basic method to view the page source is to right-click on a webpage and select View Page Source, or use browser-specific shortcuts.
Beyond static HTML, browser developer tools enable users to inspect real-time DOM changes, network requests, and performance metrics.
Google Chrome
Here are the steps to view page source in Google Chrome:
1. Open Google Chrome and navigate to the webpage.
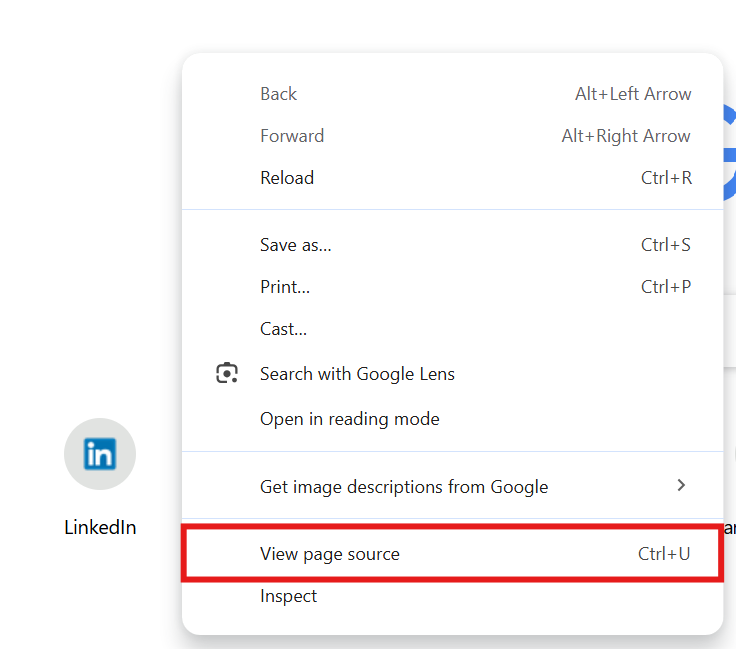
2. Right-click anywhere on the page and select View Page Source. Alternatively, press Ctrl + U (Windows/Linux) or Cmd + Option + U (Mac) to open the source code in a new tab.
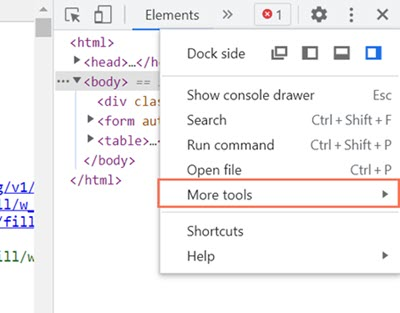
3. To inspect elements interactively, press F12 or Ctrl + Shift + I (Windows/Linux) or Cmd + Option + I (Mac) to open Chrome Developer Tools.
4. Navigate to the Elements tab to view and modify the live DOM structure.
5. Use the Network tab to analyze HTTP requests and responses in real time.
Mozilla Firefox
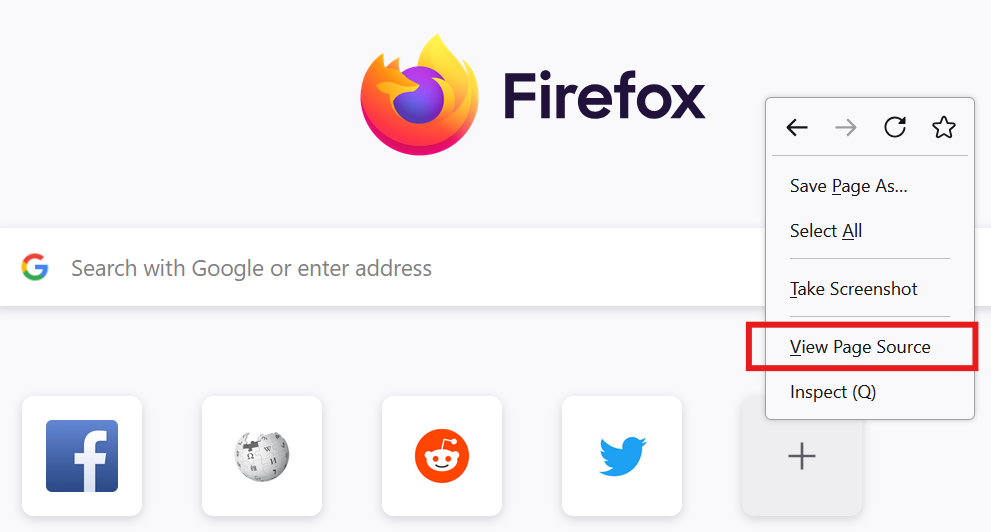
Follow the steps below to view the page source in Mozilla Firefox:
1. Open Mozilla Firefox and go to the desired webpage.
2. Right-click on the page and choose View Page Source. Use Ctrl + U (Windows/Linux) or Cmd + U (Mac) to open the source in a new tab.
3. For in-depth analysis, use F12 or Ctrl + Shift + I (Windows/Linux) or Cmd + Option + I (Mac) to open Developer Tools.
4. The Inspector tool allows editing HTML and CSS on-the-fly.
5. The Console tab provides JavaScript debugging and real-time interaction with the page.
Read More: How to Inspect Element in Firefox
Microsoft Edge
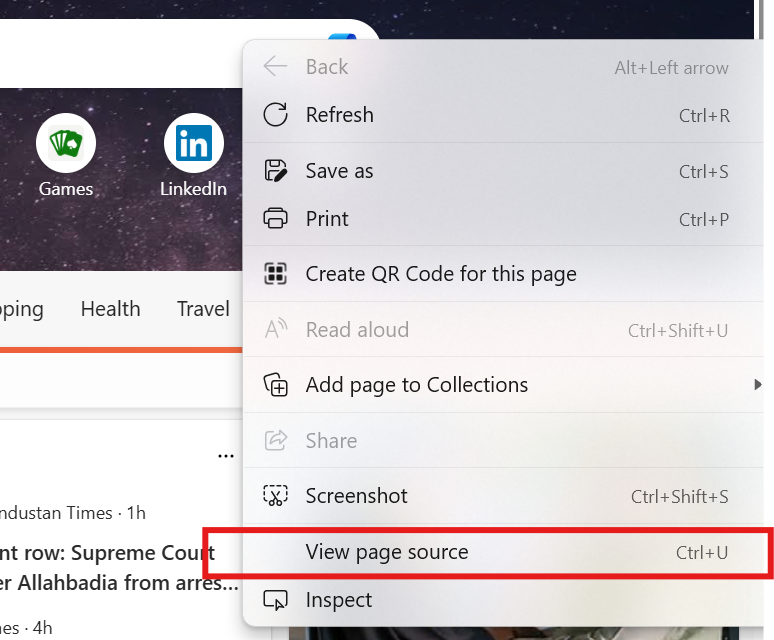
Here are the steps to view the page source:
1. Launch Microsoft Edge and navigate to the webpage.
2. Right-click anywhere and select View Page Source. Use the shortcut Ctrl + U (Windows/Linux) to open the page source in a separate tab.
3. For interactive inspection, press F12 or Ctrl + Shift + I to access Developer Tools.
4. Edge provides an Emulation tab for testing responsiveness across different devices.
Safari
Follow the below-mentioned steps to view the page source in Safari:
1. Open Safari and navigate to the webpage.
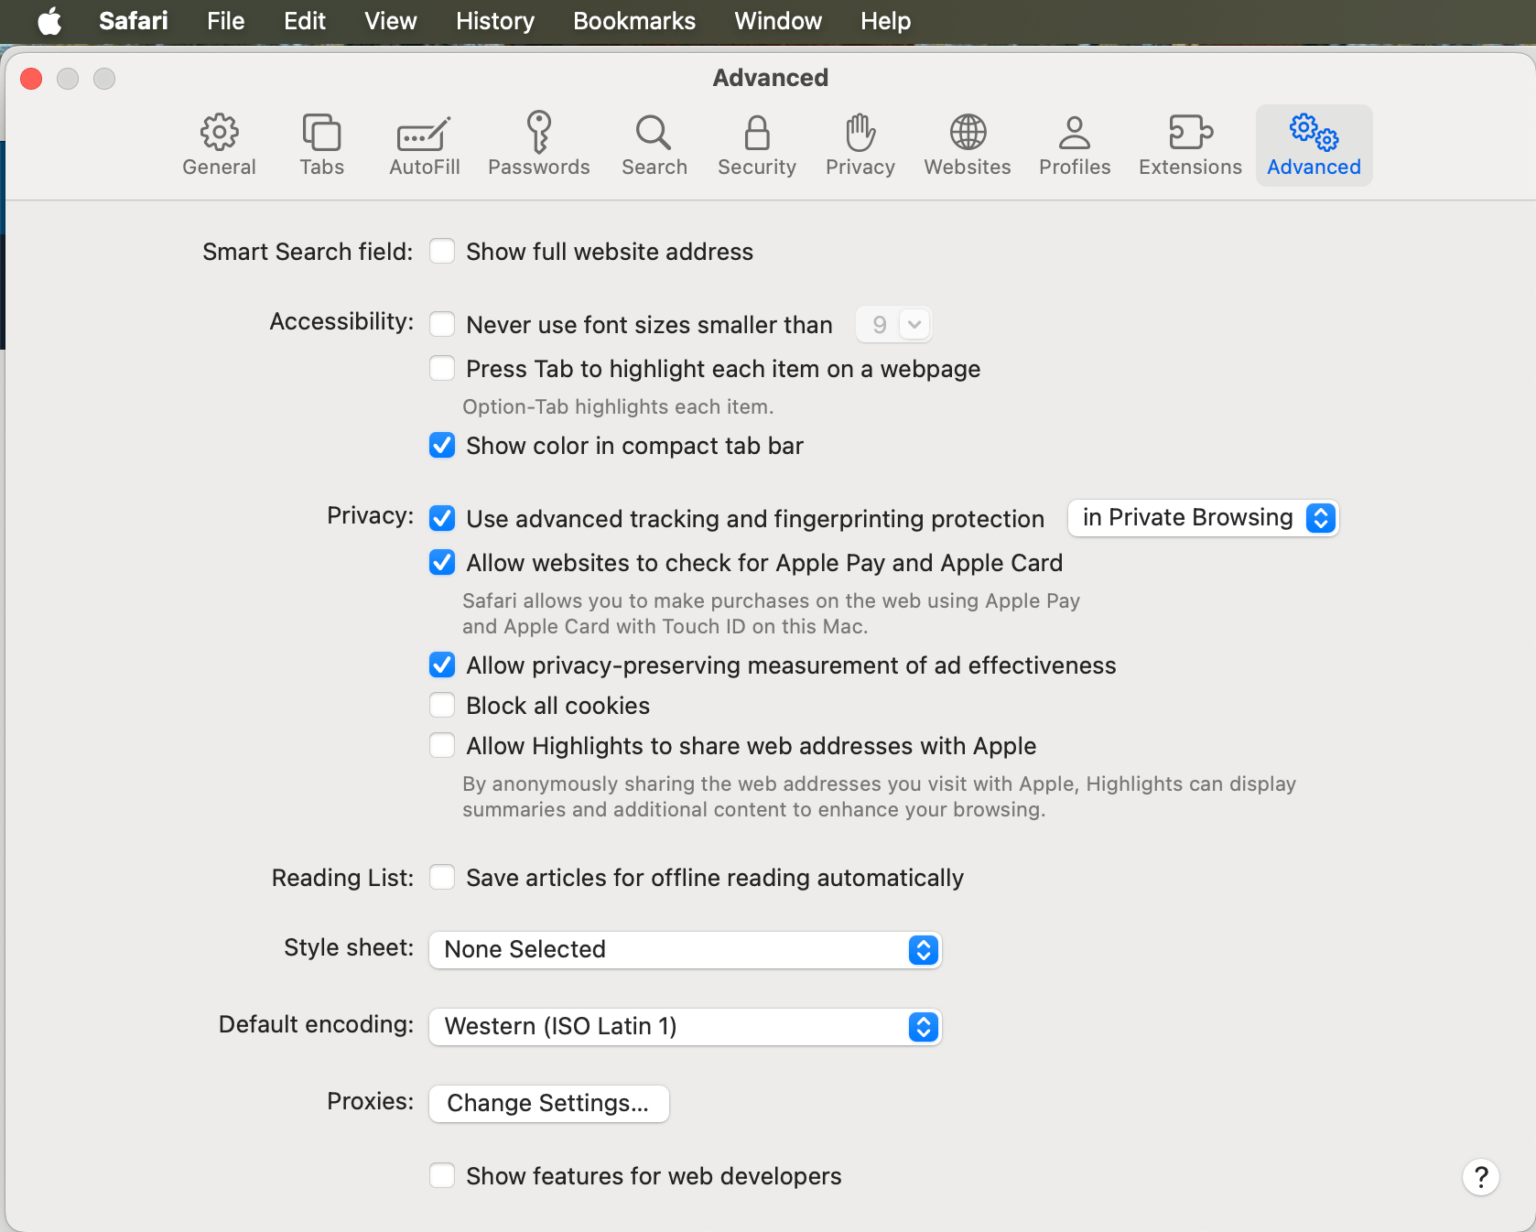
2. Enable Developer Mode if it’s not already active:
- Go to Safari > Preferences > Advanced.
- Check Show Develop menu in menu bar then right-click on the page and select Show Page Source or use Option + Command + U.
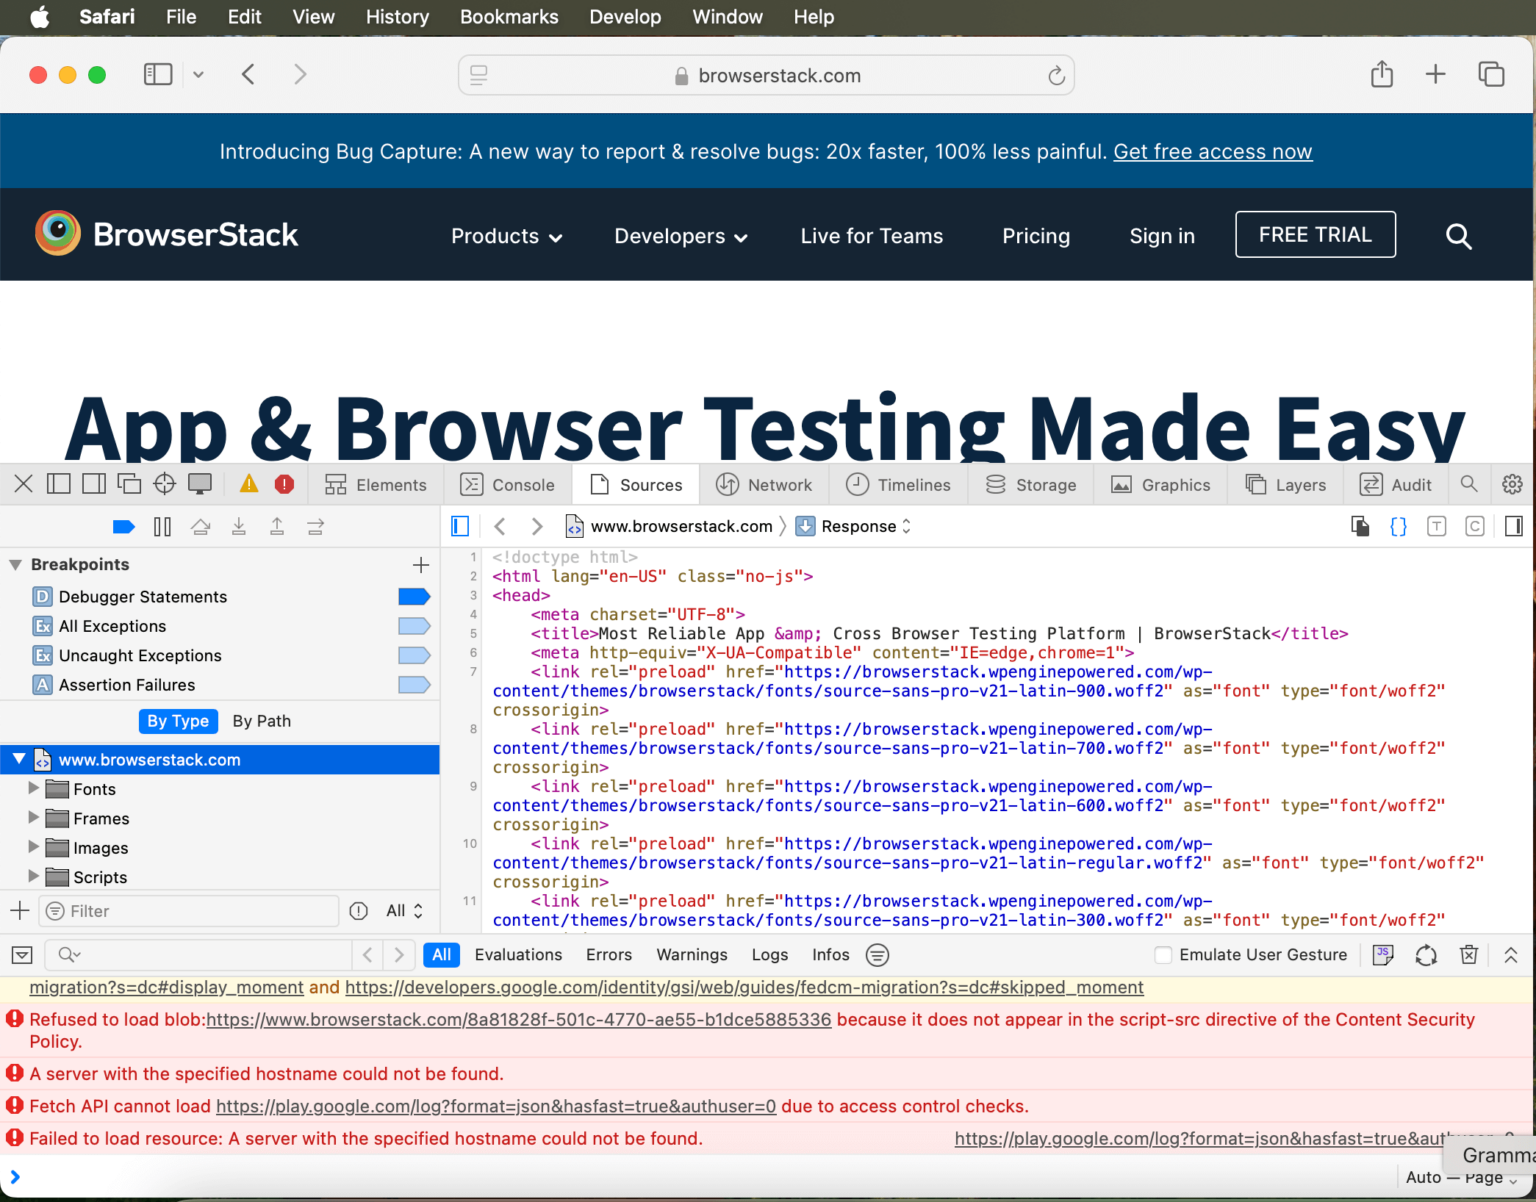
3. To inspect elements, open Web Inspector with Option + Command + I.
4. Safari’s Developer Tools include Timelines for performance monitoring and Storage for managing cookies and cache.
Read More: How to View Source Code in Safari
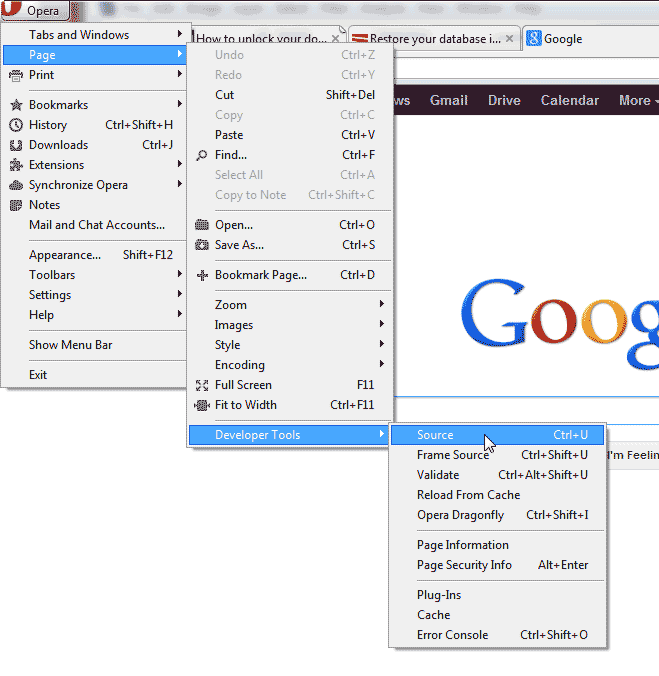
Opera
Follow these steps to view the page source in Opera:
1. Open Opera and visit the desired webpage.
2. Right-click and select View Page Source.
3. Use the keyboard shortcut Ctrl + U (Windows/Linux) or Cmd + U (Mac) to display the page source.
- Press F12 or Ctrl + Shift + I to open Developer Tools for advanced inspection.
- Opera’s developer tools are similar to Chrome’s, featuring Device Mode for responsive testing and Application tab for storage analysis.
Since web pages can render differently across browsers, developers and testers need to ensure consistency in how content is displayed. Simply viewing the page source is not enough; testing across real devices and browsers helps identify inconsistencies in rendering, performance, or functionality.
With BrowserStack’s real device cloud, teams can test websites in real-world conditions without relying on emulators or local setups, ensuring accurate cross-browser validation.
Extracting Web Content from Page Source
Viewing the page source is just the first step. Extracting structured content from web pages is crucial for web scraping, data mining, and competitive analysis. By examining the HTML structure, metadata, and embedded elements, users can identify key data points for further processing.
Some common extraction techniques include:
- Manual Copying: Select and copy relevant sections.
- Browser Extensions: Automate structured data extraction.
- JavaScript Console: Extract elements dynamically with JavaScript.
Automated Methods for Extracting Web Content
To automate web content extraction, several programming languages and tools provide efficient methods:
Using JavaScript Console
Best for quick, in-browser data extraction:
let links = document.querySelectorAll('a');

links.forEach(link => console.log(link.href));
This script retrieves all headings on a webpage, which is useful for content analysis.
Using Python and BeautifulSoup
For automated content extraction, Python’s BeautifulSoup library is widely used:
from bs4 import BeautifulSoup
import requests

url = "https://example.com"
response = requests.get(url)
soup = BeautifulSoup(response.text, 'html.parser')
print(soup.prettify())
This script fetches and parses the webpage source code programmatically, enabling structured data extraction.
Using Web Scraping Tools
Several specialized tools allow large-scale extraction of web content, including:
- Scrapy: Best for large-scale structured data extraction.
- Selenium: For automating browser interactions.
- Puppeteer: A headless Chrome browser for JavaScript-rendered content.
- BeautifulSoup: Ideal for parsing and extracting data from static HTML pages.
- Requests-HTML: A Python library for parsing and rendering HTML, including JavaScript-executed content.
Conclusion
Knowing how to view page source in different browsers is essential for debugging, SEO analysis, and web scraping. While basic methods reveal static HTML, advanced techniques like developer tools, JavaScript, and Python-based automation enable deeper insights.
Key Takeaways:
- Use right-click and shortcuts to access basic page source.
- Leverage developer tools for real-time debugging and live modifications.
- Automate content extraction using JavaScript and Python-based web scraping.
- Combine manual inspection and automation for efficient web analysis.
Whether you’re optimizing SEO, debugging code, or extracting data at scale, these techniques will help you work smarter. Additionally, testing how extracted content appears and functions across different browsers is crucial. With BrowserStack, teams can validate web pages on real devices and browsers, ensuring seamless performance and consistency across environments.
