As Google Chrome leads in the browser market with its extensive market share, testers require a dependable framework to test their features on Chrome.
Selenium DevTools extends Selenium’s capabilities by integrating with the Chrome DevTools Protocol (CDP). CDP is a low-level protocol for browser debugging and automation. It allows advanced browser control, such as network interception, performance monitoring, and device emulation.
Overview
What are Selenium DevTools?
Selenium DevTools is an interface that integrates Chrome Debugging Protocol (CDP) with Selenium, enabling deeper browser control, debugging, and network manipulation for advanced automation.
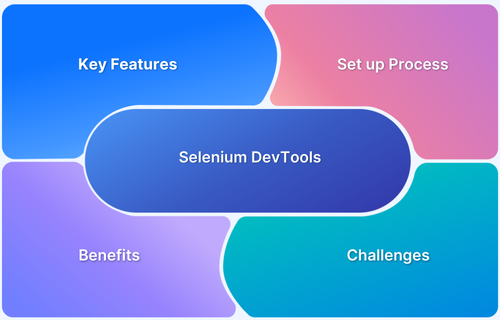
Key Features of Selenium DevTools
- Network Interception – Monitor, block, or modify network requests.
- Console Logging & Debugging – Capture browser logs and errors.
- Performance Monitoring – Analyze load times, rendering, and resource usage.
- Emulation & Overrides – Simulate different devices, geolocations, and network conditions.
- JavaScript Execution Control – Inject, modify, and control JavaScript execution in real time.
This article looks at Selenium dev tools and how they can help navigate Selenium workflows to deal with Cloudflare protection and more.
What are Selenium Dev Tools?
Selenium DevTools is part of the Selenium framework and integrates with Chrome Debugging Protocol (CDP) to provide direct access to browser internals. Testers can perform tasks such as capturing console logs, throttling network conditions, and simulating device settings.
It is an important tool for enriching web automation and debugging beyond traditional Selenium functionalities.
What is Chrome Debugging Protocol (CDP)?
The Chrome Debugging Protocol (CDP) allows developers to communicate directly with the Chrome browser engine.
It supports advanced operations like log capture, network request monitoring, and changes in browser settings, which are integral for tasks requiring specific control over the behaviour of the browser.
CDP also supports some of the functionalities, namely network throttling and HTTP requests intercepting capabilities along with simulating the settings of various devices, with Selenium’s help through DevTools for interaction with CDP.
Differences Between Traditional Selenium Features and CDP Enhanced Automation
The table below lists the differences between traditional Selenium and integration with CDP tools:
| Aspect | Traditional Selenium Features | CDP-Enhanced Automation |
|---|---|---|
| Network Interception | Not supported. Selenium cannot intercept or modify network requests or responses. | Supports network interception and modification, allowing tasks like blocking resources or throttling. |
| Performance Monitoring | Limited to basic browser interactions and DOM manipulations. | Offers detailed performance metrics such as page load time, resource usage, and rendering performance. |
| Device Emulation | Requires third-party tools or configurations for device emulation. | Provides native support for simulating mobile devices, screen resolutions, and user agents. |
| Console Log Access | Limited to capturing certain exceptions and errors. | Captures detailed console logs, including JavaScript errors and debug messages, directly from the browser. |
| Handling CAPTCHAs/Cloudflare | Relies on workarounds or third-party tools for handling Cloudflare-protected sites or CAPTCHAs. | Enables advanced strategies like simulating real user behavior to navigate Cloudflare and similar defenses. |
| Protocol Access | Works at a higher abstraction level, limiting access to low-level browser protocols. | Provides direct access to Chrome Debugging Protocol for granular browser control and debugging. |
Read More: Selenium 3 vs Selenium 4: Core Differences
Key Features of Selenium DevTools
Selenium DevTools expands traditional Selenium capabilities by offering advanced browser automation and debugging tools. Below are its key features:
- Network Interception and Monitoring: Testers can intercept and monitor network requests and responses to analyze API calls, debug network issues, and enhance web performance.
- Mocking Network Requests and Responses: The tool allows testers to mock specific network requests and customize responses, making it easier to test scenarios like server errors or delayed responses.
- Performance Profiling: It provides detailed performance metrics such as page load times, CPU usage, and memory consumption. These insights help identify bottlenecks and optimize application performance.
- Capturing Console Logs and Browser Events: Selenium DevTools captures browser console logs and critical events, such as JavaScript errors, to simplify debugging and troubleshooting.
- Emulating Devices and Geolocation Settings: Testers can simulate mobile devices, screen resolutions, and geolocations, enabling efficient testing of responsive designs and location-specific features.
Read More: What’s new in Selenium 4: Key features.
Setting Up Selenium Dev Tools
To leverage Selenium DevTools, ensure the correct setup of tools and dependencies. Below is a guide to get started.
Prerequisites
- Selenium WebDriver: Ensure you have the latest version of Selenium WebDriver installed.
- ChromeDriver: Download a ChromeDriver version compatible with your browser.
- Supported Browser Versions: Use a Chrome or Chromium-based browser version that supports the Chrome DevTools Protocol (CDP).
Read More: Chrome vs Chromium: Core Differences
Step-by-Step Setup Process to Set up Selenium Dev Tools
Follow this step-by-step guide to integrate Selenium DevTools with Chrome Debugging Protocol for advanced browser automation and debugging.
Install Required Libraries
Install the necessary library for Selenium DevTools. For Python, use the following command:
pip install seleniumConfiguration Code for Enabling DevTools
Use the below example code to enable DevTools in Selenium:
from selenium import webdriver


# Set up ChromeDriver

driver = webdriver.Chrome()


# Enable DevTools

dev_tools = driver.devtools

dev_tools.create_session()


# Example: Capturing console logs

dev_tools.send_command("Log.enable")


driver.get("https://example.com")


# Fetch and print console logs

logs = dev_tools.send_command("Log.entryAdded")

print(logs)


driver.quit()
For detailed steps on running Selenium tests with ChromeDriver, visit the BrowserStack guide.
Read More: How to Launch Browser in Selenium
Code Examples for Using Selenium DevTools
Here are examples of how Selenium DevTools can be used for advanced automation and testing.
1. Intercepting Network Requests
Code to capture and log HTTP requests and responses is useful for monitoring API calls during tests
from selenium import webdriver


# Set up ChromeDriver and DevTools

driver = webdriver.Chrome()

dev_tools = driver.devtools

dev_tools.create_session()


# Enable network monitoring

dev_tools.send_command("Network.enable")


# Capture HTTP requests and responses

def capture_request(data):

    print("Request:", data)


def capture_response(data):

    print("Response:", data)


dev_tools.add_listener("Network.requestWillBeSent", capture_request)

dev_tools.add_listener("Network.responseReceived", capture_response)


driver.get("https://example.com")

driver.quit()
2. Mocking Network Responses
Testing frontend behaviour with simulated data requires mocking or modifying server responses:
from selenium import webdriver


# Set up ChromeDriver and DevTools

driver = webdriver.Chrome()

dev_tools = driver.devtools

dev_tools.create_session()


# Enable network monitoring

dev_tools.send_command("Network.enable")


# Mock response

mock_response = {

    "id": 1,

    "result": {"response": "mocked data"}

}


dev_tools.send_command("Fetch.enable", {"patterns": [{"urlPattern": "*"}]})


def modify_response(data):

    dev_tools.send_command("Fetch.fulfillRequest", {

        "requestId": data["requestId"],

        "responseCode": 200,

        "body": mock_response

    })


dev_tools.add_listener("Fetch.requestPaused", modify_response)


driver.get("https://example.com")

driver.quit()
Read More: How to use Devtools for Safari Mobile View?
3. Capturing Console Logs
Extracting browser console logs during test execution is needed for debugging JavaScript errors in the application.
from selenium import webdriver


# Set up ChromeDriver and DevTools

driver = webdriver.Chrome()

dev_tools = driver.devtools

dev_tools.create_session()


# Enable console log capturing

dev_tools.send_command("Log.enable")


# Capture console logs

logs = dev_tools.send_command("Log.entryAdded")

for log in logs:

    print(log)


driver.get("https://example.com")

driver.quit()
4. Performance Metrics Analysis
Capturing performance data such as page load time and network latency is crucial to identify bottlenecks in web application performance
from selenium import webdriver


# Set up ChromeDriver and DevTools

driver = webdriver.Chrome()

dev_tools = driver.devtools

dev_tools.create_session()


# Enable performance monitoring

dev_tools.send_command("Performance.enable")


driver.get("https://example.com")


# Retrieve performance metrics

metrics = dev_tools.send_command("Performance.getMetrics")

for metric in metrics["metrics"]:

    print(f"{metric['name']}: {metric['value']}")


driver.quit()
5. Device Emulation
Simulating mobile and tablet devices is necessary to test responsive web designs
from selenium import webdriver


# Set up ChromeDriver and DevTools

driver = webdriver.Chrome()

dev_tools = driver.devtools

dev_tools.create_session()


# Enable device emulation

mobile_emulation = {

    "deviceMetrics": {"width": 375, "height": 667, "pixelRatio": 2.0},

    "userAgent": "Mozilla/5.0 (iPhone; CPU iPhone OS 13_3 like Mac OS X) AppleWebKit/605.1.15 (KHTML, like Gecko) Mobile/15E148"

}

dev_tools.send_command("Emulation.setDeviceMetricsOverride", mobile_emulation)


driver.get("https://example.com")

driver.quit()
Benefits of using Selenium DevTools
Selenium DevTools offers several advantages for advanced browser automation and testing:
- Enhanced Debugging Capabilities: Selenium DevTools provides detailed access to browser logs, console outputs, and network activities, making it easier to diagnose and fix issues quickly.
- Greater Flexibility in Network and Performance Testing: With features like network interception, request modification, and performance profiling, Selenium DevTools allows testers to simulate real-world conditions and measure key metrics like page load times and network latency.
- Improved Test Coverage for Real-World Scenarios: DevTools enables more comprehensive testing by mimicking real user environments, such as different devices and geolocations, which ensures that tests cover a broader range of possible real-world conditions.
Challenges in Selenium DevTools
Major challenges regarding DevTools arise mainly because testers want to navigate modern web applications while using a framework that is primarily designed for basic web interactions. The key challenges include:
1. Dynamic Content: Selenium DevTools can help by providing better control over network interactions, allowing you to intercept and modify network requests. This can help with testing dynamically loaded content more reliably.
However, managing dynamic elements still requires careful scripting, as the content might still be unpredictable.
2. Browser Compatibility: While Selenium DevTools helps with advanced browser interactions (e.g., network interception, emulation), it doesn’t directly address browser compatibility challenges.
Selenium DevTools does not fundamentally alter the need for handling different browser versions and quirks.
3. JavaScript Complexity: Selenium DevTools can provide enhanced control over browser events, which can help with complex JavaScript interactions like managing events and network requests.
However, handling JavaScript alerts and prompts might still require the traditional Selenium WebDriver commands, as these are outside the scope of DevTools.
4. Limited Non-Web Support: Selenium DevTools is focused on web testing and does not address the need for testing native mobile apps or desktop applications. This remains a challenge regardless of whether you use DevTools.
5. Testing CAPTCHA and Barcodes: Selenium DevTools doesn’t offer built-in solutions for bypassing CAPTCHAs or recognizing barcodes.
You would still need third-party tools to handle these challenges, regardless of using Selenium or Selenium DevTools.
6. Test Maintenance Overhead: Selenium DevTools may reduce maintenance in some cases by offering more precise control over browser features.
However, the need to update tests with changes to web application elements or structure remains a challenge, especially when the application undergoes frequent updates.
Tips for integrating CDP effectively in existing Test Frameworks
Integrating CDP into your existing framework adds advanced capabilities, making your tests more reliable and efficient while ensuring ease of maintenance. Here’s how you can integrate Chrome DevTools Protocol (CDP) effectively into your existing test framework:
- Familiarise Yourself with CDP’s Key Features: Understand the essential features of CDP, like network interception, performance profiling, and device emulation. These will enhance your test scenarios when used properly.
- Combine CDP with Selenium WebDriver: Selenium 4 natively supports CDP. Integrate it into your current framework using the DevTools interface to interact with advanced browser features that were previously unavailable.
- Isolate CDP Logic: Keep CDP-specific logic separate within your test framework. By doing this, the core test scripts remain unaffected, and you can easily revert to standard Selenium WebDriver if needed.
- Start Small and Scale Up: Begin by using basic CDP features like network interception. Once you are comfortable, expand to more advanced capabilities like device emulation and performance profiling.
- Use CDP for Dynamic Content: Handle dynamic content more effectively with CDP. Features such as intercepting network requests or modifying responses can help manage dynamically loaded or AJAX-driven elements.
- Ensure Cross-Browser Compatibility: While CDP is typically used with Chrome, ensure compatibility with other browsers through cross-browser testing tools like BrowserStack. This will help keep tests consistent across different environments.
- Integrate CDP into CI/CD Pipelines: Automate your tests using CDP within your CI/CD pipelines. This ensures tests run smoothly at each stage of the development process, improving consistency.
- Monitor Performance: Use CDP’s performance profiling features to capture page load times, CPU usage, and memory consumption. This allows you to identify bottlenecks and optimise performance.
- Address Browser-Specific Issues: Keep in mind that CDP features may not work the same across all browser versions. Adapt your framework to handle any browser-specific quirks.
- Document Best Practices: Document the best practices for CDP usage within your team. This ensures a consistent approach, making the framework easier to maintain and scale.
Selenium DevTools vs. Puppeteer/Playwright
Here is a quick comparison between Selenium DevTools, Puppeteer, and Playwright for testing applications on Chrome browser:
| Feature | Selenium DevTools | Puppeteer | Playwright |
|---|---|---|---|
| Browser Support | Primarily supports Chrome/Chromium, but can be integrated into cross-browser testing with Selenium WebDriver. | Supports Chrome/Chromium; can be extended to other browsers with extra setup. | Supports Chrome, Chromium, Firefox, and WebKit (Safari). |
| Cross-Browser Testing | Supports cross-browser testing through Selenium WebDriver, though DevTools itself is Chrome/Chromium-focused. | Primarily for Chrome/Chromium; not designed for cross-browser testing. | Ideal for cross-browser testing with seamless support for multiple browsers. |
| Network Interception & Mocking | Strong network interception and mocking capabilities via CDP, though less flexible than Puppeteer. | Built-in network interception and mocking features. | Advanced network mocking and interception, similar to Puppeteer. |
| Device Emulation | Supports device emulation within Chrome/Chromium via DevTools, but not as extensive as Playwright. | Excellent mobile device emulation features. | Rich device emulation, supporting more devices and configurations out-of-the-box. |
| Performance Monitoring | Provides performance metrics, resource tracking, and profiling, ideal for deep analysis. | Limited performance monitoring features. | Advanced performance analysis tools and tracing capabilities. |
| Ease of Setup | Seamlessly integrates into existing Selenium frameworks for large-scale testing. | Quick and easy to set up, but best for single-browser testing (Chrome/Chromium). | Requires more setup but offers a powerful cross-browser testing suite. |
| Integration with Legacy Systems | Best for teams already using Selenium, offering advanced features without the need to switch tools. | Does not integrate easily with Selenium or other frameworks. | Good for teams starting fresh but lacks simple integration with legacy systems. |
Selenium DevTools can be integrated into existing Selenium frameworks, which already support cross-browser testing, making it ideal when you need to test across different browser types. For teams already using Selenium, adding DevTools integration provides enhanced features without needing to switch to a new tool.
When handling advanced network operations or complex browser interactions, Selenium DevTools provides flexibility and detailed control over the browser’s internals, making it the better choice for specific scenarios like simulating network conditions, bypassing bot protections, or working with Cloudflare.
Practical Uses of Selenium DevTools
Selenium DevTools brings about new levels of improvement for test automation workflows. The powerful package of features makes it quite more controllable over a testing scenario and provides detailed insights into the performance of an application.
With Selenium DevTools, the testers may be able to overcome prevalent issues such as flaky tests, network unreliability, or performance degradation. Here are a few practical uses where Selenium DevTools can bring a different level of difference.
1. Debugging Flaky Tests with Detailed Logs
Selenium DevTools can capture detailed browser logs, including console logs, network activity, and errors.
Based on such logs, it is easy to identify why flaky tests fail in the test environment, perhaps due to network failures, unexpected JavaScript errors, or slow page loads. Thus, isolating the root cause and ensuring test reliability is easier.
2. Testing for Offline Functionality by Simulating Network Conditions
With Selenium DevTools, you can simulate various network conditions, such as offline mode, slow connections, or network throttling.
This is especially helpful in testing how your web application behaves without an internet connection or when network speed fluctuates, ensuring a robust user experience in all scenarios.
3. Performance Optimisation for Web Applications
With Selenium DevTools, you can track the page load time, CPU usage, and network latency for any given test, so it’s easy to see the performance bottlenecks.
It makes optimization of a web application by reducing bottlenecks, like slow loading of resources or inefficient rendering, very possible.
Why Execute Selenium Tests on BrowserStack?
Running Selenium tests on BrowserStack Automate offers a range of benefits that streamline testing and improve test coverage.
BrowserStack’s cloud-based platform provides access to real devices and browsers, ensuring that your tests run in real user conditions.
With BrowserStack Automate, you can execute automated tests on a wide array of devices, operating systems, and browser versions without requiring extensive infrastructure setup.
Key features of BrowserStack Automate include:
- Cross-Browser Testing: Run your tests on multiple browser versions and OS combinations without worrying about configuration.
- Parallel Test Execution: Speed up test cycles by running tests in parallel across different browsers and devices.
- Real Device Testing: Test on actual devices, not emulators, to ensure your application works as expected in real-world conditions.
- Automatic Scaling: Automatically scale your testing efforts, running tests across multiple environments simultaneously.
- Seamless Integration: Integrate with popular CI/CD tools like Jenkins, Travis CI, and GitHub Actions, enabling continuous testing and delivery pipelines.
Conclusion
With capabilities like network interception, device emulation, and detailed logging, Selenium DevTools allows testers to achieve greater control and insight into their automated tests. By integrating these features into your Selenium workflows, you can address real-world testing challenges and improve test reliability and performance.
To fully leverage Selenium DevTools, especially when dealing with dynamic websites like Cloudflare protection, you can integrate Selenium testing with BrowserStack Automate.
The BrowserStack’s cloud-based platform allows you to gain access to real devices, cross-browser testing, and parallel test execution. So it is easier for you to execute comprehensive tests on multiple environments and scale your testing efforts efficiently.


