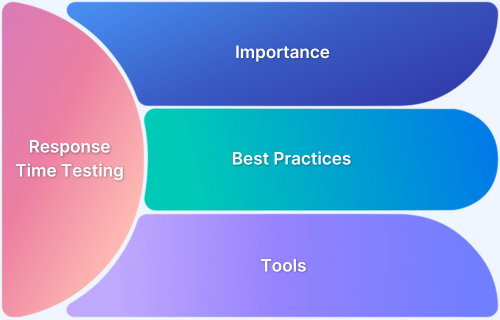
Response time testing evaluates how quickly an application responds to user requests, ensuring optimal performance.
Overview
Response time testing is a key aspect of software performance testing. It focuses on measuring the time it takes for an application to respond to a user’s request.
It’s not just about speed; it helps identify performance bottlenecks, optimize resource usage, and ensure applications function smoothly under varying conditions.
Factors Affecting Response Time Testing:
- Network Latency: Delays in data transfer between client and server.
- Server Performance: Server load and processing speed can impact response times.
- Application Complexity: More complex operations take longer to process.
- Database Performance: Slow database queries or inefficient indexing can delay responses.
- Client-Side Factors: Device performance, browser compatibility, and resource usage affect load times.
How to Perform Response Time Testing:
- Define Test Scenarios: Identify key user actions or workflows to test (e.g., login, search).
- Choose the Right Tools: Use tools like JMeter or LoadRunner to measure response times.
- Simulate Real-World Conditions: Test under different network speeds, device types, and load conditions.
- Monitor Server and Database: Track server and database performance during tests to spot bottlenecks.
- Analyze Results: Compare response times against performance benchmarks.
This article explores key aspects of response time testing, including its importance, metrics, factors affecting it, and best practices for optimization.
What is Response Time Testing in Performance Testing?
Response time testing is a type of performance testing that evaluates how quickly a system, application, or service reacts to a user request.
It measures the time taken from the moment a request is made until the system processes it and delivers a response. For example, when you click a button on a website, response time is how long it takes for the page to load or for the action to complete. Faster response times mean a smoother and better user experience.
Response times can be measured and analyzed at various levels, from individual functions and units to entire applications and integrated systems.
Read More: How to check Website Loading Time
Why is Response Time Testing Important?
While performance testing looks at the overall health of a system, response time testing focuses on how fast and responsive the application is. It is important for several reasons:
- User Expectations: The apps should load quickly to avoid lower engagement and abandonment. Studies show that even a few seconds of delay can cause frustration, lower engagement, and lead to abandonment. Faster response times enhance user satisfaction and boost retention.
- Pinpoints Issues: Response time testing helps identify specific areas where delays occur, such as slow database queries, inefficient code, or network latency.
- Scalability Assessment: As the volume of users or requests grows, response times can worsen. Conducting response time testing under different load conditions helps ensure the system maintains optimal performance, even during peak traffic periods.
- Cost Efficiency: Faster systems typically optimize resource usage, reducing operational costs, such as lower CPU consumption, memory usage, and network bandwidth requirements.
- Revenue Impact: Faster response times can lead to higher conversion rates, increased sales, and better business outcomes.
- Competitive Advantage: Applications with faster response times can gain a competitive advantage over slower alternatives. This is particularly important for sectors like e-commerce, gaming, and financial services, where speed directly impacts user experience and success.
Important Response Time Values
Understanding response time values is essential for assessing and optimizing application performance. These values help identify how quickly an application responds to user requests and ensure that it meets performance expectations.
The following are important response time metrics:
- 0.1 seconds: This is an ideal benchmark for near-instantaneous system response. Users will perceive the system as highly responsive, almost in real-time. However, most real-world applications will take longer than this.
- 1 second: This is a practical benchmark for a well-optimized application. Users will notice the operation, but it will feel like a normal, seamless experience. This is the target response time for most applications to maintain a smooth user experience.
- 10 seconds: At this point, the system is noticeably slow. Users will likely become frustrated and may abandon the process, leading to a higher risk of drop-off. A response time this long can significantly impact user retention and engagement.
Read More: 20 Website Speed Optimization Strategies
Types of Response Metrics
When conducting response time testing, there are several important response time metrics to consider, each providing unique insights into the system’s performance:
- Average Response Time: This is the mean time taken to process all requests during a test. While it gives an overall sense of performance, it may not reflect the true user experience without significant outliers.
- Peek Response Time: The longest time taken for a single request during the test. This metric is crucial for identifying the worst-case scenarios that could severely affect user experience, especially during high-traffic periods.
- Error Rate: The percentage of requests that result in error responses. This metric helps to understand how reliable your system is by showing how many requests fail compared to those that succeed, pointing out areas that need fixing.
How to Measure Response Time?
Response time is a key performance metric that indicates how quickly a website or application responds to user actions. Accurately measuring response time helps identify bottlenecks and optimize performance.
BrowserStack enables developers to test and analyze response times across different environments without complex setups.
- Network Logs for Response Time: BrowserStack allows users to capture and inspect network requests while testing on both Live and Automate. This gives testers insights into response times and performance under different conditions.
- Simulating Network Conditions: Use BrowserStack to test response time under various network speeds (3G, 4G, Wi-Fi) for real-world performance insights. It helps developers and testers understand how their applications perform under different network conditions
- Real Device Testing: Leverage BrowserStack to ensure accurate response time measurements on real mobile and desktop devices.
How to Estimate Response Time
Estimating response time is crucial to ensure your application performs well under various conditions. Here are simple steps guide on how to estimate and measure response time effectively:
Decide Test Parameters
Start by defining the test parameters. Identify the critical user interactions you want to measure, such as page loads, form submissions, or API requests.
Consider the environment, such as whether you will test on a local server or in the cloud. Choose the tools and technologies that will best simulate real-world usage.
Perform the Response Time Test
Run the test using a representative set of user scenarios. Use performance testing tools like BrowserStack to simulate different loads, such as multiple users or high traffic volumes. Record the time taken for the system to respond to each action, focusing on metrics like Time to First Byte (TTFB), First Contentful Paint (FCP), and Total Load Time.
Check the Results
After completing the test, gather the data and check the results. Focus on the average response time, peak response time, and any anomalies in the data. This will provide you with an overall understanding of the system’s performance.
Analyze Errors and Successes
Examine both successful requests and those that failed. The error rate gives you insight into areas where the system is struggling, while successful responses show how well the application performed under varying conditions. Use this data to identify bottlenecks and areas that may require optimization.
Read More: Key Metrics to Improve Site Speed
Factors Affecting Response Time
Several factors can influence response time, impacting the overall performance of an application. Here are the key elements that can affect response time:
- Network Latency: This refers to the time it takes for data to travel between the client and the server. High latency, caused by distance, network congestion, or routing issues, can significantly increase response times and degrade user experience.
- Server Performance: It is the capacity and efficiency of the server hardware and software. Underpowered servers or inefficient server configurations can lead to slow response times.
- Application Complexity: Application complexity can impact response time. Apps with many features, integrations, or inefficient code may take longer to process requests. Heavy client-side processing can also slow down response times.
- Database Performance: Unoptimized databases or those handling large data volumes can slow response times. Inefficient queries, missing indexes, and slow disk I/O can delay data retrieval and storage, impacting overall performance.
- Content Delivery Network (CDN): A CDN helps distribute content closer to users, reducing latency. Without a CDN, users might experience longer load times, especially when accessing large files or static content, as the data has to travel longer distances from the server.
Advantages and Disadvantages of Response Time Testing
While response time testing is essential for optimizing application performance, it comes with both benefits and challenges. Here’s a look at the advantages and disadvantages of conducting response time tests:
Advantages:
- Improved User Experience: Identify and resolve performance bottlenecks to ensure a smooth user experience.
- Scalability: Determine the system’s ability to handle increased loads and scale appropriately.
- Early Problem Detection: Identifying performance issues early in the development cycle helps reduce the cost and effort of fixing them later.
- Data-Driven Decisions: Use response time data to guide decisions on infrastructure, code optimization, and system configurations for improved performance.
Disadvantages:
- Complexity: Setting up and executing response time tests can be complex, requiring specialized tools and expertise.
- Cost: Response time testing can be expensive, especially if it requires commercial testing tools or dedicated resources.
- Environmental Factors: External factors like network conditions and server outages can impact test results, making it challenging to identify the exact cause of performance issues.
Response Time Testing Tools
Various tools are available to measure and optimize response times effectively. Some popular tools include:
- BrowserStack App Performance: BrowserStack enables response time testing by allowing teams to measure app performance on real devices under various network conditions.
- Load Runner: A powerful performance testing tool that supports various protocols and technologies. It helps evaluate system behavior under different load conditions.
- JMeter: This open-source load testing tool can simulate various types of traffic and measure response times.
- AEM (Adobe Experience Manager): A content management system that provides built-in analytics with performance monitoring and optimization tools.
- Google’s PageSpeed Insights: A web performance analysis tool that provides recommendations for improving website speed and response times.
- Gatling: This is also an open-source load testing tool designed for high-load testing and continuous integration.
- NeoLoad: A performance testing tool with an intuitive interface. It supports a wide range of technologies to streamline load testing and analysis.
- LoadNinja: A cloud-based load-testing tool that uses real browsers to simulate user traffic.
Best Practices for Optimizing Response Time
To ensure optimal response times and enhance overall performance, consider implementing the following best practices:
- Optimize Code: Improve the efficiency of your code by using efficient algorithms, minimizing database queries, and optimizing data structures.
- Optimize Database: Enhance data retrieval speeds by optimizing database queries, indexing, and implementing effective caching strategies.
- Cache Data: Implement caching mechanisms to store frequently accessed data in memory, reducing the need to retrieve it from the database repeatedly.
- Use a Content Delivery Network (CDN): This helps distribute static assets like images, CSS, and JavaScript across multiple servers located near users. It reduces latency and enhances load times.
- Data Compression: Compress data before transmission to minimize the amount of data being transferred. It enhances response times and reduces bandwidth usage.
- Monitor Performance Regularly: Monitor response times and other performance metrics to identify and address issues proactively.
- Load Balancing: Distribute traffic across multiple servers to prevent any single server from becoming overloaded.
- Optimize Images: Compress images to reduce their file size without sacrificing quality.
- Test on Real Devices: Testing on real mobile and desktop devices ensures accurate performance measurements and identifies device-specific issues that may impact response time.
BrowserStack offers a reliable platform for seamless testing across real devices and browsers. It allows you to test on real devices, helping you pinpoint performance issues and optimize response times effectively.
Conclusion
Response time testing is essential for delivering a smooth user experience and effectively meeting business objectives. By proactively monitoring and optimizing response times, you can create reliable and fast applications.
BrowserStack helps enhance response time by enabling developers to analyze application performance across different environments. It allows the capture of network logs and simulates various network conditions, such as 3G, 4G, and Wi-Fi.
Testing on real devices provides accurate insights into how applications perform, helping to optimize response times and improve overall application performance across real-world scenarios.


