Playwright, a leader in automating browser-based testing, provides detailed test reports that give teams insights into how applications behave under different conditions.
Overview
What is Playwright Test Report?
A Playwright test report is a detailed document generated after running a set of automated tests using the Playwright testing framework.
Built-in Reporters in Playwright
- List Reporter
- Dot Reporter
- JSON Reporter
- JUnit Reporter
- HTML Reporter
Benefits of Playwright Test Report
- Detailed insights
- Simplifies debugging
- Customizable reports
- Integrates with third-party reporters
- Tracks performance metrics seamlessly
- Trend analysis
This article will explore the structure of Playwright test reports and show you how to leverage them to improve your testing efficiency and code reliability.
What is Playwright?
Playwright is an open-source framework developed by Microsoft for automating web browsers to test web applications. It supports cross-browser testing across Chrome, Firefox, and WebKit, providing an all-in-one solution for real-time functional and performance testing.
Playwright enables end-to-end testing by simulating user interactions such as clicking, filling out forms, and navigation. Its features include headless browser support, mobile testing, network request capturing, and enhanced control over browser interactions, making it ideal for testing modern web applications.
Key features include
- Cross-browser support (Chrome, Firefox, WebKit).
- Automatic waiting for elements to be ready.
- Parallel test execution for higher performance.
- Mobile device emulation and geolocation simulation.
- Easy integration with CI/CD tools.
What is Playwright Test Report?
A Playwright test report is a detailed document generated after running a set of automated tests using the Playwright testing framework.
It offers a comprehensive view of the test results, showing which tests passed, failed, or were skipped, along with valuable insights into the application’s overall performance. This report helps developers and QA teams identify issues, track trends, and refine their testing processes.
The Playwright test report includes the following key components:
- Test Status: Information on which tests passed, failed, or were skipped.
- Error Details: Descriptions of any failures, including the type of error and the location within the application where the failure occurred.
- Execution Time: The amount of time each test took to run, which helps identify slow tests and performance bottlenecks.
- Test Coverage: Insights into which areas of the application were tested and whether they were adequately covered.
- Screenshots and Videos: Playwright can capture screenshots or video recordings of the test execution, providing a visual reference to better understand the test results.
- Logs and Debug Information: Detailed logs that can help developers debug issues by providing insights into browser actions, network requests, and responses.
Read More: Playwright Automation Framework: Tutorial
Steps to Get Started with Playwright
Getting started with Playwright involves several simple steps to set up the environment, install necessary dependencies, and write your first test.
Follow this step-by-step guide to get up and running with Playwright quickly.
Step 1: Install Node.js and Playwright
Install Node.js
- Ensure that Node.js is installed on your machine.
- After installation, check if Node.js is installed by running the following command in your terminal or command prompt:
node -v
Install Playwright
Once Node.js is installed, use npm (Node’s package manager) to install Playwright. Open your terminal and run:
npm init -y
This command initializes a new Node.js project and creates a package.json file.
Now, install Playwright using the following command:
npm install Playwright
This will install Playwright and its required dependencies.
Step 2: Write the Test Script
- Create a New JavaScript File
- In your project folder, create a new JavaScript file named test.js.
- Add the Playwright Test Code
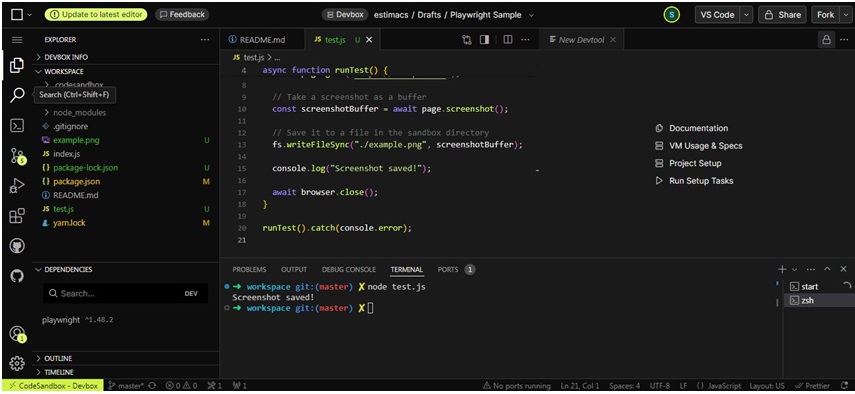
- Open the test.js file and write the following code:
const playwright = require('playwright');

const fs = require('fs');


async function runTest() {

  const browser = await playwright.chromium.launch({ headless: true });

  const page = await browser.newPage();

  await page.goto('https://example.com');


  // Take a screenshot as a buffer

  const screenshotBuffer = await page.screenshot();


  // Save it to a file in the current directory

  fs.writeFileSync('./example.png', screenshotBuffer);


  console.log('Screenshot saved!');


  await browser.close();

}


runTest().catch(console.error);
This script will launch a Chromium browser in headless mode (without a UI).
Navigate to https://example.com.
Take a screenshot of the page and save it as example.png.
Step 3: Run the Test Script
Open your terminal, navigate to the folder where test.js is saved, and run the following command:
node test.js
This will start Playwright.
- Open the browser
- Open the webpage for https://example.com and take a screenshot of the page
- Save the screenshot to your folder.
View the Output:
After running the script, the terminal should display the message Screenshot saved!, indicating that the screenshot has been successfully captured.
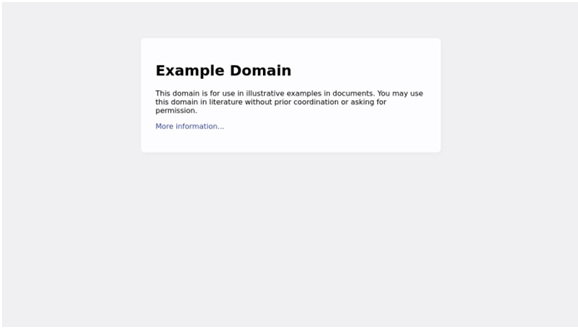
You should also see the example.png file saved in the same directory.
Step 4: Access and View the Screenshot
- Find the Screenshot
- Open your project folder and locate the example.png file.
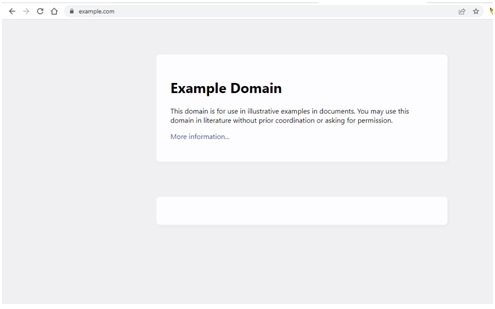
- This is the screenshot taken from https://example.com.
- Open the Screenshot
- Double-click on the example.png file to open it using your default image viewer.
Read More: How to start with Playwright Debugging?
Choosing the Right Type of Report
Test reports aren’t one-size-fits-all; they need to adapt to the needs of your team, your project scale, and the level of detail you require. Here’s how to evaluate and select the best fit for your testing goals.
Purpose of the Report
Define the primary goal of your report. If debugging is the focus, prioritize detailed reports with logs and screenshots. For monitoring trends or sharing results with stakeholders, opt for structured or visually appealing formats highlighting key outcomes.
Size of the Test Suite
Small test suites benefit from detailed reports that provide deep insights into each test case. Summary-based reports are better suited for larger test suites to manage information overload while highlighting overall performance.
Environment
Local development environments benefit from lightweight, real-time outputs like terminal-based reports. In CI/CD pipelines, choose reports that integrate seamlessly, automating storage and analysis for efficient workflows.
Level of Detail Required
Basic overviews, like pass/fail summaries, work well for quick checks. For detailed debugging or in-depth analysis, select reports that include logs, screenshots, or videos of the test execution.
Data Storage Needs
For short-term use, reports displayed in the terminal or in-memory are sufficient. Long-term analysis or compliance needs require exportable formats like JSON or JUnit for persistent storage and trend analysis.
Team Collaboration
Technical teams need detailed outputs to debug issues effectively. For non-technical stakeholders, visual or simplified reports make the information accessible and easier to interpret.
Customization Requirements
Consider whether the default report types meet your needs or if custom reports are necessary. Playwright supports creating tailored reporters to include specific data or formats unique to your workflow.
Read More: Run Playwright Tests at Scale on Cloud
Types of Playwright Reporting
Playwright offers several built-in reporters to cater to the needs of diverse testing projects. You can also custom-create reports exclusively for your testing suite and integrate third-party reporters for advanced analytics.
Playwright Reporting Types:
- Custom Reporters
- Third-Party Reporters
- Built-in Reporters in Playwright
Custom Reporters in Playwright
Playwright allows you to create custom reporters to tailor test reporting according to your specific needs. Custom reporters let you output test results in a format that fits your workflow or integrate them with other tools and platforms, such as custom dashboards, notifications, or external services.
A custom reporter in Playwright is a JavaScript class that implements a set of predefined methods.
These methods are triggered during different stages of the test run (before, after, when a test starts, finishes, or fails). You can control what is displayed, logged, or saved based on these methods.
Syntax of a Custom Reporter
To create a custom reporter, you need to define a class that extends Reporter. The key methods that you can override include:
- onBegin(): Called when the test suite begins.
- onTestBegin(): Called when a single test begins.
- onTestEnd(): Called when a test finishes.
- onEnd(): Called when the test suite ends.
Here’s a simple example of how to create a custom reporter that logs each test’s status and execution time:
const { Reporter } = require('@playwright/test');


class MyCustomReporter extends Reporter {

  onBegin(config, suite) {

    console.log('Test suite has started');

  }


  onTestBegin(test) {

    console.log(`Test started: ${test.title}`);

  }


  onTestEnd(test, result) {

    console.log(`Test finished: ${test.title}`);

    console.log(`Status: ${result.status}`);

    console.log(`Duration: ${result.duration}ms`);

  }


  onEnd() {

    console.log('Test suite has ended');

  }

}


module.exports = { MyCustomReporter };
In this example:
- onBegin logs when the test suite starts.
- onTestBegin logs when each test starts.
- onTestEnd logs when each test ends, showing the test status and duration.
- onEnd logs when the test suite ends.
Using the Custom Reporter
Once your custom reporter is ready, you need to tell Playwright to use it. You can do this by configuring the test runner in playwright.config.js:
const { defineConfig, devices } = require('@playwright/test');

const { MyCustomReporter } = require('./myCustomReporter');


module.exports = defineConfig({

  reporter: [

    [MyCustomReporter], // Register your custom reporter

    ['html', { open: 'never' }] // Add additional reporters if needed

  ],

});
This will use your MyCustomReporter in the Playwright test run. You can also combine it with other built-in reporters, such as HTML or JSON.
Custom reporters should be lightweight and only log the most necessary information. Overloading the reporter with excessive logging can slow down test execution and make the output difficult to digest.
Your custom reporter should be flexible enough to integrate with other tools. For instance, consider logging data in a structured format like JSON or sending reports to external services like Slack, email, or a custom dashboard.
Third-Party Reporters in Playwright
Playwright allows you to extend its built-in reporting capabilities by integrating third-party reporters. These external tools enhance the reporting process by providing advanced features, such as detailed HTML reports, real-time monitoring, and interactive dashboards.
Third-party reporters allow you to visualise test results in various formats, making tracking test performance, failures, and trends easier over time.
Integrating Allure Reporter
Allure is one of the most popular test reporting tools. It generates visually rich and interactive reports that show test execution details, including steps, logs, and attachments. Integrating Allure with Playwright enables you to get insightful, user-friendly reports for your test runs.
Steps to Integrate Allure with Playwright:
1. Install the Allure Reporter Package:
First, install the Allure Playwright reporter:
npm install --save-dev @playwright/test allure-playwright
2. Update playwright.config.js:
After installing the necessary package, modify the Playwright configuration file to use Allure reporter.
const { defineConfig } = require('@playwright/test');


module.exports = defineConfig({

  reporter: [

    ['allure-playwright'], // Use Allure Reporter

    ['html', { open: 'never' }]

  ],

});
3. Generate Allure Report:
After running your Playwright tests, generate the Allure report with the following command:
npx allure generate allure-results --clean

npx allure open
This will open the Allure report in your browser, showing detailed insights into your tests.
Best Practices:
- Keep your Allure results directory clean by adding the –clean flag while generating reports to avoid keeping stale data.
- Use Allure’s ability to attach screenshots, logs, and videos to enhance your reports.
Integrating HTML Reporter
Playwright provides an HTML reporter by default, but you can customize it or use a third-party HTML reporter to better visualize your test results.
1. Install the HTML Reporter Package:
Install the Playwright HTML reporter package:
npm install --save-dev @playwright/test
2. Configure Playwright for HTML Reporting:
In playwright.config.js, enable the HTML reporter:
const { defineConfig } = require('@playwright/test');


module.exports = defineConfig({

  reporter: [

    ['html', { open: 'never' }], // Use the built-in HTML reporter

  ],

});
3. View HTML Report:
After executing the tests, the HTML report will be saved in the playwright-report/ directory. You can open the index.html file in any browser to view the report.
Best Practices:
- Customise the HTML reporter by adding your logos, branding, or styling to match your company’s design language.
- Use open: ‘never’ to avoid automatically opening the report on every run if it is not needed.
Integrating Other Third-Party Reporters
Besides Allure and HTML, you can integrate various third-party reporters to match your specific needs, including JSON, JUnit, and others. Playwright’s flexibility allows you to choose the best reporter for your workflow, whether you’re interested in continuous integration (CI) tools, data analysis, or simply a clean log format.
JUnit reports are often used in CI/CD pipelines because they integrate seamlessly with tools like Jenkins, GitLab CI, and CircleCI.
1. Install JUnit Reporter:
npm install --save-dev @playwright/test junit-playwright
2. Configure Playwright for JUnit Reporting:
In playwright.config.js, use the JUnit reporter:
const { defineConfig } = require('@playwright/test');


module.exports = defineConfig({

  reporter: [

    ['junit', { outputFile: 'test-results.xml' }], // Use JUnit Reporter

  ],

});
3. View JUnit Report:
The JUnit report will be saved as an XML file, test-results.xml, which you can integrate into your CI/CD pipeline to analyse test results.
Best Practices:
- To manage multiple test results, keep JUnit reports in a designated folder, especially when integrating with CI tools.
- Configure the outputFile path to avoid overwriting existing test result files.
Built-in Reporters in Playwright
Playwright provides several built-in reporters designed to output test results in different formats, each serving unique needs for visibility and integration. These reporters are pre-configured for various use cases, making it easy for developers to integrate them without additional setup.
Below are the most commonly used built-in reporters in Playwright, along with their syntax and use cases:
List Reporter
The List Reporter outputs test results in a human-readable list format. It shows the names of the tests, along with their status (passed, failed, or skipped). This is ideal for a quick, high-level overview of test results, especially when running a small number of tests. It provides a simple but clear view of the testing process.
Syntax:
npx playwright test --reporter=list
Dot Reporter
The Dot Reporter outputs a series of dots representing the status of each test. Each dot corresponds to one test: a dot (.) for passed tests, an F for failed tests, and an S for skipped tests. This is best for quick feedback when running a large number of tests, as it condenses results into a compact and easy-to-digest format.
Syntax:
npx playwright test --reporter=dot
The JSON Reporter generates a machine-readable JSON file that contains detailed information about each test. This reporter is ideal for integration with other tools and for storing detailed results in a structured format. The JSON file can be parsed later to extract specific test details, such as execution time, failure messages, and test metadata.
Syntax:
npx playwright test --reporter=json
The JUnit Reporter produces test results in the JUnit XML format, which is widely used by many CI/CD tools (like Jenkins, GitLab CI, etc.). It offers a standardized format that allows easy integration with CI systems, providing information about passed and failed tests, along with error messages and stack traces.
Syntax:
npx playwright test --reporter=junit
The HTML Reporter generates a comprehensive and visually appealing HTML report. This report includes details about test status, screenshots, videos (if enabled), and logs. It’s perfect for sharing results with stakeholders who need to quickly understand the test outcomes, providing a user-friendly, visually rich summary.
Syntax:
npx playwright test --reporter=html
When to Use Each Reporter
Playwright’s built-in reporters are versatile and can be easily switched depending on your specific requirements for visibility, integration, and presentation of test results.
- List and Dot reporters are best for quick feedback during development or local test runs.
- JSON and JUnit reporters are ideal for automation in CI/CD pipelines where machine-readable formats are needed for integration with other tools.
- HTML Reporter is best for generating visually rich reports for stakeholders and team members needing a detailed test overview.
Generating Multiple Reports in Playwright
Generating multiple reports in Playwright allows testers to output test results in various formats simultaneously. This feature is especially useful when catering to diverse stakeholder needs, such as providing concise HTML reports for managers and detailed JSON reports for developers.
By leveraging this capability, teams can streamline communication and ensure that every report serves its intended audience effectively.
Playwright’s configuration file (playwright.config.ts or playwright.config.js) supports specifying multiple reporters. These reporters are listed under the reporter field, allowing you to generate multiple output formats for a single test run.
Each reporter can be customised to focus on specific aspects of the test results, ensuring flexibility and clarity.
Here’s a sample configuration to generate both an HTML report and a JSON report:
const config = {

  reporter: [

    ['html', { outputFolder: 'html-report' }],

    ['json', { outputFile: 'results.json' }],

  ],

  // Other configurations

};

export default config;
In this example, the HTML report will be saved in the html-report directory, while the JSON results will be stored in results.json.
This approach ensures that both human-readable and machine-parsable outputs are generated.
Playwright Reporting in CI/CD Pipelines
Integrating Playwright reporting into CI/CD pipelines streamlines automated test execution and delivers immediate feedback. Reports generated during testing provide actionable insights into test outcomes, helping developers address issues early.
Machine-readable formats like JSON or JUnit are particularly valuable as they integrate seamlessly with CI/CD tools such as Jenkins, GitHub Actions, and CircleCI, enabling clear visualization of test results and trends.
- Use concise, machine-readable reports for maximum efficiency.
- Store reports in organized, accessible locations within the pipeline.
- Automate alerts for failed tests using tools like Slack or email for prompt attention.
- Generate lightweight, critical insights to aid debugging without slowing the pipeline.
- Ensure faster releases and maintain consistent application quality.
Read More: 15 CI/CD Challenges and its Solutions
Importance of Test Automation Reports in Playwright
Test automation reports provide clear insights into test results, helping teams identify bugs and improve code quality. In Playwright, these reports offer valuable details like screenshots, videos, and logs, which aid in faster debugging. Integrated into CI/CD pipelines, Playwright reports allow for continuous feedback, ensuring consistent quality across releases.
BrowserStack Automate enhances Playwright testing by providing access to real devices and browsers, ensuring cross-browser compatibility and accurate results. This cloud-based solution enables testing across various environments without complex setups.
With seamless integration into CI/CD pipelines, BrowserStack Automate offers detailed reports and faster feedback. This helps teams catch issues early and streamline their testing process, boosting efficiency and ensuring web applications perform consistently in real user conditions.
Common Challenges in Playwright Reporting
Effective reporting is crucial to understanding the results of automated tests and improving overall testing efficiency.
However, in Playwright, various challenges can arise when generating and interpreting reports.
- Large test suites can overwhelm reports with excessive data, making it harder to identify key issues. Finding the balance between thoroughness and clarity is essential.
- Different environments, such as browsers and devices, can introduce inconsistencies in test results, leading to unreliable reports. Ensuring uniform testing conditions across platforms is crucial.
- Flaky tests can produce false positives or negatives, distorting report accuracy. Isolating and addressing flaky tests helps generate more reliable results.
- Performance issues like slow page loads can inflate execution times in reports, affecting accuracy. Addressing performance bottlenecks ensures clearer test results.
- Complex user flows, and dynamic content can overwhelm reports with unnecessary data. Configuring the report format to capture critical information ensures clarity.
Best Practices for Effective Playwright Test Reporting
Effective test reporting ensures that test results are clear and actionable, leading to meaningful insights.
Here are some best practices to enhance your Playwright test reporting:
- Define Clear Test Objectives: Before running tests, clearly define what you’re testing and what success looks like. Tailor your reports to focus on these specific metrics: functional accuracy, UI responsiveness, or performance.
- Use a Consistent Reporting Format: Adopt a consistent reporting format that is easy to interpret. Structured reports with details like test status, execution time, and error logs help developers and QA teams to pinpoint issues quickly.
- Integrate Visual Feedback: Capture and embed screenshots or videos into your test reports to provide visual context. This is especially useful for UI tests, helping teams visualize the application’s state during test failures.
- Leverage Test Grouping: Group tests logically by categories, such as by feature, user flow, or platform. This helps stakeholders quickly see the status of key application components and identify patterns in failures or performance issues.
- Ensure Reports are Easy to Share: Reports should be in formats that are easy to share and analyse (e.g., HTML, JSON, or interactive reports). Ensure that stakeholders—whether developers, testers, or product managers—can access the information without additional tools.
- Automate Report Generation and Distribution: Automating the process of generating and distributing test reports ensures that the relevant team members are always up to date. Use continuous integration (CI) tools to automatically trigger the report creation and distribution after each test run.
BrowserStack Test Reporting and Analytics for Playwright Reporting
With BrowserStack Test Reporting and Analytics, you can keep track of every Playwright Automation build run by creating a detailed Playwright Test Report on the Observability Dashboard with all historical data. Here are the features of Test Reporting and Analytics that can enhance Playwright Reporting:
- Get Detailed Test Build Insights: Access comprehensive test build insights, such as performance, flakiness, new failures, always failing, build stability, run summary, and more.
- Track Failure Rate of Test Build: Understand the performance of each test build and track the failure rate of tests, flakiness, and average failure rate to monitor the test suite’s health.
- Better Team Collaboration: You can download & share report PDFs of build insights, unique errors, test health, testing trends, etc., with your team.
- Complete End-to-End Visibility: Access interactive testing trends charts that offer 360-degree end-to-end visibility into automation metrics for all projects and modules.
- Enhanced Debugging with Rich Artifacts: Detect and debug issues in your test build via detailed analytics and rich artifacts on the central test automation dashboard.
- Get Historical Data and Trends: Spot trends with detailed historical data for all re-runs and merged runs of test builds to analyze reoccurring issues.
Advanced Reporting Techniques with Playwright
For teams looking to take their Playwright test reporting to the next level, here are some advanced techniques that can provide deeper insights into your application’s performance and stability.
- Custom Reporters for Tailored Insights: Creating custom reporters allows you to adapt the Playwright’s output to your specific needs. You can format the report to capture critical data points like API responses, network requests, or performance metrics, all of which can be highly valuable for advanced testing scenarios.
- Integrating with Third-Party Reporting Tools: For more robust reporting, integrate Playwright with third-party tools like Allure or HTML reporters. These tools provide advanced features such as detailed visual reports, easy tracking of test history, and the ability to create interactive dashboards.
- Parallel Test Execution with Custom Reporting: When running tests in parallel, it’s important to maintain clarity in your reports. Grouping test results by execution thread or worker helps identify issues specific to particular test environments. Playwright’s built-in features support parallel test execution, and you can combine this with custom reports to provide a deeper breakdown of performance across multiple threads.
- Real-Time Reporting for Continuous Feedback: For teams using continuous testing in CI/CD pipelines, real-time reporting can provide instant feedback during test runs. Playwright can integrate with CI tools (like Jenkins or GitHub Actions) to deliver reports on test progress and results while the tests are running.
Read More: Top 9 Automated Reporting Tools for Testing
Conclusion
Playwright’s Test Report features offer a powerful way to improve your testing process. With tools like detailed logs, screenshots, and videos, you can quickly identify issues and understand test failures better. A well-structured reporting setup speeds up debugging and ensures reliable and efficient test results.
You can streamline your workflow and enhance your test automation by continuously refining your approach to reporting and integrating Playwright’s tools into your CI/CD pipeline.
Adopting best practices for reporting will help ensure smoother, more accurate testing, leading to faster issue resolution and improved software quality.
Useful Resources for Playwright
Understanding Playwright
- Playwright Automation Framework
- Playwright Java Tutorial
- Playwright Python tutorial
- Playwright Debugging
- End to End Testing using Playwright
- Visual Regression Testing Using Playwright
- Mastering End-to-End Testing with Playwright and Docker
- Page Object Model in Playwright
- Scroll to Element in Playwright
- Understanding Playwright Assertions
- Cross Browser Testing using Playwright
- Playwright Selectors
- Playwright and Cucumber Automation
Tool Comparisons:


