When building web applications, ensuring they perform reliably under real-world user loads is critical. As concurrent users access and interact with the app, performance issues like slow response times or crashes can emerge.
Overview
What is Cypress Performance Testing?
Cypress performance testing evaluates how a web application performs under various load conditions using Cypress to monitor responsiveness, stability, and speed during user interactions.
Key Best Practices for Cypress Performance Testing
- Use geolocation features (like those in BrowserStack Automate) to simulate performance in different regions.
- Define performance benchmarks specific to your application’s requirements.
- Integrate Lighthouse tests into your regular suite and run them across varied device types.
Although Cypress is widely used for functional testing, this guide explores how it can be adapted to support performance testing needs effectively.
What is Cypress Performance Testing?
Cypress is widely used for end-to-end and UI testing, but with the help of plugins and custom utilities, it can also support performance testing.
By extending its functionality, Cypress can monitor page load times, track key performance metrics, and analyze application behavior under various conditions. This makes it a practical option for identifying performance bottlenecks besides functional testing.
Must Read: Cypress End to End Testing: Tutorial
Load Testing with Cypress
While Cypress is primarily built for functional and UI testing in modern JavaScript applications, it can be extended to support load testing through community-driven plugins.
Although Cypress doesn’t natively support performance testing, tools like Google Lighthouse can be integrated to simulate user load and assess app performance under stress.
This allows teams to conduct basic load and stress testing using Cypress as part of a broader performance testing strategy.
Using Google Lighthouse for Cypress Performance Testing
Google Lighthouse is a powerful tool integrated into Chrome that measures web performance and identifies issues such as slow loading times, inefficient images, and poorly optimized code.
Key aspects about using Lighthouse with Cypress for Performance Testing:
- Lighthouse helps identify performance issues like slow load times, large images, and inefficient code.
- Easily accessible through the Lighthouse tab in Chrome DevTools.
- For more flexibility, you can use the Lighthouse CLI to run tests outside Chrome DevTools.
- Integrates Lighthouse directly into your Cypress tests, enabling you to run performance tests as part of your automation suite.
- Combining Cypress and Lighthouse allows for automated performance testing alongside functional tests, ensuring consistent performance across your web application.
Also Read: Top 20 Performance Testing Tools in 2025
Performance Testing with Cypress and Lighthouse
For performance testing with Cypress, use the Cypress Audit plugin in combination with Google Lighthouse.
This setup enables performance audits on web applications, providing key metrics around page speed, load time, and overall performance. Google Lighthouse helps interpret these metrics and highlights areas for optimization.
Pre-requisites for Performance Testing with Cypress
Below are the pre-requisites to get started:
- Ensure that you have a Cypress E2E project.
- Install the `cypress-audit/lighthouse` module in your project
npm i -D cypress @cypress-audit/lighthouse
- Add the initialization code to the `cypress.config.js` file
const { lighthouse, prepareAudit } = require("@cypress-audit/lighthouse");
// const { pa11y } = require("@cypress-audit/pa11y");
module.exports = {
e2e: {
baseUrl: "http://bstackdemo.com", // this is your app
setupNodeEvents(on, config) {
on("before:browser:launch", (browser = {}, launchOptions) => {
prepareAudit(launchOptions);
});
on("task", {
lighthouse: lighthouse(),
// pa11y: pa11y(console.log.bind(console)),
});
},
},
};- Import the Lighthouse commands to the `support/command.js`file in your project:
import '@cypress-audit/lighthouse/commands';
Step-by-step guide to run your Lighthouse performance tests
This section demonstrates how to run performance tests on bstackdemo.com to view default performance and SEO metrics.
After the initial test, thresholds are defined to validate the metrics against acceptable performance standards.
Part 1: Run Lighthouse performance test without thresholds
Step 1: Add the following code to your spec file:
describe('Bstackdemo', () => {
it('should run lighthouse performance audits using default thresholds', () => {
cy.visit('/');
cy.lighthouse();
});
});
Step 2: In your terminal, run the below command to run your tests in the Chrome browser.
npx cypress open
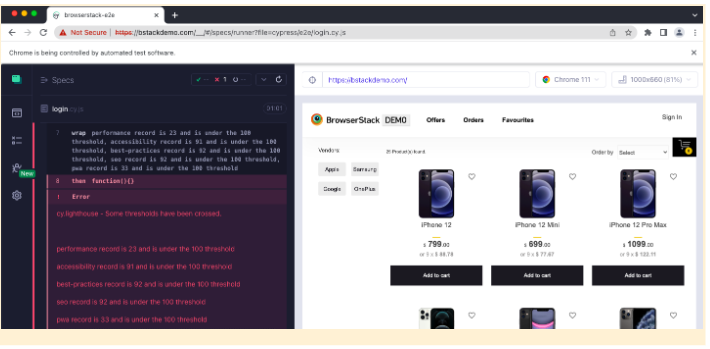
The following result is seen:
Part 2: Run Lighthouse performance with threshold
Step 1: Add the following code to your spec file:
describe('Bstackdemo', () => {
it('should run lighthouse performance audits using custom thresholds', () => {
const thresholds = {
performance: 50,
accessibility: 80,
'first-contentful-paint': 2000,
'largest-contentful-paint': 3000,
interactive: 2000,
seo: 60,
pwa: 50,
};
const lighthouseConfig = {
formFactor: 'desktop',
screenEmulation: { disabled: true },
};
cy.visit('/');
cy.lighthouse(thresholds, lighthouseConfig);
});
});
In your terminal, run the below command to run your tests in the Chrome browser.
npx cypress open
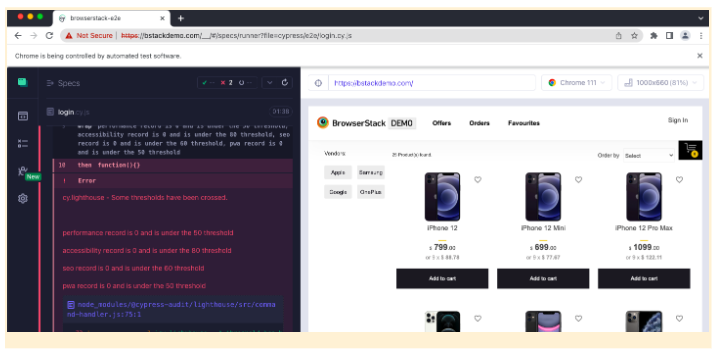
The following result is seen:
Analyzing Performance Test Results
After running both default and custom threshold performance tests, it becomes clear how metric configurations can impact results. Custom thresholds help effectively maintain performance standards.
- Part 1 runs the application against Google Lighthouse’s default performance metrics.
- Part 2 uses custom thresholds, which caused performance scores to drop significantly.
- These thresholds help enforce minimum performance levels and highlight areas needing optimization.
Cypress Performance Testing with BrowserStack
Websites often face performance challenges under heavy traffic, resulting in slow load times, crashes, and a poor user experience.
BrowserStack Load Testing provides teams with a powerful, cloud-based platform to accurately measure, analyze, and optimize website performance with unmatched precision and flexibility.
Why Choose BrowserStack for Cypress Performance Testing?
Here’s why BrowserStack is the ideal solution for your load testing needs:
- Simulate Real-World Traffic: Generate thousands of virtual users from various geographies without the need for complex infrastructure, replicating actual user behavior.
- Unified Insights Across the Stack: View both frontend and backend metrics on a single dashboard, allowing you to spot bottlenecks early and troubleshoot issues quickly.
- Seamless CI/CD Integration: Run both browser and API load tests directly from your existing test scripts with minimal setup, ensuring performance regressions are detected before they hit production.
Load testing is essential to ensure your website can handle real-world traffic without failures. BrowserStack enables you to simulate thousands of virtual users from different locations, helping you identify bottlenecks early and optimize performance.
With unified reporting that covers both frontend and backend metrics, you can efficiently troubleshoot issues and ensure your app stays fast and reliable under varying load conditions.
Best Practices for Performance Testing with Cypress
Following a few best practices is important to get reliable and actionable insights from Cypress performance tests, especially when using Lighthouse alongside Cypress.
- Run Lighthouse in different geolocations to simulate real user conditions.
- Define custom performance thresholds tailored to your application’s needs.
- Schedule Lighthouse tests regularly across a variety of devices and browsers.
- Integrate performance checks into CI pipelines for early issue detection.
Conclusion
Performance testing is an important lever in testing the stability of your web application.Through Cypress and Lighthouse though you can analyze performance, you cannot ascertain if the experience on multiple devices and operating systems will remain consistent.
To ensure consistent performance, you can rely on simulating real devices. Using BrowserStack Automate and Cypress, you get access to a real device cloud. Apart from this, when you use BrowserStack, you can record your tests, generate reports, and more.
Useful Resources for Cypress
Understanding Cypress
- Cross Browser Testing with Cypress : Tutorial
- Run Cypress tests in parallel without Dashboard: Tutorial
- Handling Test Failures in Cypress A Comprehensive Guide
- Cypress Test Runner: Tutorial
- Handling Touch and Mouse events using Cypress
- Cypress Automation Tutorial
- CSS Selectors in Cypress
- Performance Testing with Cypress: A detailed Guide
- Cypress Best Practices for Test Automation
- Test React Native Apps with Cypress
- Cypress E2E Angular Testing: Advanced Tutorial
- Cypress Locators : How to find HTML elements
- Maximizing Web Security with Cypress: A Step-by-Step Guide
- Conditional Testing in Cypress: Tutorial
- Cypress Web Testing Framework: Getting Started
- Cypress Disable Test: How to use Skip and Only in Cypress
- What’s new in Cypress 10? How it will change your current testing requirements
Use Cases
- How to Record Cypress Tests? (Detailed Guide)
- How to run your first Visual Test with Cypress
- How to Fill and Submit Forms in Cypress
- How to Automate Localization Testing using Cypress
- How to run Cypress Tests in Chrome and Edge
- How to use Cypress App Actions?
- How to Run Cypress Tests for your Create-React-App Application
- How to Run Cypress Tests in Parallel
- How to handle Click Events in Cypress
- How to Test React using Cypress
- How to Perform Visual Testing for Components in Cypress
- How to run UI tests in Cypress
- How to test redirect with Cypress
- How to Perform Screenshot Testing in Cypress
- How to write Test Case in Cypress: (with testing example)
Tool Comparisons

