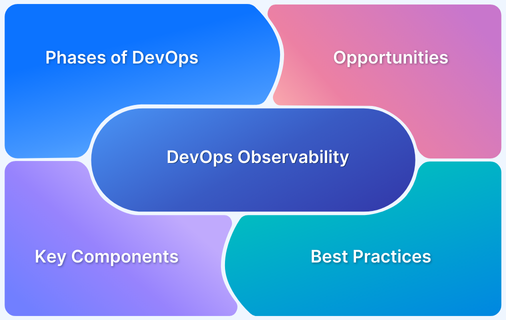
Observability in DevOps refers to understanding a system’s internal state by analyzing its external outputs. It involves collecting, analyzing, and leveraging data to monitor and understand a software application’s real-time performance and behavior.
DevOps Observability helps teams:
- Quickly identify and resolve system issues.
- Monitor system performance and behavior in real time.
- Ensure systems are consistently available and performant.
- Minimize downtime with proactive alerts and diagnostics.
- Leverage data-driven insights for system improvements.
- Align teams with shared visibility into system operations.
This guide explains DevOps Observability, its significance, phases, key components, best practices, and more.
What is Observability in DevOps?
Observability in DevOps helps teams understand what’s happening inside a complex system by looking at the data it generates, like logs, metrics, and traces. With observability, teams can keep an eye on applications in real time, catch issues as they come up, and get a clearer picture of how the system is behaving overall. This means faster troubleshooting and a more reliable system.
Observability in DevOps not only helps detect issues but also enables teams to prevent potential problems by identifying patterns before they impact users. It promotes collaboration across development and operations teams by offering shared visibility into system health. For complex systems like microservices, observability enhances transparency by tracing requests across services and revealing dependencies.
It also empowers automation, allowing teams to set up automated responses to incidents. Additionally, continuous feedback from observability helps development teams understand the impact of code changes, driving informed decisions and improving system performance over time.
Learn More: What are the tools used in DevOps?
Phases of DevOps Observability
The phases of DevOps observability are all about gradually improving how well we can see, understand, and control what’s going on in a system so that we can solve issues quickly and prevent them from happening in the first place. Here’s how each phase plays out:
Phases of DevOps Observability
- Collecting Data
- Aggregating and Storing Data
- Analyzing and Visualizing Data
- Setting Up Alerts and Responding to Incidents
- Optimizing and Continuously Improving
1. Collecting Data: First, QAs gather data from the system. This includes capturing logs (which tell us about events and errors), metrics (like CPU usage and memory), and traces (which show the flow of requests across different services). This collected data is the starting point for getting a clear view of what’s happening.
2. Aggregating and Storing Data: Once the data is gathered, it’s time to pull it all together in one place. Tools like the ELK Stack, Prometheus, or Grafana help centralize everything so that we can access and analyze data from multiple sources in real time. This makes it easier to spot connections and understand patterns.
3. Analyzing and Visualizing Data: With data in a centralized location, we can analyze it and create visualizations. Dashboards and graphs make it easier to see trends, detect patterns, and notice potential issues quickly. These visuals give teams a snapshot of system health, so they can get insights at a glance.
4. Setting Up Alerts and Responding to Incidents: At this point, we can set up alerts to notify us when something goes wrong or when certain conditions are met. By having alerts in place, teams are immediately informed of potential problems and can take action right away before they affect users.
5. Optimizing and Continuously Improving: The final phase is about using all the insights gathered to keep improving the system. By monitoring continuously and creating feedback loops, teams can find ways to optimize performance and resilience, ultimately reducing downtime and boosting the user experience.
DevOps Observability Opportunities
Observability enhances service-level metrics. Companies see its worth—and expect to spend more on it.
The observability market includes a wide range of categories, such as app performance monitoring, which according to Gartner will become a USD 6.8 billion market by the year 2024.
As per the Enterprise Strategy Group’s State of Observability survey, worldwide IT leaders are convinced of the worth of observability. A full ninety percent of survey participants said they projected it to become the famous pillar of enterprise IT.
Importance of DevOps Observability
Modern cloud app environments are complicated, running across 100s or even 1000s of compute instances in multi systems with individual operations. With the progress of microservices adoption, numerous individual and isolated system elements make tracing the source of failure time-consuming and challenging.
- As more organizations adopt agile approaches, the frequency of deployments allows DevOps teams to speed up software delivery.
- Regular deployments in any system mean introducing high risk into the system.
- With attention to CI/CD, DevOps teams rely on response to debug and diagnose systems efficiently.
- Observability gives that feedback. Automation is a crucial element in DevOps. It allows teams to unite the right people with the right processes, take action with shared data, increase performance across the complete organization, and tie it to definite business outputs.
- Observability is a procedure of proficiently giving proper contexts to all types of data that the app environment yields so that it is simpler to audit the result repeatedly.
- It is based on exploring patterns and properties not defined in advance.
Automation keeps observability information flowing. Observability allows DevOps teams to comprehend what’s happening across multi technologies and environments to find and resolve critical problems. It keeps systems reliable and efficient and clientele happy.
Learn More: How DevOps and Cloud work together
What are the Key Components of Observability?
These components are the key pillars of observability! They are:
- Event Logs- Event logs are just a written record of events continuing in the system. Logs give you an insight into errors and events experienced by the system, giving context to the issue at hand.
- Metrics- Metrics are a series of data that display a system’s performance. They are gathered over a definite period, weeks, days, or even months. Metrics deliver a constant, point-in-time impression of the system. This lets DevOps developers and teams spot particular trends as regards the system’s performance.
- Traces- A trace gives DevOps teams an outline of the system based on the transaction or request made in the system. Firstly, a request is prepared for the system, & after that, it records the flow of any request from 1 service to another.
Benefits of DevOps Observability
Here are some of the key benefits of DevOps Observability:
- Better Alerting: Observability assists developers in discovering and mitigate issues faster, giving in-depth visibility that allows them to rapidly determine what has been modified in the system and debug or fix the issues.
- Unfailing Infrastructure: Observability assists in examining system availability, network, user behavior, capacity, and other metrics to ensure the system performs as it has to.
- Security & Compliance: A system’s observability is extremely important to companies with regulatory or compliance necessities to protect sensitive data.
- Unified/Linked Context: Information requires to be linked to know-how the relationships between system elements and how they tie to your business.
- Superior visibility: Sprawling distributed systems sometimes makes it tough for developers to know what solutions are in production, whether app performance is robust, who owns a specific service, or whatever the system looked like before the latest deployment.
- Improved workflow: Observability also allows developers to see a request’s comprehensive journey, accompanied by relevant contextualized info about a specific problem, improving its performance.
Implementing DevOps Observability
Implementing DevOps observability is all about ensuring you have clear visibility into your system’s performance and behavior. It’s like having a dashboard for your application, where you can easily spot issues, track performance, and ensure everything’s running smoothly.
Here’s a simple way to get started with DevOps Implementation:
- Set Clear Goals: Decide what you want to keep an eye on—whether it’s application speed, error rates, uptime, or system reliability.
- Pick the Right Tools: Use observability tools like logging, metrics, and tracing that fit into your CI/CD pipeline to gather the data you need.
- Integrate Into Your Workflow: Connect your tools to your automation frameworks, so the system continuously tracks and notifies you of potential issues.
- Automate the Process: Set up automated alerts and dashboards that keep you informed, so you don’t have to manually check everything.
BrowserStack makes observability easier, especially for automated testing. Here’s how you can bring it into your DevOps pipeline:
- Integrate with Your Tests: BrowserStack works with popular testing frameworks like WebdriverIO, MochaJS, and TestNG. With Test Observability, you can get a detailed view of test runs, see which tests fail, and understand exactly why.
- Continuous Monitoring: Whether you’re testing on BrowserStack’s cloud or locally, you can monitor your test results and get insights into any issues with your builds and tests.
- Better Debugging: Features like Timeline Debugging give you a visual history of test runs, so you can spot problems quickly by reviewing logs and videos.
- Automated Alerts: Get real-time alerts when tests fail and even report bugs directly to tools like Jira, making collaboration much smoother.
DevOps Tools
DevOps tools streamline the collaboration between development and operations teams, enabling faster and more efficient software delivery. These tools are essential for automating processes, managing infrastructure, and maintaining system reliability.
Here are some of the top DevOps Tools to consider:
- Ansible
- Puppet
- Chef
- Bamboo
- TravisCI
- CircleCI
- Git
- GitHub
- Bitbucket
- Selenium
- BrowserStack
- JUnit
BrowserStack integrates seamlessly with top DevOps tools like Jenkins, CircleCI, and TravisCI, enabling automated cross-browser testing within CI/CD pipelines for faster and more reliable deployments.
Why use BrowserStack for DevOps Observability?
BrowserStack Test Observability tool enhances DevOps observability by providing real-time insights into web applications’ performance across various browsers and devices. It helps teams monitor, debug, and optimize applications, ensuring system reliability and efficiency.
Some of the key Features to consider BrowserStack for Test Observability are:
- Cross-device and Cross browser Testing: Test on 3500+ real browsers and devices for comprehensive coverage.
- Real-time Debugging: View logs, network requests, and screenshots to debug issues instantly.
- Automated Visual Testing: Automate visual regression tests to ensure UI consistency across environments.
- Performance Monitoring: Track page load times and responsiveness to catch performance issues early.
- CI/CD Integration: Easily integrates with Jenkins, GitHub Actions, and other tools to run tests as part of the CI pipeline.
- Automation Support: Compatible with Selenium, Cypress, Appium, and Playwright for automated testing.
- Parallel Testing: Run multiple tests simultaneously across different environments to speed up the testing cycle.
- End-to-End Monitoring: Provides continuous observability throughout the development cycle.
- API and Reporting: Offers API access to pull test data into observability dashboards.
- Collaboration: Share results and logs with teams for quicker problem resolution.
Common Challenges in Observability with Solutions
Here are some challenges to bear in mind when you are integrating observability into DevOps:
1: Lack of Appropriate Tools
Without the right tools, it becomes difficult to properly observe actions within a system. Teams may struggle to collect accurate data, which can lead to inconsistent information and improper alerts.
Solution:
- Invest in the right observability tools that allow you to capture logs, metrics, and traces accurately.
- Use tools like Prometheus for metrics, ELK Stack for logs, and Jaeger for tracing to ensure comprehensive data collection.
2: Irregular Distribution of Data
Often, IT organizations limit the understanding of observability systems to just the DevOps team. This leads to a siloed approach, where data isn’t shared evenly across the organization, making debugging more challenging.
Solution:
- Ensure observability is integrated across all teams within the organization, not just DevOps.
- Share data insights regularly with development, QA, and operations teams to create a collaborative environment for debugging and problem-solving.
3: Ineffective Alerting System
Developers tend to set up symptom-based alerts, often overlooking the root causes of issues. This can result in an overload of alerts for minor errors, while ignoring the critical underlying causes.
Solution:
- Focus on setting up cause-based alerts rather than symptom-based ones.
- Tailor alerts to identify the root causes of issues to avoid alert fatigue and ensure that the team can focus on addressing the actual problems.
4: Data Overload
When collecting extensive logs, metrics, and traces, teams can become overwhelmed by the sheer volume of data. This can make it difficult to identify important signals and quickly address issues, leading to delays and inefficiencies.
Solution:
- Implement data filtering and aggregation techniques to ensure that only relevant, high-priority data is captured and processed.
- Use machine learning or AI-driven analytics to help detect anomalies and patterns in the data, enabling more efficient detection of issues.
5: Difficulty in Correlating Data Across Systems
In complex distributed systems, it can be challenging to correlate data across various microservices or components. This makes it harder to get a clear picture of how an issue in one service affects others.
Solution:
- Adopt a centralized observability platform that integrates logs, metrics, and traces from all services.
- Use distributed tracing (example, OpenTelemetry or Jaeger) to follow requests across microservices and visualize how each part of the system contributes to performance or failures.
Best Practices in Observability
Some of the best practices for Observability in DevOps include:
- Centralize Your Data: Make sure all logs, metrics, and traces are collected in one place. This way, teams can easily access and analyze the data without jumping between different tools.
- Define Key Metrics: Focus on the most important metrics for your system’s health, like response times, error rates, and system resource usage. This helps you prioritize what to monitor.
- Use Distributed Tracing: With microservices, use distributed tracing to track requests across services. This makes it much easier to see where problems are coming from.
- Set Up Alerts Wisely: Don’t overload your team with alerts. Set thresholds that matter and focus on critical issues to avoid alert fatigue.
- Automate Everything: Automate monitoring and incident response wherever possible. This ensures faster issue detection and resolution, reducing downtime.
- Continuously Improve: Regularly review your observability setup. As your system evolves, make sure your monitoring and alerting stay relevant and effective.
- Share Insights Across Teams: Observability data should be accessible to both dev and ops teams. This encourages collaboration and speeds up troubleshooting.
Future of DevOps Observability
An observability approach eradicates the potential threats of missing problems directly influencing app performance and creates an improved, complete experience.
By 2025, 88–97 percent of seventeen diverse observability capacities are projected to be deployed. Very few respondents did not expect to employ these observability capacities (2–7%). This mentioned intent to employ a huge number of observability capacities is the most eye-opening result from this study as it put forward that most companies may have robust observability practices in place by 2025.
BrowserStack Test Observability is actively solving that issue in Test Observability, wherein teams can not only re-run tests but also map the re-runs automatically with the previous runs of similar test cases and reveal only the current status of the test.
The following scenarios are supported:
- Framework automatically re-tries a failed test case.
- You can re-triggering the Continuous Integration job with failed test cases.
- The same Continuous Integration job invokes the test runner with the failed test cases.
- You can re-run test cases (multiple or even single tests) during manual analysis.
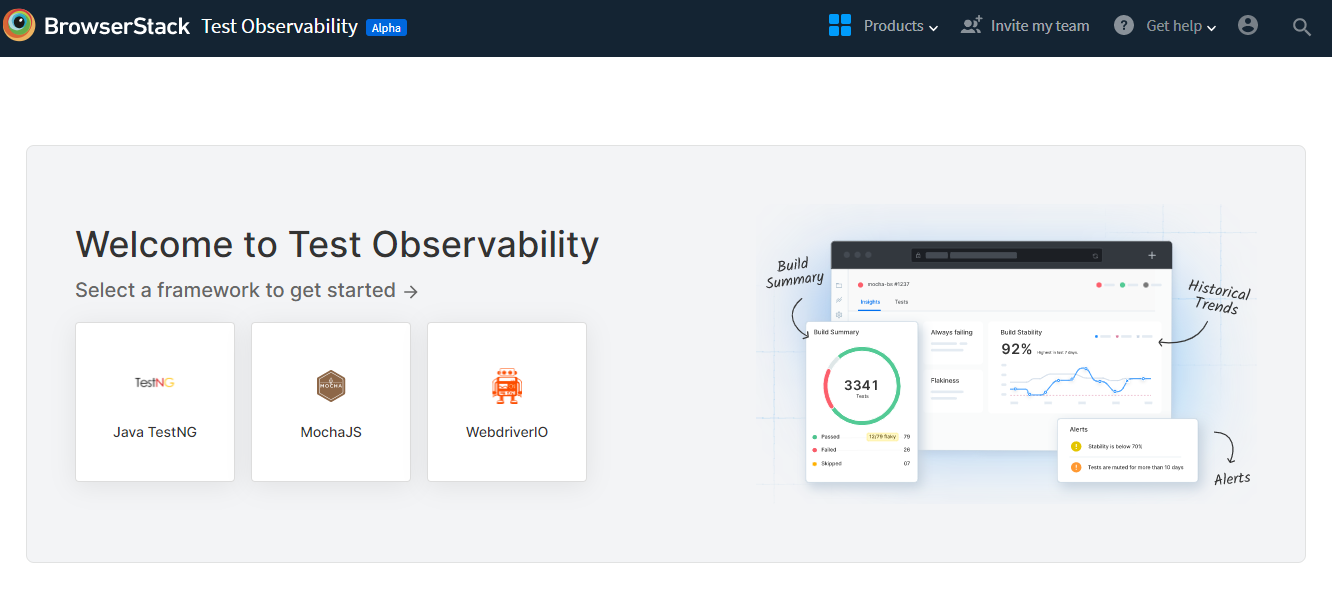
Quick start guide to integrating BrowserStack Test Observability with TestNG
Pre-requisites:
- You need a TestNG test suite
- You might run your tests on BrowserStack App Automate or Automate.
- Your tests can be functional/integration/ unit or of any nature.
- WebdriverIO
- MochaJS
- TestNG
Integrate with Test Observability
You can make use of Test Observability both when you are using BrowserStack’s browsers and devices to execute functional E2E tests and also if you are running tests locally on your CI/ laptop system or even when you are using some other cloud-based provider. Not just that, Test Observability is uncertain to the type of tests; hence, you can incorporate it with your integration or unit test suite.
Documentation: Test Observability with BrowserStack
Conclusion
Observability is still an evolving technology; few companies and professionals completely understand its importance. Many companies rely on a series of fragmented observability tools in DevOps to accomplish observability goals.
Ultimately, shifting observability left along the Continuous Integration/Continuous Deployment pipeline means potential SLO (service-level objective) deltas are caught before they reach production. DevOps teams looking to offer enhancement to app performance & business results can look to observability as a means to deliver both.
BrowserStack Test Observability empowers teams to streamline test debugging and performance analysis with real-time insights and actionable data. Enhance your CI/CD pipeline with unparalleled visibility into test executions for faster, more reliable releases.
Useful Resources for DevOps
Understanding DevOps:
- What is DevOps
- DevOps Shift Left Testing: A Detailed Guide
- What is the ultimate goal of DevOps?
- Benefits of DevOps
- What is DevOps Configuration Management?
- What is Continuous Delivery in DevOps?
- What is a DevOps Pipeline? How to Build One
- What is DevOps Observability (Importance & Best Practices)
- DevOps Testing Strategy
- How to improve DevOps Feedback Loop
- Python For DevOps: An Ultimate Guide
- What is DevOps Automation and How is it Helpful?
- Importance of DevOps Team Structure
- The Role of QA in DevOps
- Top Challenges in DevOps and How to Solve Them
- Top 21 Monitoring Tools in DevOps for 2024
Know the difference:
- DevOps vs Scrum: Key Differences
- Breaking Down MLOps vs DevOps: Similarities and Differences
- DevOps vs SysOps: What are the major differences
- DataOps vs DevOps: Key Differences
- TechOps, DevOps, and NoOps: Which one is right for you?
- DevOps vs CloudOps: How are they different
- DevOps Engineer vs Full Stack Developer: Differences
- Synchronize Business Analysis, DevOps, and QA with Cloud Testing
