How fast does an app need to load before users give up? Research shows that 90 percent of users uninstall apps due to poor performance. Slow load times, crashes, and laggy interactions frustrate users and drive them away.
Performance problems can be tricky to catch during development. An app might run perfectly on a new iPhone in the office but crash on a three-year-old Android device. It may load instantly over WiFi but stall on a weak mobile connection.
Performance testing helps teams identify these issues before they reach users. It measures how an app behaves under different conditions, across real devices, operating systems, and network speeds, catching slowdowns, memory leaks, and crashes early.
This guide covers what mobile app performance testing is, the tools that measure it, the metrics that matter, and how to test efficiently.
What Is Mobile App Performance Testing?
Mobile app performance testing is crucial for app development. It assesses how well an app performs under various conditions involving multiple network speeds, user loads, and devices.
It evaluates the mobile app’s speed, stability, responsiveness, and overall performance under various conditions. The main goal of performance testing is to ensure that the app provides a consistent and positive user experience across different devices, scenarios, or networks.
Read More: Android app performance testing.
What are the Mobile App Performance Test Tools?
Mobile app performance testing tools are specialized software solutions designed to assess and improve mobile applications’ performance, responsiveness, and stability. These tools help developers and testers identify and fix performance bottlenecks and ensure that apps run smoothly across various devices and network conditions.
Every performance testing tool offers distinct advantages depending on the app’s complexity, tech stack, and target platforms. BrowserStack’s specialists can help you assess these tools against your performance goals and identify the most effective setup for testing on real mobile devices and networks.
Get Expert QA Guidance Today
Schedule a call with BrowserStack QA specialists to discuss your testing challenges, automation strategies, and tool integrations. Gain actionable insights tailored to your projects and ensure faster, more reliable software delivery.
Top Mobile App Performance Test Tools
1. BrowserStack
BrowserStack is a cloud-based solution allowing testing on 3500+ real devices and browsers.
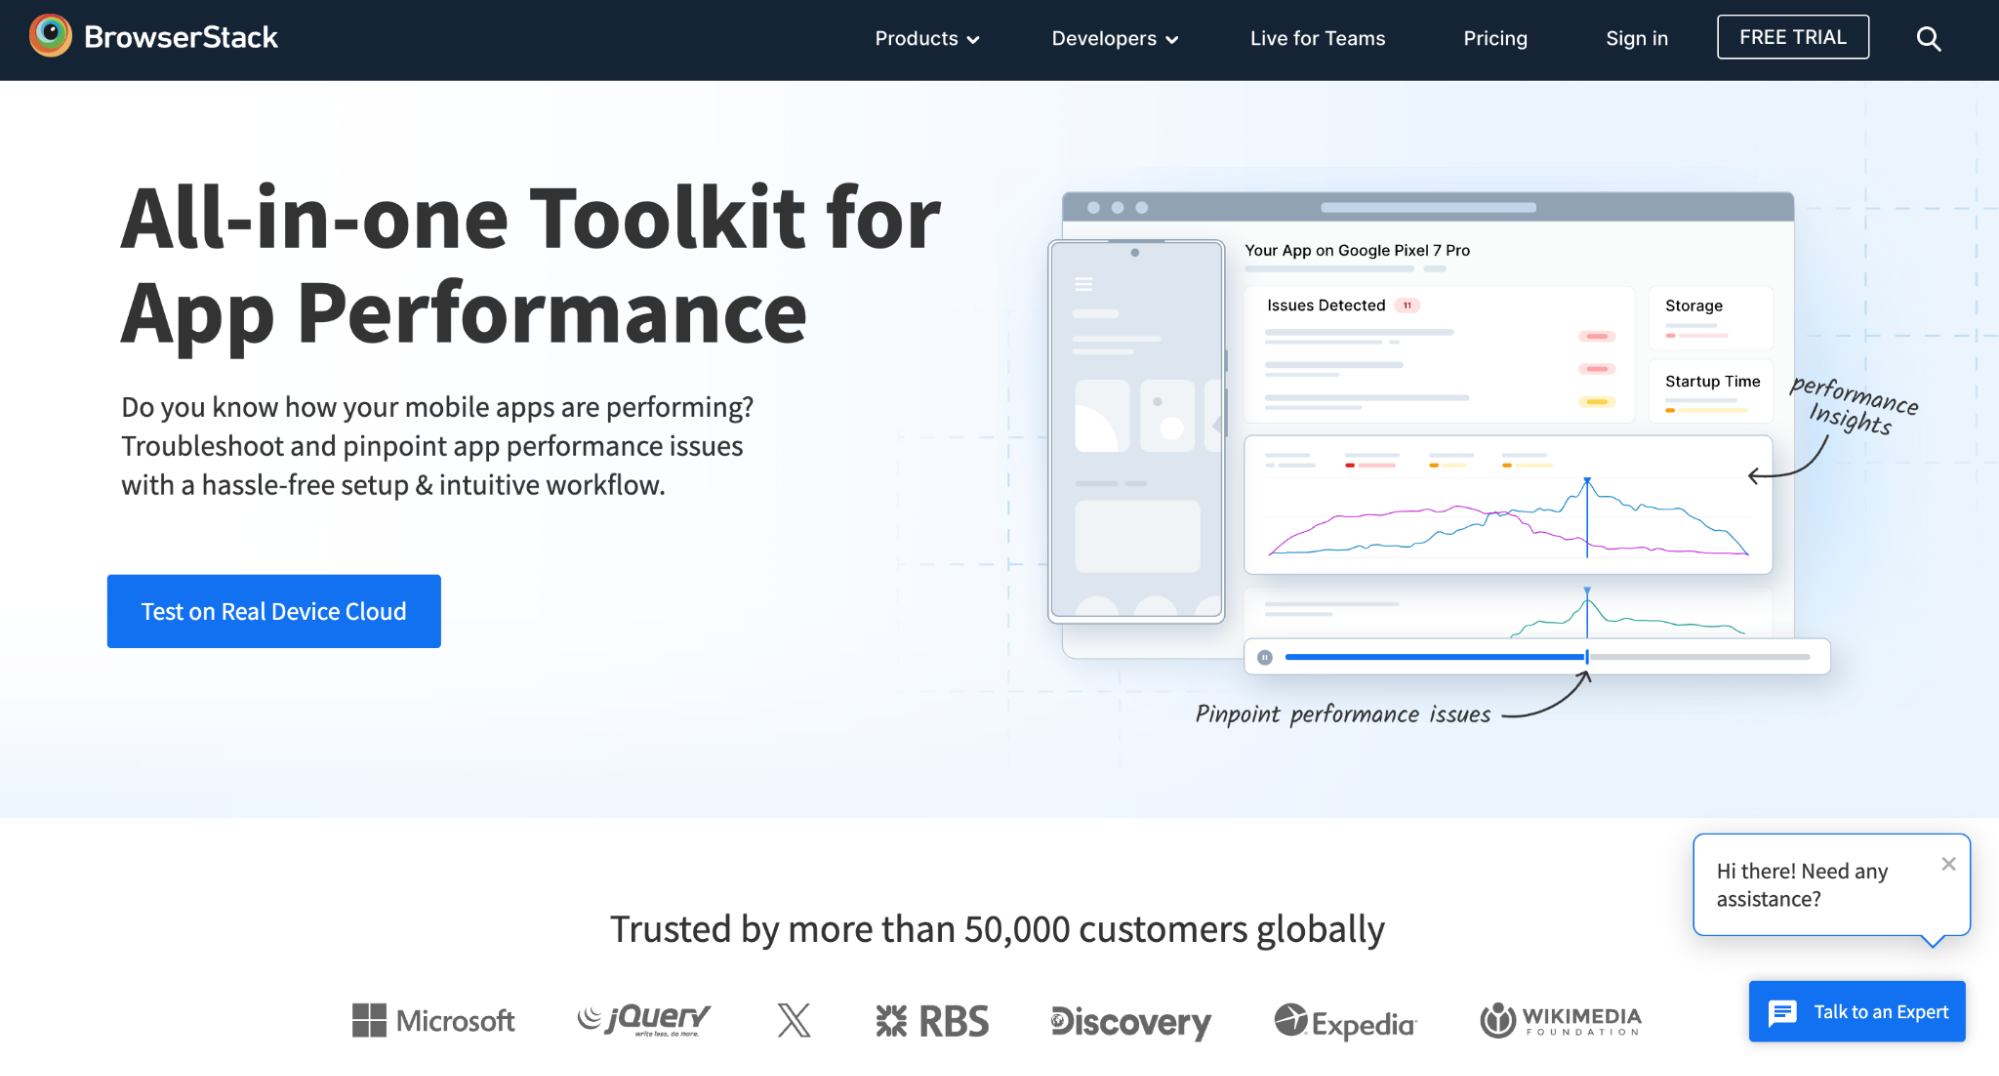
It offers multiple mobile app testing tools, including App Live and App Automate, and an exclusive platform, App Performance, for testing how well your mobile app performs.
These tools help test app performance by providing access to a vast cloud of real devices, enabling comprehensive performance monitoring, debugging, and testing under real-world conditions to ensure a seamless user experience.
It simplifies identifying and resolving performance issues across various metrics, ensuring your app meets industry standards.
Key Features:
- Real-time performance monitoring on 3000+ actual devices
- Track key metrics like FPS, ANR rate, loading times, and device resource usage in real time.
- Generate detailed audit reports to highlight issues and share findings with your team.
- Identify performance bottlenecks and hotspots using session replays and metric graphs.
- Benchmark app metrics against standards to automatically detect regressions.
- Test under actual user conditions, including network types and IP geolocations.
- Concurrent performance tests for faster results
- Simulates various network conditions to test app responsiveness
- Detailed performance metrics and analytics
Verdict: BrowserStack excels at providing real-world performance insights across a wide range of devices, which is crucial for ensuring consistent app speed and responsiveness.
2. Appium
Appium is a versatile tool for automated performance testing of native and hybrid mobile applications. It stands out for its cross-platform support, allowing teams to perform performance tests across various operating systems.
Appium’s ability to integrate with CI/CD pipelines ensures continuous performance monitoring, and parallel testing features allow the simulation of multiple users, making it ideal for thorough and scalable testing scenarios.
Key Features:
- Cross-platform performance testing automation
- Supports parallel testing to simulate multiple users
- Integrates with CI/CD pipelines for continuous performance monitoring
- Custom scripts for specific performance scenarios
Verdict: Appium’s flexibility in scripting and cross-platform support makes it valuable for teams needing detailed, customizable performance tests.
3. Microsoft App Center Test
Microsoft App Center Test is a cloud-based solution that provides comprehensive performance testing on real devices. It focuses on critical aspects of app performance, such as speed and resource usage, offering a robust environment for mobile web testing.
App Center Test integrates seamlessly with other Microsoft development tools. The tool monitors app launch times, UI responsiveness, and resource consumption while offering performance comparisons across different app versions, providing deep insights into an app’s performance over time.
Key Features:
- Performance testing across various device configurations
- Monitors app launch times, UI responsiveness, and resource consumption
- Integrates performance testing with build and analytics tools
- Provides performance comparisons across app versions
Verdict: App Center Test offers comprehensive performance insights as part of Microsoft’s ecosystem, which is especially beneficial for teams using other Microsoft development tools.
4. BlazeMeter
BlazeMeter excels in simulating high-traffic scenarios to assess mobile app performance under stress. This tool is particularly suited for teams needing large-scale performance and load testing.
BlazeMeter allows the creation of large-scale user simulations and testing of app performance limits under intense conditions. It offers real-time performance analytics and provides instant feedback during tests.
Key Features:
- Creates large-scale user simulations to test app performance limits
- Real-time performance analytics during tests
- Supports various testing protocols for comprehensive performance assessment
- Cloud-based for easy scaling of performance tests
Verdict: BlazeMeter is particularly strong for teams needing large-scale performance and load testing, which is crucial for apps expecting high user volumes.
5. NeoLoad
NeoLoad is focused on simulating user behavior to test mobile app performance under various conditions. It replicates complex user journeys, providing a realistic assessment of app performance in real user conditions.
The tool delivers detailed performance metrics, including response times and throughput, and allows for testing APIs and backend services that are crucial to app functionality.
Key Features:
- Replicates complex user journeys to test performance in realistic scenarios
- Supports both HTTP and HTTPS protocols for thorough performance testing
- Provides detailed performance metrics, including response times and throughput
- Allows for testing of APIs and backend services crucial to app performance
Verdict: NeoLoad’s emphasis on realistic user simulation makes it preferred for predicting app performance in real-world usage scenarios.
6. Apache JMeter
Apache JMeter is an open-source tool well-known for its robust load testing capabilities, which can be adapted for mobile app performance testing. JMeter is highly customizable, allowing teams to simulate heavy user loads and test the app’s performance under stress.
It supports many protocols, enabling comprehensive performance assessments across the app’s different parts. JMeter provides detailed reports and graphs, making it easy to analyze performance data and identify bottlenecks.
Key Features:
- Can simulate heavy user loads to test app performance under stress
- Supports various protocols to test different aspects of app performance
- Provides detailed performance reports and graphs
- Highly customizable for specific performance testing needs
Verdict: JMeter’s flexibility and powerful load-testing capabilities make it a valuable tool for teams looking to thoroughly stress-test their mobile apps.
7. Perfecto Mobile
Perfecto Mobile specializes in testing mobile app performance under various real-world conditions. The tool simulates different network conditions and device states, such as low battery or interruptions, to assess how these factors impact app performance.
Key Features:
- Simulates different network conditions to test app performance
- Provides insights on app behavior under varying device states (e.g., low battery, interruptions)
- Offers detailed performance analytics, including load times and resource usage
- Supports continuous performance testing in CI/CD pipelines
Verdict: Perfecto allows you to test on different devices, that said it comes with a steep learning curve for new users due to its complex features and functionalities. This may require significant time and effort to master.
8. Android Profiler
Android Profiler is a built-in tool within Android Studio that offers real-time performance analysis for Android applications. It provides developers with real-time data on CPU, memory, and network performance, helping to identify bottlenecks during development.
Android Profiler’s timeline views allow developers to correlate app actions with performance metrics, providing a clear picture of how different parts of the app are performing.
Key Features:
- Provides real-time data on CPU, memory, and network performance
- Helps identify performance bottlenecks during development
- Offers timeline views to correlate app actions with performance metrics
- Integrates seamlessly with the Android development workflow
Verdict: As an integrated tool in Android Studio, Android Profiler is essential for Android developers to optimize app performance throughout the development process.
9. TestFairy
TestFairy combines performance testing with detailed analytics for both iOS and Android apps. It provides comprehensive performance metrics, including CPU, memory, and network usage, and offers video recordings of test sessions for a visual performance analysis.
TestFairy also supports the distribution of performance test builds to testers, making it easy to gather feedback.
Key Features:
- Provides comprehensive performance metrics, including CPU, memory, and network usage
- Offers video recordings of test sessions for visual performance analysis
- Supports distribution of performance test builds to testers
- Integrates crash reporting with performance data for thorough analysis
Verdict: TestFairy’s combination of performance testing and detailed analytics makes it particularly useful for teams seeking to understand and optimize their app’s real-world performance.
10. New Relic Mobile
New Relic Mobile is a powerful tool that offers deep insights into mobile app performance with real-time monitoring and analytics. It provides detailed dashboards that track performance metrics such as crash analysis, error rates, user interaction times, and network response times.
New Relic Mobile integrates seamlessly with the broader New Relic suite, offering a full-stack performance monitoring solution.
Key Features:
- Real-time monitoring of app performance metrics, including crash analysis and error rates.
- Provides insights into user interaction times, network response times, and data throughput.
- Offers detailed dashboards and alerts to quickly identify and resolve performance issues.
- Seamlessly integrates with New Relic’s broader suite for full-stack performance monitoring.
Verdict: New Relic Mobile is good at providing a comprehensive view of your mobile app’s performance, which is essential for maintaining high user experience standards.
11. Firebase Performance Monitoring
Firebase Performance Monitoring by Google is a lightweight yet robust tool for tracking the performance of mobile apps across various scenarios. It monitors key metrics such as app startup time, HTTP requests, and screen rendering time, providing real-time alerts for performance issues like slow rendering or network latency.
With custom trace creation capabilities, Firebase Performance Monitoring allows developers to optimise the specific areas of their apps that matter most.
Key Features:
- Monitors key metrics like app startup time, HTTP requests, and screen rendering time.
- Provides real-time alerts for performance issues like slow rendering or network latency.
- Easy integration with Firebase’s suite of tools for a comprehensive app development experience.
- Custom trace creation monitors specific sections of your app’s performance.
Verdict: Ideal for developers already using Firebase, this tool offers seamless performance monitoring integrated with other Firebase services, ensuring your app runs smoothly.
12. Dynatrace Mobile
Dynatrace Mobile offers AI-driven performance monitoring and optimization, focusing on enhancing the end-user experience and app responsiveness. The tool leverages AI to analyse root cause for performance bottlenecks, monitoring real user interactions and synthetic transactions to gauge app performance.
Dynatrace provides a detailed performance breakdown across different devices and operating systems, offering actionable insights.
Key Features:
- AI-powered root cause analysis for performance bottlenecks.
- Monitors real user interactions and synthetic transactions to gauge app performance.
- Provides a detailed breakdown of app performance across different devices and operating systems.
- Integrates easily with CI/CD pipelines for continuous performance monitoring.
Verdict: Dynatrace Mobile is particularly suited for teams that need advanced, AI-driven insights to proactively manage and optimize mobile app performance.
13. AWS Device Farm
AWS Device Farm is a cloud-based service that allows teams to test mobile and web applications on a wide range of real devices, offering extensive performance testing capabilities. The tool provides access to numerous physical devices, enabling thorough testing across different environments.
AWS Device Farm monitors key performance metrics like CPU, memory usage, and response times, supporting automated and manual performance testing scenarios.
Key Features:
- Provides access to several physical devices for thorough performance testing.
- Monitors performance metrics like CPU, memory usage, and response times.
- Supports both automated and manual performance testing scenarios.
- Seamless integration with other AWS services for comprehensive cloud-based testing and monitoring.
Verdict: AWS Device Farm is a robust option for teams looking to leverage Amazon’s cloud infrastructure for extensive mobile app performance testing across various real devices.
14. Apptim
Apptim is a performance testing tool specifically designed for mobile apps. It provides developers and testers with insights during the development and pre-release stages. The tool monitors critical performance metrics such as CPU, memory, and battery usage, offering real-time insights into how the app performs across different devices.
Apptim generates detailed reports that highlight performance issues and provide actionable recommendations.
Key Features:
- Monitors key performance metrics such as CPU, memory, and battery usage during testing.
- Provides real-time insights into app performance across different devices.
- Generates detailed reports highlighting performance issues, with actionable recommendations.
- Integrates easily with popular development tools for streamlined testing workflows.
Verdict: Apptim’s focus on mobile-specific performance metrics makes it a strong choice for teams looking to optimize app performance early in development.
15. Charles Proxy
Charles Proxy is a network debugging tool that facilitates mobile application performance testing by simulating different network conditions. It captures and analyzes HTTP and HTTPS traffic between the app and the server, providing insights into how network latency and bandwidth impact app performance.
Key Features:
- Simulates various network speeds and conditions to test app performance under different scenarios.
- Captures and analyzes HTTP and HTTPS traffic between the app and the server.
- Provides insights into how network latency and bandwidth affect app performance.
- Allows for the testing of both live apps and apps in development.
Verdict: Charles Proxy is ideal for teams focusing on how network conditions impact mobile app performance. It offers detailed insights into data flow and network behavior.
What are the Key Performance Indicators of Mobile App Performance Testing?
Below are some Key Performance Indicators (KPIs) that help analyze a mobile application’s performance.
- Response Time: Response time or latency refers to the delay between a user’s action within the app and the application’s response to that action. Applications with low latency enhance user experience, while apps with higher latency degrade and lead to frustration.
- Throughput: Throughput measures the number of operations or transactions a system can handle in a given time. High throughput is essential for apps that deal with many data transactions or users.
- Load Speed: Load speed is the time it takes for an app to launch and become functional after a user has started it. Faster load speed contributes to better and more positive user experiences and, hence, impacts user retention.
Read More: Tips to increase site speed
- Screen Rendering: Screen rendering is the time the application takes to display content on the screen accurately after the user’s interaction. Smooth and quick rendering are essential for providing a seamless user interface.
- App Crashes: App crashes usually occur when the application stops functioning unexpectedly. Frequent app crashes severely impact user’s satisfaction and experience.
- Device Performance: Device performance measures how well the app functions across different devices with different specifications. One can achieve this by testing the mobile app on different devices, browsers, platforms, and versions.
Doing this manually can be tedious, time-consuming, and, thus, very expensive. Also, maintaining a large variety of devices is difficult and time-consuming. Opting for a subscription to a real device cloud like BrowserStack gives developers and testers access to real browsers, operating systems, and mobile devices for testing websites and mobile apps without the cost associated with the physical infrastructure.BrowserStack’s real device cloud offers QA teams an optimal testing environment for thorough mobile web testing.With tools like BrowserStack Automate, you can tap into over 3,500+ real device-browser combinations to conduct extensive testing. Additionally, BrowserStack’s Cloud Selenium Grid supports parallel test execution, enabling faster and more efficient automated testing. - Error Rate: The error rate is the frequency of bugs or errors that users encounter while interacting with the mobile application. A low error rate indicates that the app is stable and reliable.
Read More: Challenges in mobile app testing
- Time to first byte (TTFB): TTFB is an indicator of the server or backend infrastructure’s responsiveness. It measures the elapsed time from initiating a request to receiving the first byte of the response.
- Battery usage: It’s important to analyze how much battery an app uses during operation. Apps that drain the battery quickly lead to user dissatisfaction and unhappy customers.
- API latency: It measures the delay between a user’s action and the server’s response. Optimizing API latency is crucial to maintaining a responsive and smooth user experience.
- Frames per Second (fps): It measures how many still frames, or images, are displayed in a single second of animation or video. The higher the number of frames, the smoother the movement appears to the end user.
Generally, a frame rate of 30 fps or higher is considered smooth, while below 30 fps appears jerky. - Application Not Responding(ANR): An “Application Not Responding” (ANR) error occurs when the UI thread of an Android application is blocked for too long.
How to Test Mobile App Performance Using BrowserStack?
Manual App Performance Testing on App Live
App performance directly impacts the end-user experience and adoption of the app. App Live integrates with the App Performance Testing tool that helps you identify performance issues in your app early in the app development cycle.
App Performance Testing analyzes app performance against industry-standard metrics, such as Frames Per Second (FPS), Application Not Responding (ANR) rate, app and page loading times, device resource usage, and more. Once you have identified these issues, you can fix them and release a performant app, ensuring better user experience and adoption.
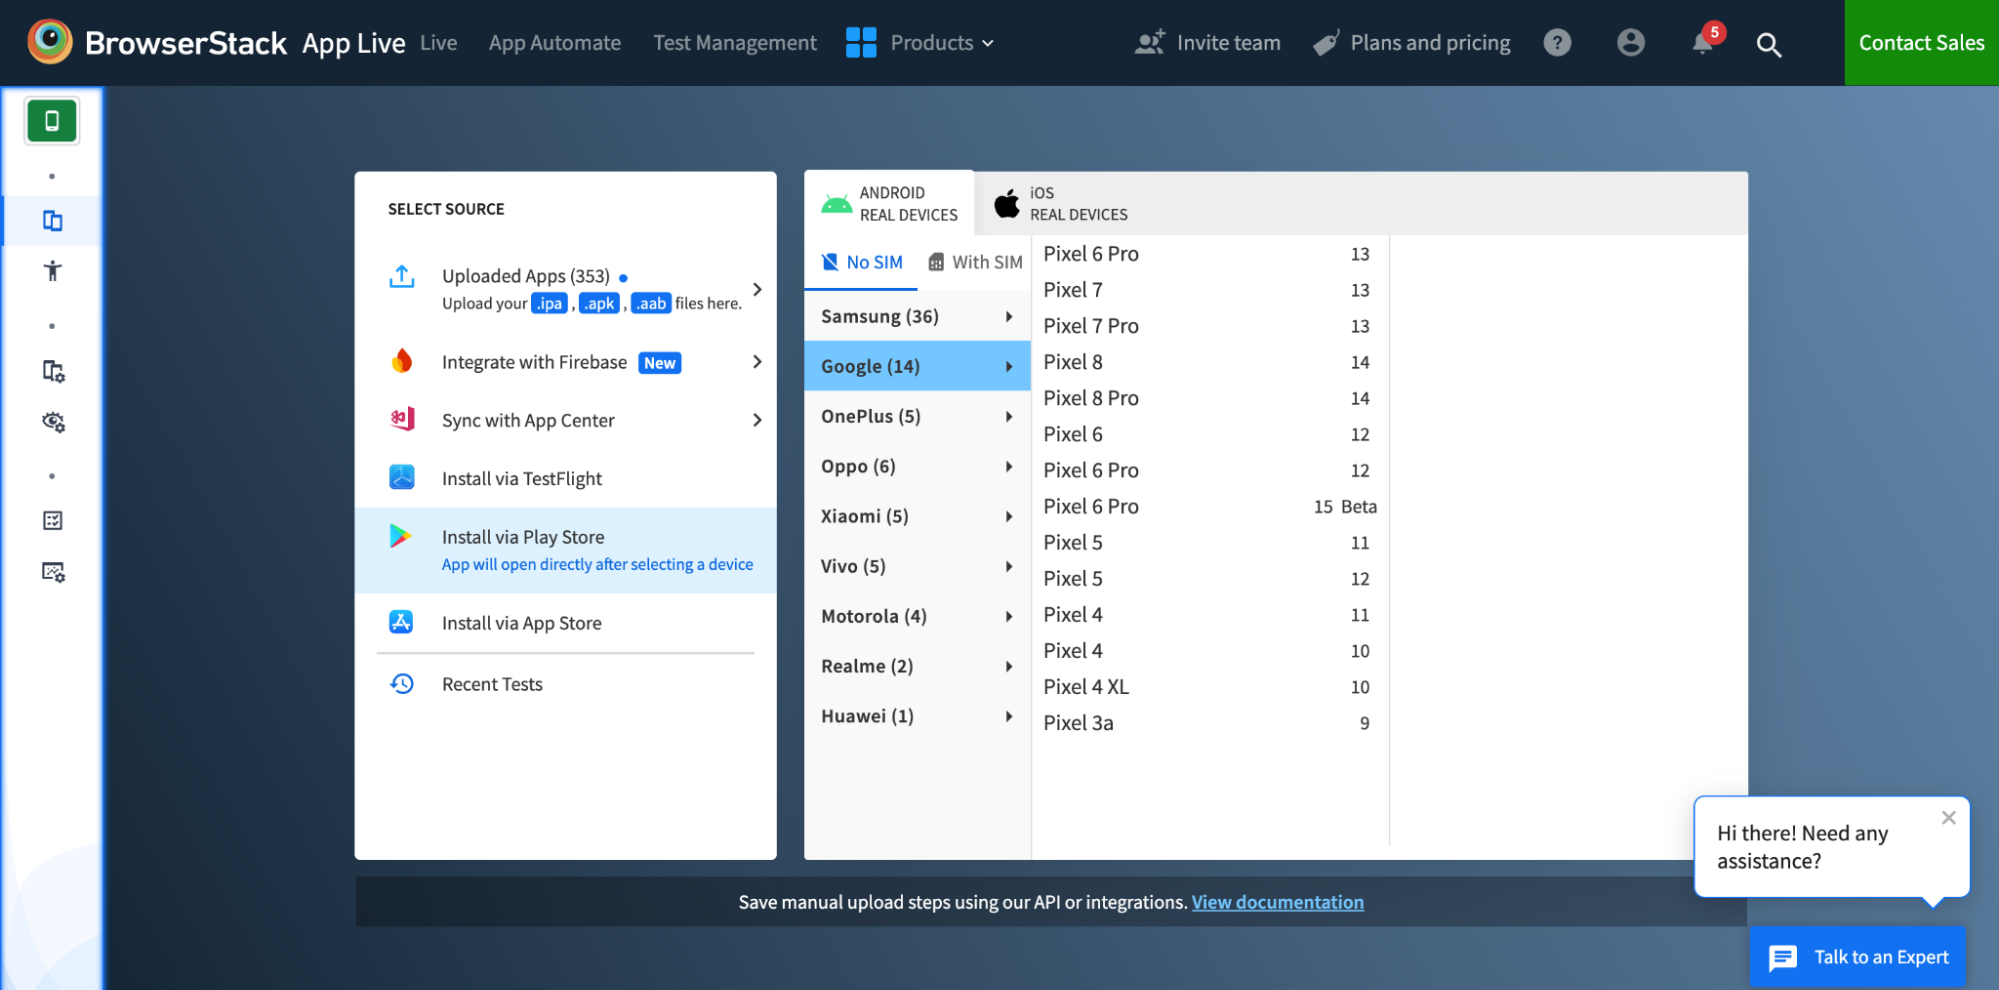
To test app performance on App Live, follow the steps at Manual Performance Testing Steps Using App Live.
Automated App Performance Testing on App Automate
Your app’s performance directly impacts its user experience and adoption. Therefore, it is critical to identify and fix performance issues before the app is released. App Automate and the App Performance Testing platform give detailed insights into your app’s performance early in the development cycle.
These tools show how your app performed against performance metrics such as app size, UI rendering performance, memory and CPU usage, and more during a test session. After identifying the performance issues, you can fix and release a performant app, ensuring better user experience and adoption.
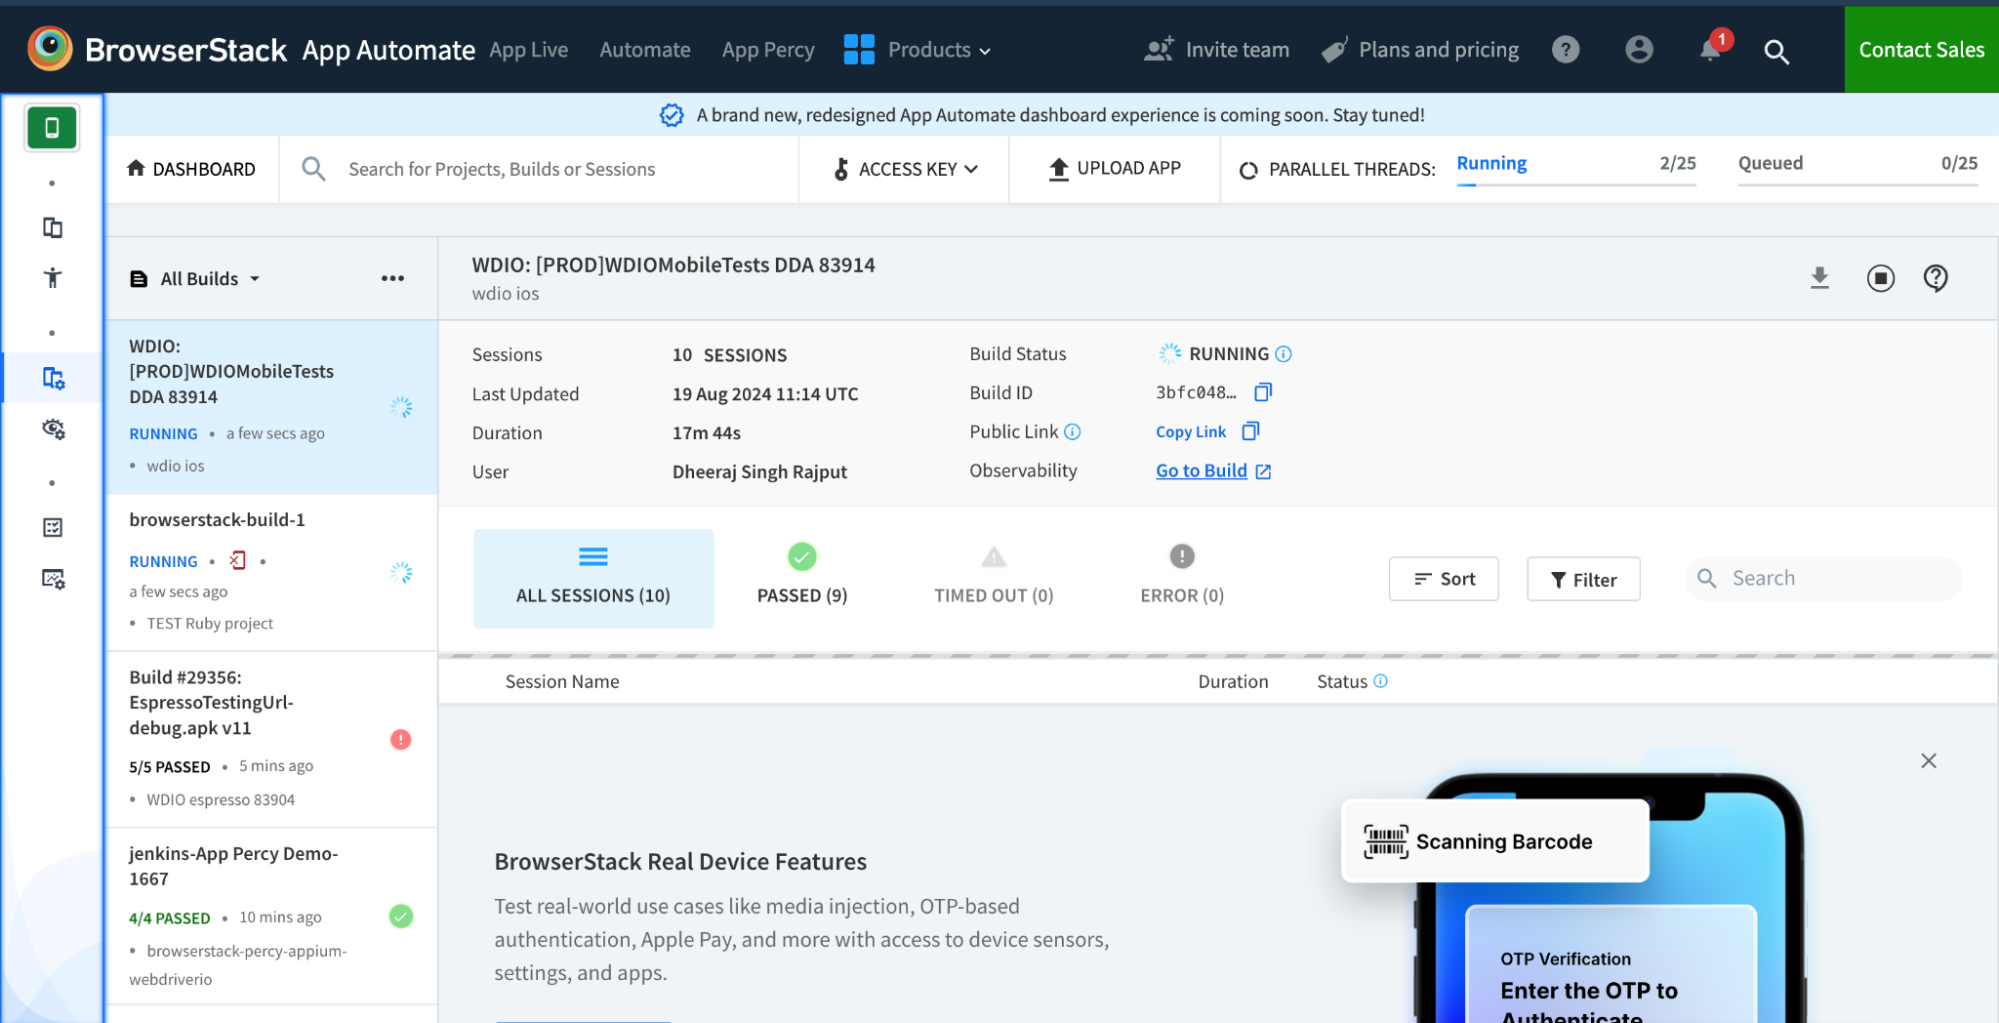
To test app performance on App Automate, follow the steps at Automated Performance Testing using AppAutomate.
Why is BrowserStack the Best Mobile App Performance Testing Tool?
The performance of your app directly impacts its user experience and adoption. Mobile users prefer applications that launch quickly, work smoothly, and use device resources efficiently. Therefore, it is critical to identify and fix performance issues before the app is released to ensure enhanced user experience and adoption.
Using BrowserStack’s App Performance, you can:
- Profile your app performance: Compare your app performance against a wide range of performance metrics, such as UI rendering performance, resource utilization, and more.
- Test under real-world conditions: Simulate real-world user scenarios, such as varying network conditions and geolocations. Then, you can verify how your app performs in such scenarios.
- Get comprehensive performance reports, videos, and logs: Access and share comprehensive performance reports, videos, and logs with your team to debug and fix issues quickly.
- Identify high-impact issues: The performance report includes a separate section for detected issues that highlights high-impact issues, their cause, and guidelines to fix them.
Selecting the right mobile app performance testing tool ensures a seamless and reliable user experience. By investing in the appropriate tool, you can identify potential bottlenecks, enhance app performance, and ultimately deliver a superior product to your users. As mobile app usage grows, prioritizing performance testing in your development process will help maintain your app’s competitive edge.
Leverage BrowserStack’s App Live, App Automate, and App Performance to thoroughly assess your app’s performance across various metrics, simulate real-world conditions, and quickly address high-impact issues.


