Introduction to Java DevOps
By Mohit Joshi, Community Contributor - April 19, 2023
Software Development has become pivotal for many industries with the rise of digitization. Software Development Process requires interjunction of multiple teams such as Development, Design, Testing, and Maintenance teams that design, develop, test, and maintain the software application.
Allowing an entire software development process traditionally for an industry doesn’t comes in handy and is never quick. In this case, the complete development cycle is delayed as both teams are not working together due to a simultaneous communication barrier. By collaborating, both departments can execute tasks faster, which is called DevOps. Let’s dig in deep and understand What is java devops.
Read More: What is the ultimate goal of DevOps?
What is Java DevOps?
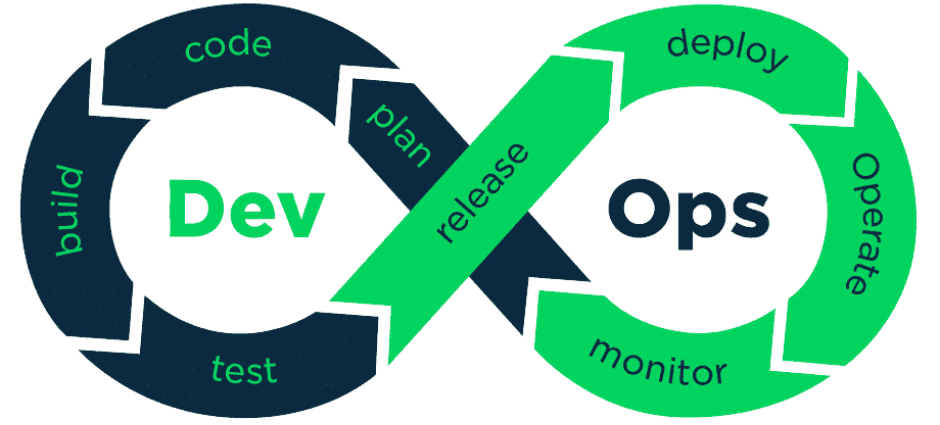
DevOps is derived from two words, development, and operations, indicating the two teams working behind the development of any software at the industry level. DevOps came into existence to solve the underlying of the handy collaboration of two teams to develop software quickly and smoothly. DevOps eliminates the barrier between the developers, testers, QAs, and administrators and offers a quick execution of code. DevOps should not be confused with technology, however, is an approach or discipline that various businesses are now adapting for developing quality applications quickly. Therefore, Java DevOps is simply referred to as the practical implementation of the DevOps approach and philosophies while creating a Java application.
Also Read: Importance of DevOps Team Structure
Benefits of Java DevOps
By embracing the DevOps discipline, the organization can adapt to rapid, smooth, and consistent development without slipping behind. Software is developed by the development team, then sent to the operations team for feedback to cover improvements. Due to the time-consuming nature of this process, DevOps enables both teams to work collaboratively together for faster software delivery. As a result of its ability to simplify communication between teams and adapts quickly to changes, it is widely adopted across the globe.
Read More: Top 10 Core Benefits of DevOps
Principles of Java DevOps
The idea behind implementing Java DevOps is to obtain automation in Java development including faster feedback from the operation team resulting in quicker execution. The foundation of DevOps is built upon the bonding between the development and operations teams.
Here are a few underlying principles of Java DevOps:
- Consistent collaborative nature: Your team must understand the requirements of all the members and work cohesively to meet their needs. There should be constant communication between the members to reduce the lagging nature of the project.
- Early issues resolving: Both teams should work together to address any issue as soon as possible, also the development team must try to resolve the issue early.
- Teams reduced to one: As DevOps becomes more prevalent in the industry, each member’s work is specified properly, ensuring everyone works under one team.
- Entirely automated: Most tasks including development, testing, configuration and more should be automated as much as possible. Using this method, repetitive work can be eliminated, allowing us to focus on important tasks that cannot be automated.
- Slow and steady updates: By doing so, we can roll out the product to customers and continue to make any changes that are required to the product as well.
DevOps Tools for Java Development
Although DevOps is an approach rather than a technology, certain tools make the DevOps approach more efficient. Effective communication and collaboration between the operation and development teams are at the core of the DevOps approach, so certain tools help ensure this remains the case.
Here is a list of tools that will help you to follow the DevOps approach in software development.
1. Source code management with Git
How do you imagine an effective collaboration over a source code of your application? Spoiler alert, Git is the answer. Git is to date the most used version control tool in the development industry. It allows developers to keep the track of code, updates, and every change performed in the code. This is a useful feature in case you want to return to the previous version of the code.
2. Continuous Integration with Jenkins
Jenkins is a Java-based open-source automation tool designed for continuous integrations in Java programs. Jenkins is adopted across the globe allowing developers to quickly commit to new changes in the project and obtain a fresh build project. It includes processes of all kinds including build, document, test, package, and more.
3. Automated testing with JUnit
JUnit is an open-source testing framework that incorporates a faster test execution for developers across the globe. The idea behind implementing JUnit over other frameworks is that it finds the bug early in the project which is then highlighted in a different section until it is resolved. JUnit is easier to implement and offers a Test Driven Development (TDD) approach which has its unique advantages
4. Code quality analysis with SonarQube
The SonarQube tool is another tool to execute DevOps in an industrial setting. An analysis tool that gathers the source code of your project, analyzes it and produces a quality report. As the project develops, quality is continually measured, enabling quick identification of issues in the code and when to fix them. SonarQube inspects every parameter, from minor styling issues to major code defects.
5. Deployment automation with Ansible
Ansible is an open-source automation tool that is useful in automating many manual IT processes such as deployment, application provisioning, configuration management, and more. With the help of Ansible, you can deploy multi-tier applications reliably. Moreover, the best part behind implementing Ansible is, instead of writing complex code to automate certain processes you just have to write task descriptions.
Building and Deploying Java Applications with DevOps
Now let’s consider a practical example to demonstrate how to build a Java application, demonstrate certain tools and finally deploy the application with the DevOps approach.
Creating a Java project using Maven
Pre-Requisite
- You must have Java jdk installed on your system. To check if Java is installed on your system run the command
java –version
If it is installed, it will display the Java version.
- Any IDE of your choice such as Eclipse.
Read More: How to configure Selenium in Eclipse
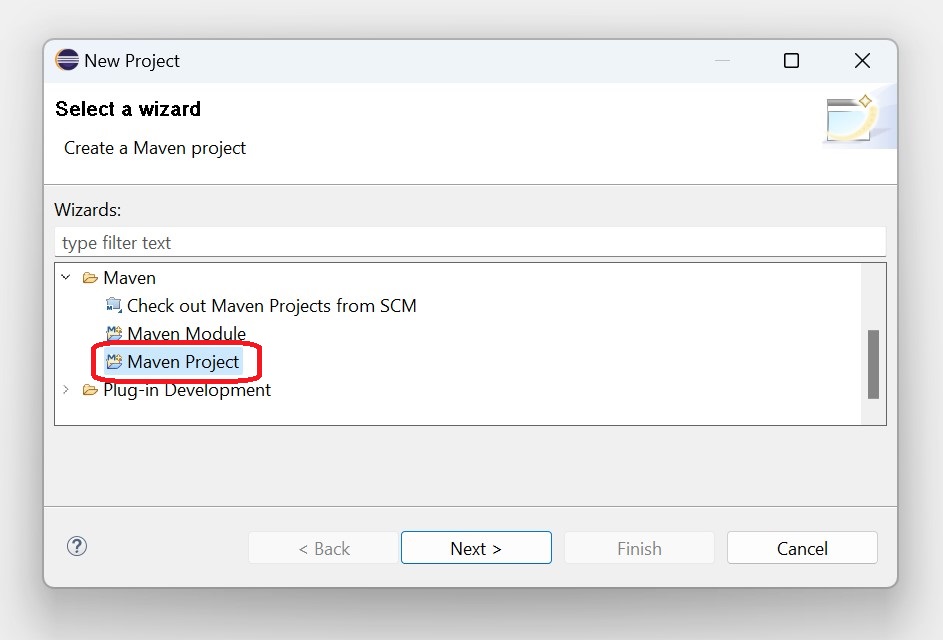
To create a Maven project, open Eclipse and then complete the following steps:
- Click on File option
- Hover on the New drop-down menu
- Click on the Project option
- Select the Maven project option
- Enter the Group id and Artifact id of your choice and proceed.
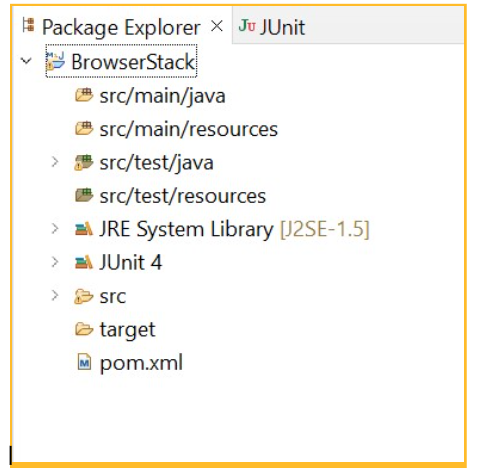
- Your Maven project is created.
Writing tests and configuring builds with Maven
Step 1: Add Maven dependencies
In this step, you have to add some dependencies that will help in achieving testing. Add JUnit dependency from the Maven marketplace by inserting the dependency in the pom.xml file that you got on our Maven project.
Add this script inside the dependencies tag in the pom.xml file.
<!-- https://mvnrepository.com/artifact/junit/junit -->
<dependency>
<groupId>junit</groupId>
<artifactId>junit</artifactId>
<version>4.13.2</version>
<scope>test</scope>
</dependency>
Step 2: Create a new class file
Now create a new class file where you will write our Junit test. To do so, follow the following steps to create a new class file.
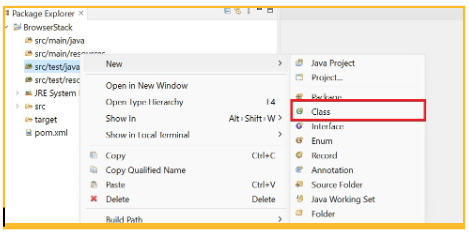
- Right-click on the folder src/test/java
- Hover over to new
- Click on the class and create a file by entering a name of your choice
Step 3: Writing the Test Script
Now the final part is to write the test after setting up the project. Open the previously created test class file inside the src/test/java folder.
import org.junit. Test;
import org.junit. Ignore;
import static org.junit.Assert.assertEquals;

public class BrowserStackJunit {
String message = "BrowserStack is the intended message";
@Test
public void testMessage() {
System.out. println("Inside testMessage()");
assertEquals(message, "BrowserStack is the intended message");
}
}
Run Java DevOps Tests on Real Devices for Free
Step 4: Executing test
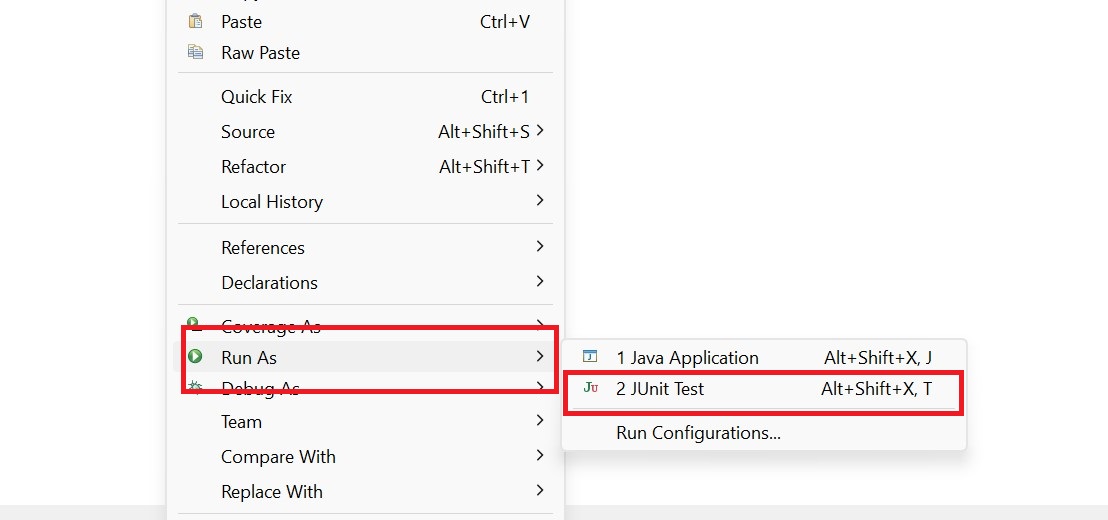
Once the test is written, right-click and then select run as JUnit test.
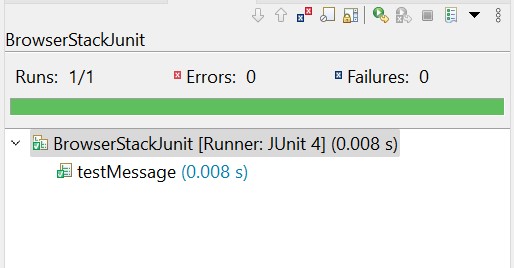
Once the test is executed, on successful completion of the test it will be indicated on the left panel highlighted with green color.
ProTip: BrowserStack Automate allows you to test you Java DevOps Application on 3000+ real browser device combinations under real user conditions for a more comprehensive and accurate testing experience.
Setting up a CI/CD pipeline with Jenkins
Pre-Requisites
- In this example, we are using Ubuntu in a Microsoft Azure Virtual Machine.
Step 1: Install Java jdk following the command.
sudo apt update
sudo apt install default-jdk
Step 2: Install Jenkins stable version with the help of the following command.
wget -q -O - https://pkg.jenkins.io/debian-stable/jenkins.io.key | sudo apt-key add -
sudo sh -c 'echo deb https://pkg.jenkins.io/debian-stable binary/ > /etc/apt/sources.list.d/jenkins.list'
sudo apt-get update
sudo apt-get install jenkins
Step 3: Login into Jenkins
Follow the URL http://youripaddress:8080/http://localhost:8080 and login to unlock Jenkins. To access the password, follow the below command.
sudo cat /var/lib/jenkins/secrets/initialAdminPassword
Step 4: Install plugins
After successfully logging in, install plugins for Jenkins which is an automatic process and will take a couple of minutes.
Step 5: Create continuous integration
To create continuous integration on Jenkins, click on create a new item on the Jenkins dashboard. In the Source Code Management tab, enter the GitHub repo URL you want to clone and then select Build now option. From the build tab also select, “Invoke top-level Maven targets”. Select your Maven name and then again click on Build now option. After doing this, go back to configure, and open the Post-build actions tab. In the field write down, **/*.war to fetch the war file from every folder where it is present and again click on Build now option.
Step 6: Create continuous deployment
Download and install Apache Tomcat. Hover over “tar.gz” link and copy it from the core section. After that follow these four commands in your server.
sudo groupadd tomcat
sudo useradd -s /bin/false -g tomcat -d /opt/tomcat tomcat
cd
cd /tmp
curl -O https://dlcdn.apache.org/tomcat/tomcat-9/v9.0.54/bin/apache-tomcat-9.0.54.tar.gz
sudo mkdir /opt/tomcat
sudo tar xzvf apache-tomcat-9.0.54.tar.gz -C /opt/tomcat --strip-components=1

cd /opt/tomcat
sudo chgrp -R tomcat /opt/tomcat
sudo chmod -R g+r conf
sudo chmod g+x conf
cd ..
sudo chown -R jenkinsuser:jenkinsuser tomcat/
In the server.xml file, change the port from 8080 to 8090 because we are already using the 8080 port for Jenkins. Follow the command to access the server.xml file.
cd
cd /opt/tomcat/conf
vi server.xml
Now access the tomcat-users.xml file with the following command.
cd
cd /opt/tomcat/conf
vi tomcat-users.xml
Add the following script inside the file to update the roles to allow Tomcat to deploy files.
<role rolename="manager-gui"/>
<role rolename="manager-script"/>
<role rolename="manager-jmx"/>
<role rolename="manager-status"/>
<user username="admin" password="admin" roles="manager-gui, manager-script, manager-jmx, manager-status"/>
<user username="deployer" password="deployer" roles="manager-script"/>
<user username="tomcat" password="s3cret" roles="manager-gui"/>
Access the context.xml file with the below command and remove the entire content inside the context tag to remove IP restrictions.
cd
cd /opt/tomcat/webapps/manager/META-INF
vi context.xml
Now we have edited all the necessary files to meet the Tomcat requirements. Let’s restart our Tomcat with the below command.
cd
cd /opt/tomcat/bin/
./shutdown.sh
./startup.sh
Step 7: Install the necessary plugins
Now, install the ‘Deploy to container’ plugin.
Again, go back to configure section, navigate to Post-build Actions, and select ‘Deploy wear/ear to a container’. Fill in the same entry as before for the war file, “**/*.war”.
Final Step: Add a new container for Tomcat 9.x and enter the URL as “youripaddress:8090” and then enter the Jenkins credentials. Finally, to see the deployment of your page, visit the URL “youripaddress:8090”.
Deploying Java applications to cloud platforms like AWS or Azure
Amazon Web Services (AWS) and Azure by Microsoft are services to deploy any type of application in the cloud. In this example, we are going to understand how to deploy a Java application in Microsoft Azure. The process is similar in case you want to deploy on Amazon AWS.
Step 1: Sign up for Microsoft Azure
Step 2: Navigate to the dashboard. 
Step 4: Enter all the basic details and move on to the cloud shell. In this example, using Java 8 and Java web server stack as Jboss. 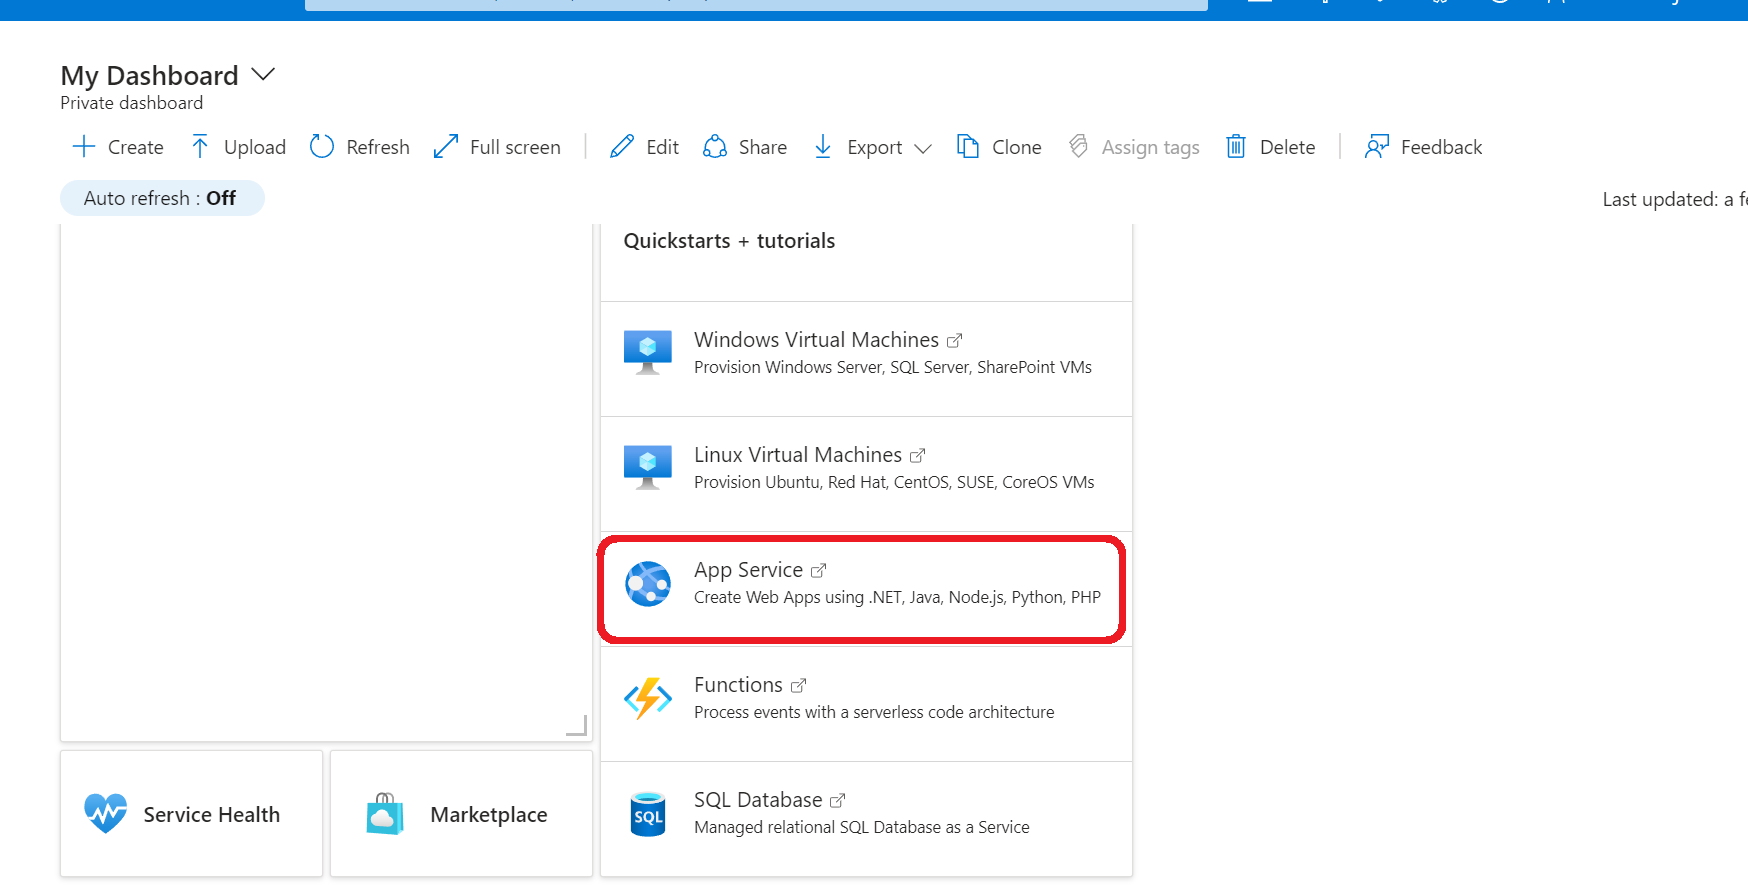
git clone URLStep 6: Install the maven plugin Azure web services inside the project directory with the following command.
mvn com.microsoft.azure:azure-webapp-maven-plugin:2.5.0:config
Step 7: Build the application and deploy it to the web app with the following command.
mvn package azure-webapp:deploy
The terminal will prompt you with the link to your application deployed with the help of Microsoft Azure.
ProTip: BrowserStack Automate allows Integration with all the major CI/CD tools such as AWS, Microsoft Azure, Jenkins, GitLab, CircleCI, Travis CI, Bamboo, etc., where you can test you Java Application on 3000+ real browser device combinations for a more comprehensive and accurate testing experience.
Monitoring and Logging for Java DevOps
The purpose of monitoring is to identify issues early if they arise by measuring the performance of applications or infrastructure. A good practice is to make sure every component is performing at its best so that maximum efficiency can be achieved.
Logging refers to keeping track of past versions of a system or application. It is useful in creating data-driven decisions to improve the efficiency of the system.
Also Read: What is Continuous Monitoring in DevOps?
- Implementing monitoring with Prometheus and Grafana
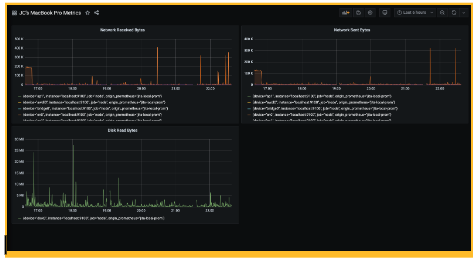
After you have deployed your application it is time to set up monitoring for your microservice to know what is happening on your application. By the end of the section, you would have created metrics graphs like this for your application.
The only prerequisite here is that you must have Docker installed on your system. You can do it on a virtual machine.
Step 1: Install Graffana on your system.
Step 2: Download Prometheus and node_exporter
Step 3: Install Prometheus
To install Prometheus, after downloading it, extract it and navigate it to the directory
tar xvfz prometheus-*.tar.gz
cd prometheus-*
After installing, locate the .yml file in the directory. Replace the following script.
# A scrape configuration containing exactly one endpoint to scrape from node_exporter running on a host:
scrape_configs:
# The job name is added as a label `job=<job_name>` to any timeseries scraped from this config.
- job_name: 'node'

# metrics_path defaults to '/metrics'
# scheme defaults to 'http'.

static_configs:
- targets: ['localhost:9100']
This will target the node_explorer in the localhost:9100.
Step 4: Start the Prometheus service by the command.
./prometheus --config.file=./prometheus.yml
Step 5: Configure Prometheus for Graffana
remote_write:
- url: <https://your-remote-write-endpoint>
basic_auth:
username: <your user name>
password: <Your Grafana.com API Key>
After signing up on Graffana, edit the Prometheus.yml file configurations since you are running on your system locally.
Now you’re all set to start building dashboards to render system metrics monitored by Prometheus.
- Using ELK Stack for logging and analysis
ELK Stack is a combination of three open-source tools, Elasticsearch, Logstash, and Kibana. ELK stack is well known to provide the optimum solution to all the logging and analysis in DevOps. Let’s implement the ELK stack for logging and analysis.
Step 1: Download ElasticSearch, Kibana, and Logstash.
Step 2: Unzip all three files and three folders for each tool will be obtained.
Step 3: Launch the ElasticSearch, by double-clicking on the elasticsearch.bat file in the ElasticSearch/bin folder. To check if the ElasticSearch search server is started, go to localhost:9200.
Step 4: Launch the Kibana Server, by double-clicking on the kibana.bat file in the Kibana/bin folder. To check if the Kibana server is started, go to localhost:5601.
Step 5: Install the Logstash by opening the command prompt in the Logstash directory and following the command to start the pipeline.
1 binlogstash -e ‘input { stdin { } } output { stdout {} }’
Security in Java DevOps
DevOps security is the procedure of protecting the entire DevOps environment through different strategies and practices. Throughout the DevOps lifecycle, several processes take place, including design, testing, build, maintenance, and more, all of which require security. A secure DevOps approach prevents the system from threats, infrastructure problems, code issues, and vulnerabilities. Moreover, security is such an important aspect of DevOps that it has got its unique name, DevSecOps. Let’s discuss some practices to achieve a secure DevOps approach.
- Securing the development process with secure coding practices
It is a good practice while reviewing the code, you must avoid reviewing the entire script in one sitting. It is ideal to take multiple views over the code for critical examination and identifying even the smallest of errors. Moreover, developers tend to underestimate the security aspect while developing, this often leads to a huge threat to the code. Ideally, your development team must also be aware of certain tools for secure development. Some of the tools such as Kafkinos, Metasploit, Sifter, and more intent to secure the development process.
- Securing the deployment process with secure configurations and access controls
The development of the application has been secured, so now it is time to take security to a higher level by deploying our applications securely.
Our application deployment challenges include the physical safeguards and the security of the network, data, and infrastructure. Advanced practices to safeguard your deployment include adhering to strict permissions to stakeholders, that is to provide only limited permission which is necessary to different users. Moreover, other practices include preventing physical access to servers, and more.
Scaling and Optimization in Java DevOps
Scalability is the ability of the application to grow the systems while setting up for high demand and decreases when you want to scale back due to low demand. However, the key skill here is to overcome the challenges faced during scaling applications. Some of the challenges faced in the industry include the organization’s culture not being aligned with the DevOps approach, not having a fully automated pipeline, the cost of implementing DevOps, and more.
- Load testing and performance monitoring
Load testing and performance monitoring are the few measures taken to ensure the maximum performance of your application. Performance monitoring is a software testing technique that evaluates the reliability, stability, response time, and scalability issues in an application. Performance testing is carried out for multiple reasons such as comparison between systems, measuring stability at peak performance, and ensuring an application is delivering quality implementation.
On the other hand, Load testing ensures how the application is behaving on custom loads. Once you are aware of the load your application is going to face, you are all set to implement load testing on your microservices.
- Scaling strategies and best practices
Our understanding of the challenges involved in scaling Java applications, along with some techniques to monitor performance, has led us to discover best practices for smooth and consistent scaling in Java DevOps. To begin with, automate as much as you can from operations to developments. Automation single-handedly is determining factor for the scalability of your applications. Moreover, you must accept customer feedback and roll out the necessary updates keeping them in mind.
