Many testers assume that testing a website on iPhone Safari is as simple as opening the site, scrolling through a few screens, and calling it done.
In reality, this is where some of the most frustrating, device-specific bugs hide.
I once had a layout that looked perfect on Chrome suddenly break on my iPhone—a key button slid halfway off the screen for no obvious reason. It was visible, but completely unusable.
Refreshing, clearing cache, reloading—nothing helped. I spent nearly an hour just trying to figure out what was happening behind the scenes.
That’s when it hit me: the real challenge wasn’t the bug—it was that I wasn’t debugging iPhone Safari the right way.
Overview
Debugging websites on iPhone Safari requires the right setup—one that lets you inspect elements, capture logs, and accurately identify issues that only appear on real iPhones.
Method 1: Use Web Inspector with Safari on Mac
- Enable Web Inspector on your iPhone (Settings → Safari → Advanced).
- Connect your iPhone to your Mac via USB.
- Open Safari on Mac → Develop menu → select your iPhone.
- Inspect elements, view CSS/HTML, track network calls, and debug console errors in real time.
Method 2: Use Safari Console
- Open Settings → Safari → Advanced and enable Web Inspector.
- Use the Console tab in Web Inspector to monitor logs, script errors, and warnings.
- Useful for debugging JavaScript issues, network errors, and tracking events during interactions.
Method 3: Use BrowserStack’s Real Device Cloud
- Sign up for BrowserStack Live (free trial available) and navigate to the Live Dashboard.
- Select iOS → iPhone and then choose Safari; wait for the device to boot.
- Inspect specific elements to access HTML, identify broken images, and debug in real time.
- Provides real-device Safari DevTools, console logs, network inspection, performance insights, and options to capture screenshots and recordings.
In this article, I’ve explained three effective methods to debug websites on iPhones and iPads—using Web Inspector, using the Safari Console, and using BrowserStack’s Real Device Cloud.
Why is it Important to Debug on iPhone?
With a market share of 14.35% as of November 2025, Safari represents a major portion of global web traffic. Debugging directly on iPhone Safari isn’t just a nice-to-have—it’s essential to ensure your website works flawlessly for a large segment of users.

Here’s why debugging on iPhone matters:
- Identify how your web app performs with real gestures, hardware differences, and touch interactions.
- Monitor performance across varied network conditions, including fluctuating cellular speeds and weak signal scenarios.
- Fix rendering issues, layout shifts, and Safari-specific quirks that show up only on certain iPhone models or iOS versions.
- Validate media queries, viewport settings, and touch responsiveness tailored for mobile Safari.
Beyond traffic share, debugging on an actual iPhone helps you uncover issues that don’t appear in desktop browsers, emulators, or simulators.
Platforms like BrowserStack give you access to real iOS devices, allowing you to reproduce Safari-specific bugs, validate touch interactions, test network conditions, and verify rendering differences that only occur on physical hardware.
This ensures that layout shifts, broken images, performance bottlenecks, and JavaScript inconsistencies are caught early and fixed accurately—long before they reach real users.
Not sure where to start? Experts at BrowserStack can guide you through efficient debugging techniques on real iPhones and help streamline your testing process across multiple devices.
Get Expert QA Guidance Today
Schedule a call with BrowserStack QA specialists to discuss your testing challenges, automation strategies, and tool integrations. Gain actionable insights tailored to your projects and ensure faster, more reliable software delivery.
How to Debug Websites on iPhone Safari?
Debugging websites on iPhone Safari allows you to analyze elements, monitor network activity, and troubleshoot issues directly on iOS devices.
There are three different methods to debug websites on iPhone Safari
- Method 1: Debug using the Web Inspector feature on iPhones or iPads
- Method 2: Debug errors on iPad or iPhone using the Safari Console Menu
- Method 3: Debug iPhones or iPads using BrowserStack’s Real Device Cloud
Below is a detailed explanation of each method and the steps to implement.
Method 1: Debug using the Web Inspector feature on iPhones or iPads
Debugging issues for mobile web pages can be difficult at times. However, starting from iOS 6, Apple provides a Web Inspector, which makes debugging web pages much easier on iPhones or iPads. Follow the steps below to use it:
Step 1. Connect the iOS device to the machine.
Step 2. Enable the Web-Inspector option. To do so:
- Go to Settings > Safari > Scroll down to the bottom > Open Advanced Menu>
- Turn on Web Inspector
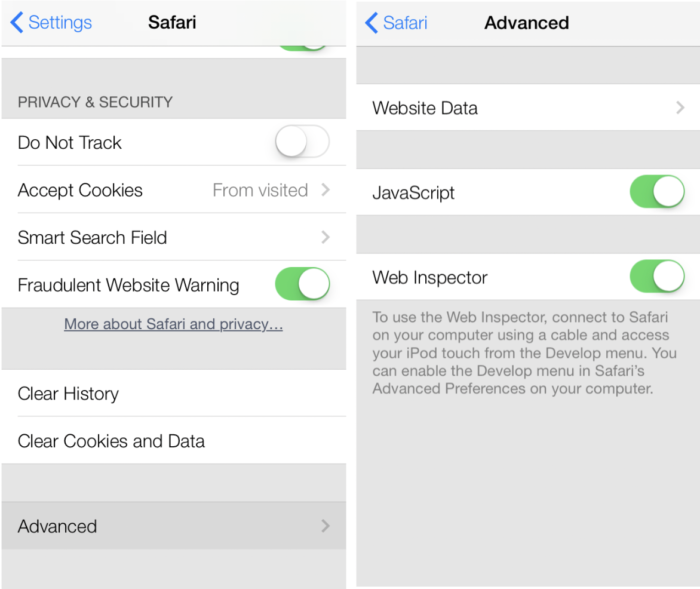
Step 3. Open the desired web page to debug or preview on your mobile Safari browser. Once done, enable the Develop menu on the Mac device.
To enable the Develop menu, follow the steps below:
Step 1. Launch Safari browser
Step 2. Click on Safari at the top > Open Preferences > Advanced
Step 3. Mark the checkbox – Show Develop menu in the menu bar to enable it
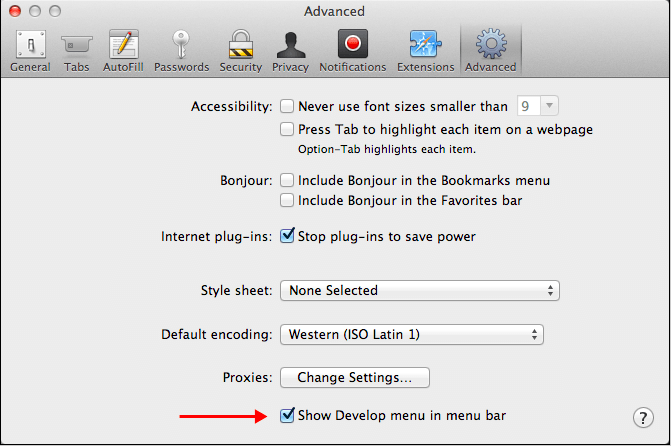
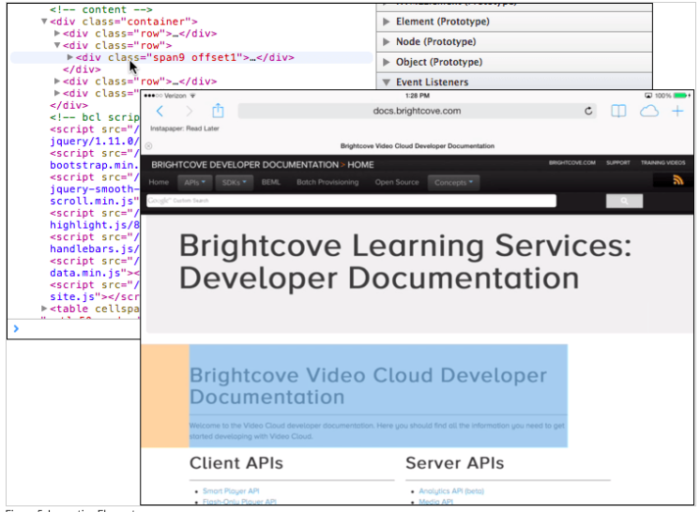
Step 4. Now, you’ll be able to view the Develop menu in the top bar. Click on it and it will show the connected iPhone or iPad along with the URL that is active on Safari.

Step 5. By Clicking on that URL, a new inspector window will open that allows the developer to inspect, preview, or debug the page on a mobile browser from their Mac. Just click on the Resources section, and then all interactions with the web elements will be highlighted in real-time on that iPhone.
Method 2: Debug errors on iPad or iPhone using the Safari Console Menu
The Safari Console in Web Inspector lets you monitor JavaScript logs and inspect the DOM and JavaScript in real-time. Here’s how to use it:
Step 1. Select “Console” from the iPhone Safari Web Inspector Menu
![]()
Step 2. Console is a Command Line API that allows you to debug Safari on iPhone using Developer Tools. The Console allows access to the DOM and JavaScript of the open page, allowing you to inspect HTML nodes and JavaScript objects in more detail by using the console commands.

Read More: How to Debug on iPhone Safari for Windows
Method 3: Debug iPhones or iPads using BrowserStack’s Real Device Cloud
BrowserStack is a real device cloud testing platform that gives you access to 3,500+ iOS devices and browser combinations. You can choose both the latest and legacy iPhone devices and OS versions. Here are a few more reasons to use BrowserStack to debug websites on iPhone Safari.
- Real device features: Test complex workflows, such as OTP authentication, payment, location, and more.
- Multi-device testing: Test your website on up to four real devices simultaneously to accelerate the testing process.
- Natural gestures and interactions: Check if your website works with natural gestures, such as tap, scroll, zoom, and swipe.
- Test local and internal websites: Test even if your website is hosted on localhost, staging, and internal networks.
- Network testing: Test your website’s performance in different network conditions, like 2G, 3G, 4G, 5G, and offline mode.
- Browser-specific features: You can adjust device time, timezone, and Safari settings, such as pop-ups and tracking, to simulate real scenarios.
Read More: How to Change Time Zone on iPhone?
This example opens the bstackdemo.com website, accesses the developer tools to inspect elements, and temporarily changes the pricing of the iPhone 12 Mini. The Chrome DevTools is currently only available on Android 7 and above.
Get started by following three simple steps listed below:
Step 1. Sign up on BrowserStack Live for a free trial or purchase a plan.
Step 2. Navigate to the Live Dashboard after successful sign-up.
Step 3. Click iOS > iPhone, and then select Safari.
Wait for the device to be booted.
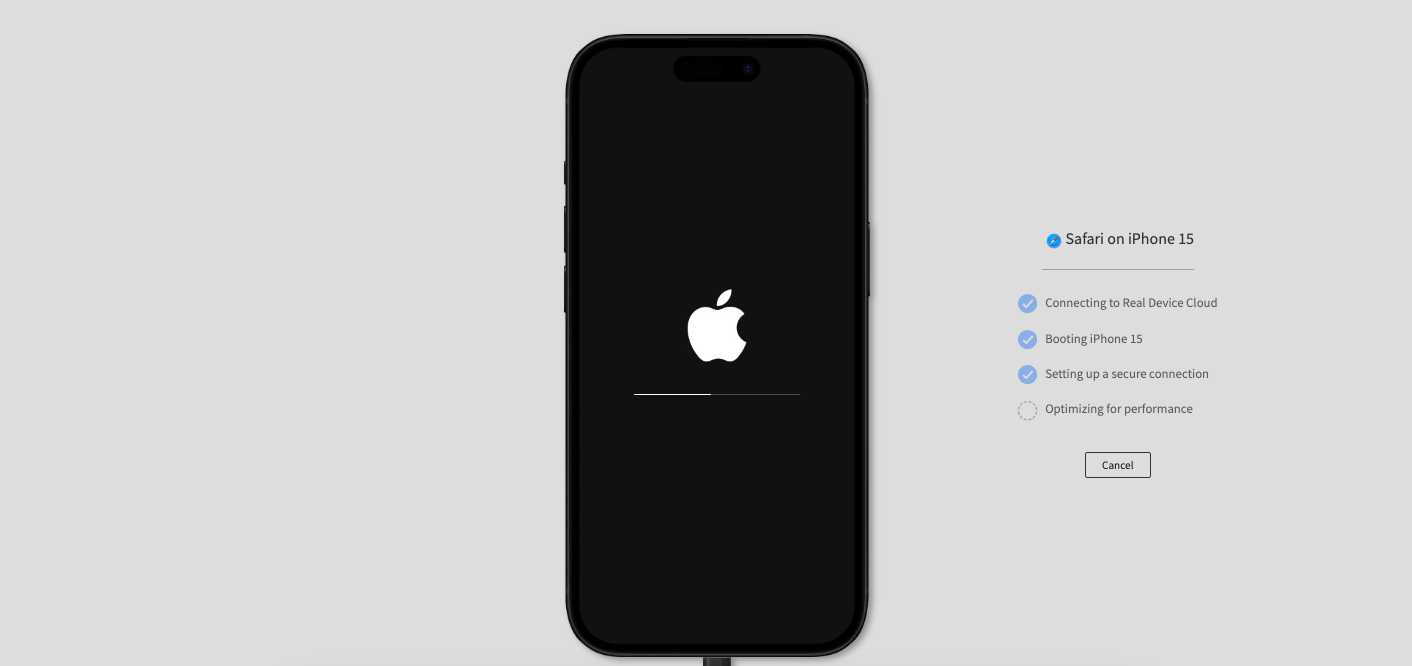
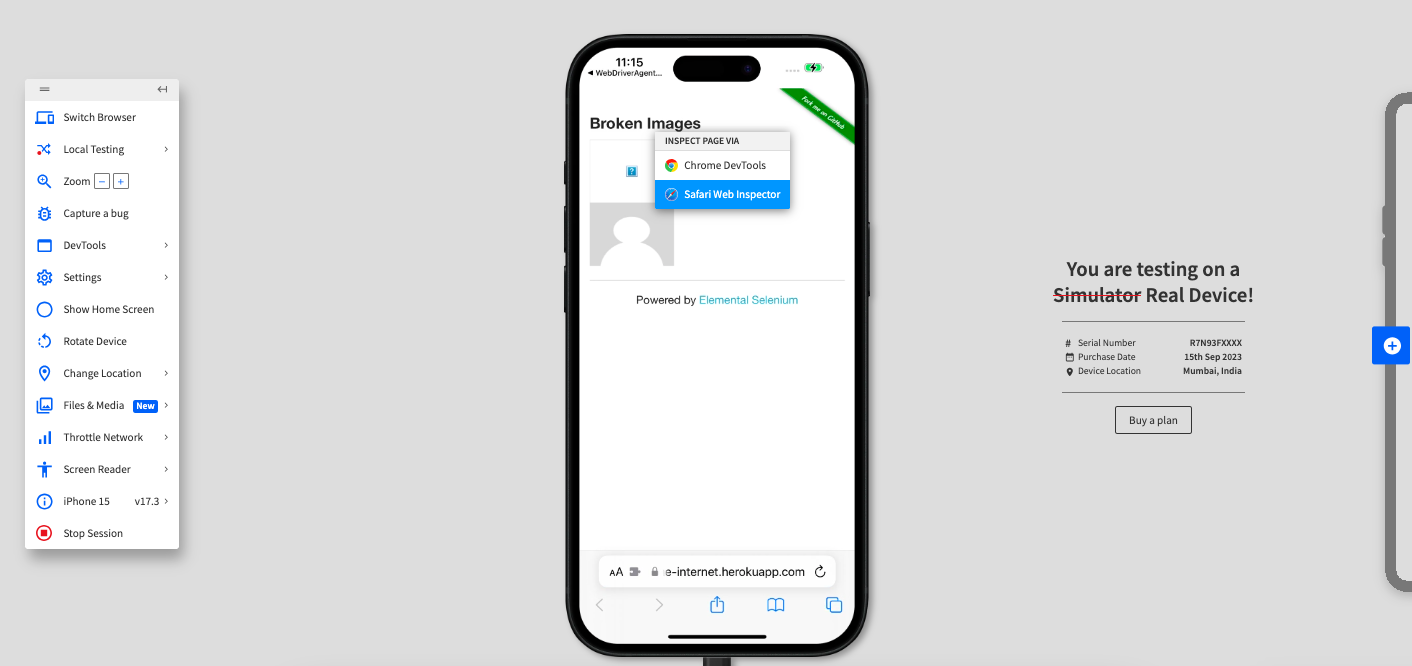
Step 4. In the browser on the device, enter https://the-internet.herokuapp.com/broken_images.
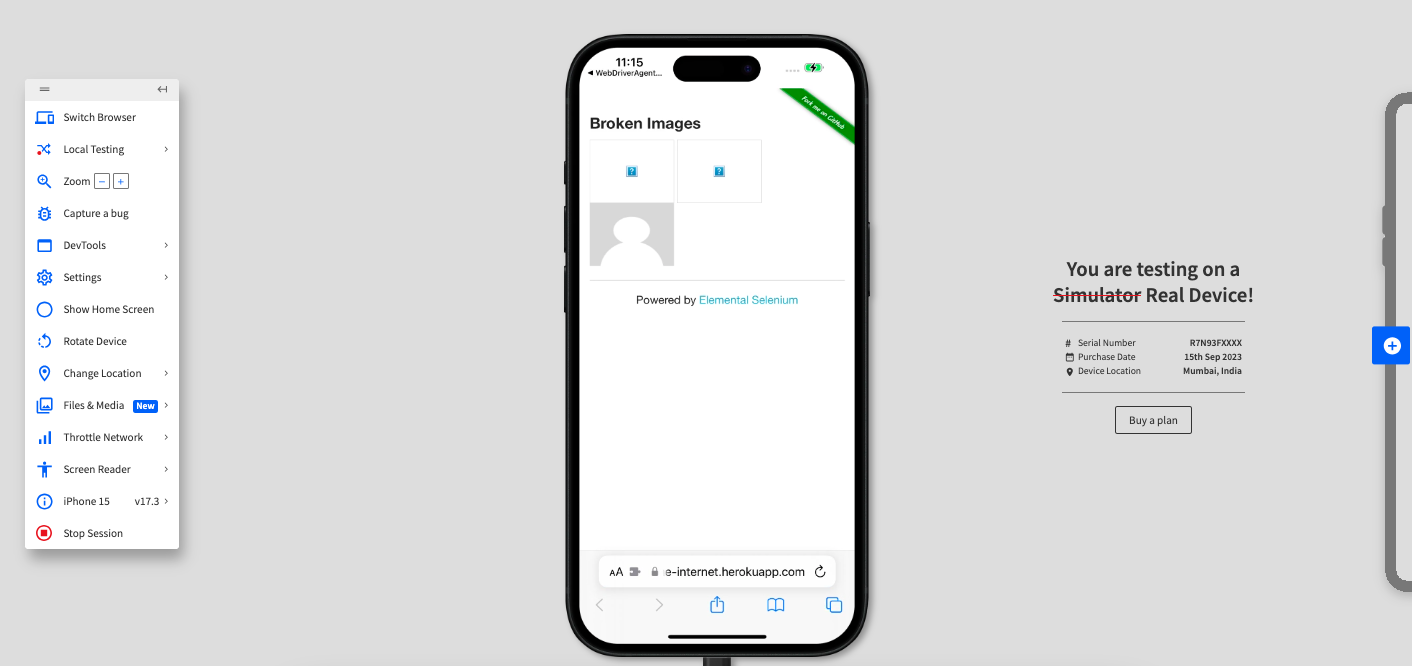
Step 5. Inspect specific elements to access the HTML code and debug in real time.
- Right-click the broken image, and then select Safari Web Inspector.
- Replace the file name with img/avatar-blank.jpg.
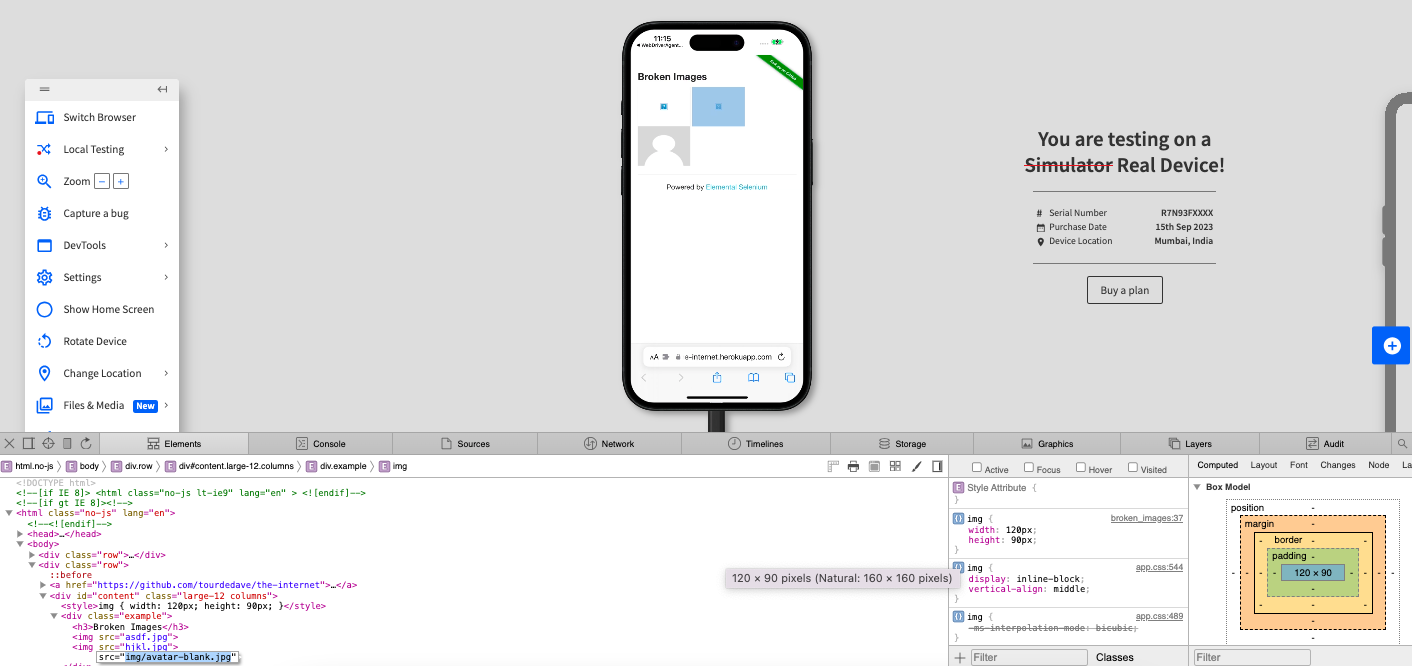
- Click anywhere on the Live dashboard to apply the changes.
You can see the following change applied.
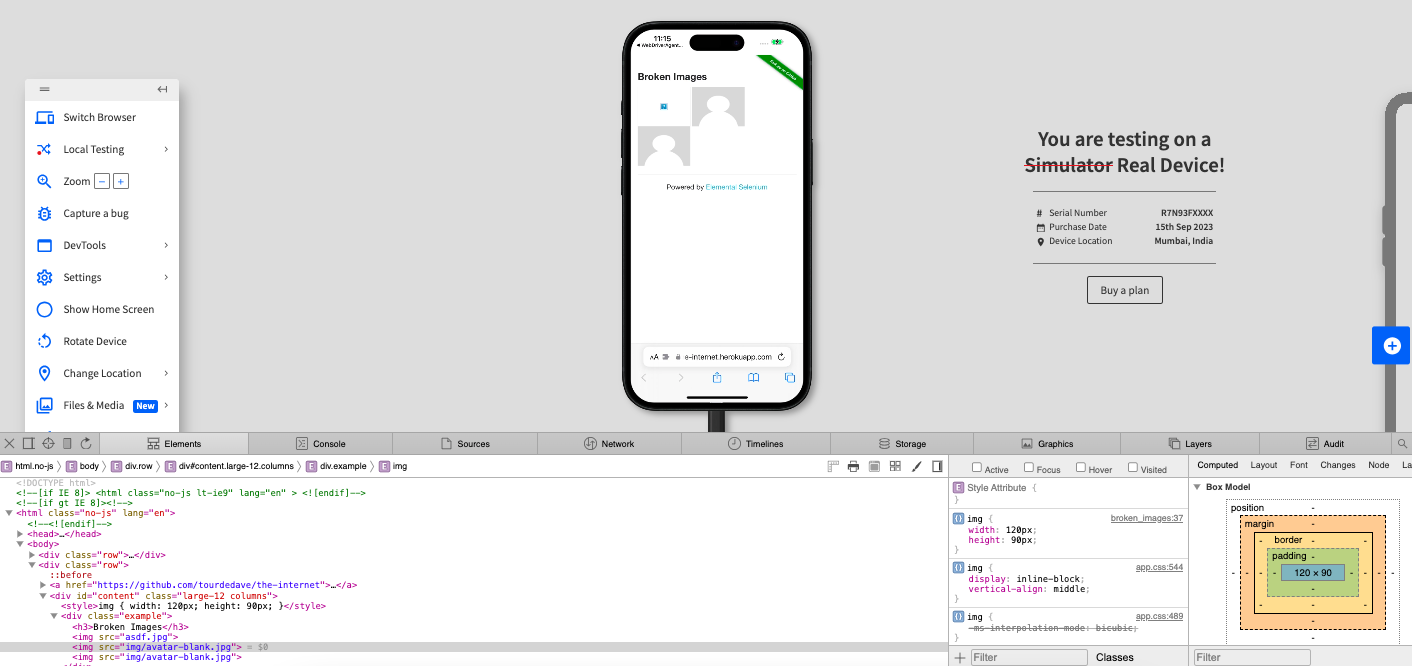
It is important to note that these changes are not permanent and just apply to the current session. Using this feature helps you simulate situations that you might encounter as part of your testing.
Why Debug Websites Using Real Device Cloud?
Testing websites on a real device cloud ensures precise results across various iPhone models and iOS versions. Real-device testing captures actual user behavior, performance, and rendering. It helps
- Catch real-world bugs that don’t show up in simulators
- Test layout, gestures, and performance on real hardware
- Switch between multiple iPhone models and iOS versions
- Avoid the setup and maintenance of physical device farms
- Debug behind firewalls or in staging environments without extra configuration
Read More: Remote Debugging on iOS and Mac Safari
Best Practices for Debugging Websites on iPhone Safari
Follow these best practices when debugging websites on iPhone Safari to ensure smooth performance and functionality.
- Test on multiple iPhone models and iOS versions: Verify compatibility across a range of iPhone models and iOS versions to ensure broad coverage.
- Inspect elements with Safari Web Inspector: Use the Safari Web Inspector for a detailed view of HTML, CSS, and JavaScript errors.
- Monitor console logs and network activity: The Console tab tracks real-time JavaScript errors, warnings, and network issues.
- Test touch interactions: Check the performance of touch interactions like swipes, taps, and gestures on the iPhone screen.
- Check Safari-specific issues: Verify layout, animations, and media queries for compatibility with Safari’s rendering engine.
- Test in landscape and portrait modes: Ensure your site’s responsiveness works seamlessly in both orientations.
- Verify cross-site tracking and pop-up blockers: Test for issues caused by Safari’s privacy features, such as pop-up blocking and cross-site tracking prevention.
Read More: How to Allow Pop-Ups on iPhone
- Use the device’s settings to simulate real-world conditions: Adjust settings such as time, location, and network to mimic various real-world scenarios.
Conclusion
Debugging websites on iPhone Safari ensures your site performs optimally across iOS devices. Use tools like Web Inspector and BrowserStack to identify layout, functionality, and performance issues. This helps create a smooth and reliable user experience across different iPhone models and iOS versions.
BrowserStack allows you to debug your website on 3,500+ real iOS devices and Safari versions. You can use the Safari Web Inspector in BrowserStack to identify issues with elements, monitor network requests, and make real-time changes. This helps ensure your website performs well in real user conditions.

