Debugging HTML is an essential practice in web development because even the slightest error in code can result in broken layouts, missing elements, or other unexpected behavior.
Unlike the programming languages, HTML by itself does not share erros or warnings. So troubleshooting HTML is a little different from JavaScript or CSS.
This guide will walk you through the common HTML errors and how to debug HTML effectively across different browsers and devices.
Introduction to HTML
HTML is the core language of web development and is the most popular. It is used by 97.4% of all websites available on the internet. Today, billions of people are actively visiting websites and making purchases along with a user-friendly customer experience. So it becomes essential for developers to keep the website user-friendly, adhere to responsive design, and be error-free.
HTML has kept evolving over the years and added new features and elements, including better structure, in-built compatibility, storage capability, and many more features that make the HTML-based website more powerful and preferred.
Why is Debugging HTML important?
Whenever HTML comes with new features and elements, developers also need to update their knowledge. Now, it is very common to get errors while writing the HTML codes for a web page. It may get unexpected errors like functions not working, interface issues, or not supporting cross-browser compatibility. Debugging plays an important role for developers to prevent all these errors from the HTML code.
By debugging the HTML codes, developers can identify the errors and resolve them to build an HTML website error-free according to World Wide Web Consortium (W3C) formal guidelines and structure. That’s why developers always prefer to debug their HTML codes to save their efforts & eliminate bugs/errors before they may cause any significant issues.
Learn More: HTML5 Browser Compatibility Test
Some Common HTML Errors
Detecting and fixing HTML errors facilitates proper rendering and functionality. Here are some common HTML errors:
Common HTML Errors
- Syntax errors
- Logic Errors
- Outlining elements
- Turning off styles
- Display type
- Cross-browser Compatibility issues
Syntax errors
One of the most common errors developers face in HTML is syntax errors. A developer can make mistakes while writing hundreds of lines of HTML codes that can cause issues like functions not working, programs not working, or showing different results. Usually, these are common syntax errors because of small typos or closed tags left by the developer. So it’s important to check the HTML codes in a validation tool to find such bugs or errors and resolve them faster.
Read More: Difference between Bugs and Errors
Logic Errors
Logic errors in HTML occur when the structure or behavior of a webpage does not function as intended despite the syntax being correct. Logic errors do not lead the page to break or display error messages. However, they can result in unintended results. Incorrect nesting of elements, using inline elements incorrectly, etc. are some examples of logic errors in HTML.
Outlining elements
Outlining elements is a complex & time-consuming process for developers that sometimes cause errors in HTML codes. Developers must resolve the issue to make the website interface mobile-friendly and interactive. Instead of writing CSS, many Chrome extensions are available to outline the elements that save developers both time & effort.
Turning off styles
For developers, it’s difficult to find a particular element style error by CSS. These errors are not easily recognized among hundreds of lines of HTML codes and can cause an issue later. So it’s essential to identify whether a CSS is applied on the element or is overridden by the default CSS.
In such a case, developers can use the in-built browser developer console to showcase the properties of CSS applied on each selected element. It helps developers to find whether CSS is applied on the element or overridden with another.
Display type
Every unique element in a web page has its display type, whether flex, block, inline-block, or many more. For developers, it’s hard to identify any element display type until their HTML codes follow the W3C guidelines.
To prevent errors and identify each display type, developers should write HTML codes according to formal W3C guidelines & standards.
Cross-browser Compatibility issues
Device-browser fragmentation is a hard-hitting issue in the testing ecosystem!
In today’s world, where billions of people are using smartphones and tablets, the demand for mobile-friendly websites is increasing. Sometimes HTML websites can face cross-browser compatibility issues where a website does not perform similarly on each device and this is an essential error that needs to be resolved.
Making your HTML5 code cross-browser compatible is also key to overcoming browser inconsistencies and ensuring a seamless experience across the different versions of various browsers.
Whether you’re testing HTML code in browser or finding HTML elements, BrowserStack is a one-stop testing platform for debugging and compatibility testing on 3500+ real devices and browsers. Let’s follow it up with the steps for debugging and more.
How to Debug HTML Errors
Here are the most effective ways to debug HTML errors:
Ways to Debug HTML
- Using BrowserStack Live
- Using Browser Developer Tools
- HTML Validator
1. Using BrowserStack Live
With the help of BrowserStack Live, testers can test their website functionalities in different conditions & browsers (like Chrome, Safari, Firefox, and Microsoft Edge) to debug HTML code, detect bugs and get detailed bug/error reports.
You can find bugs/errors on your website in just 4 simple steps
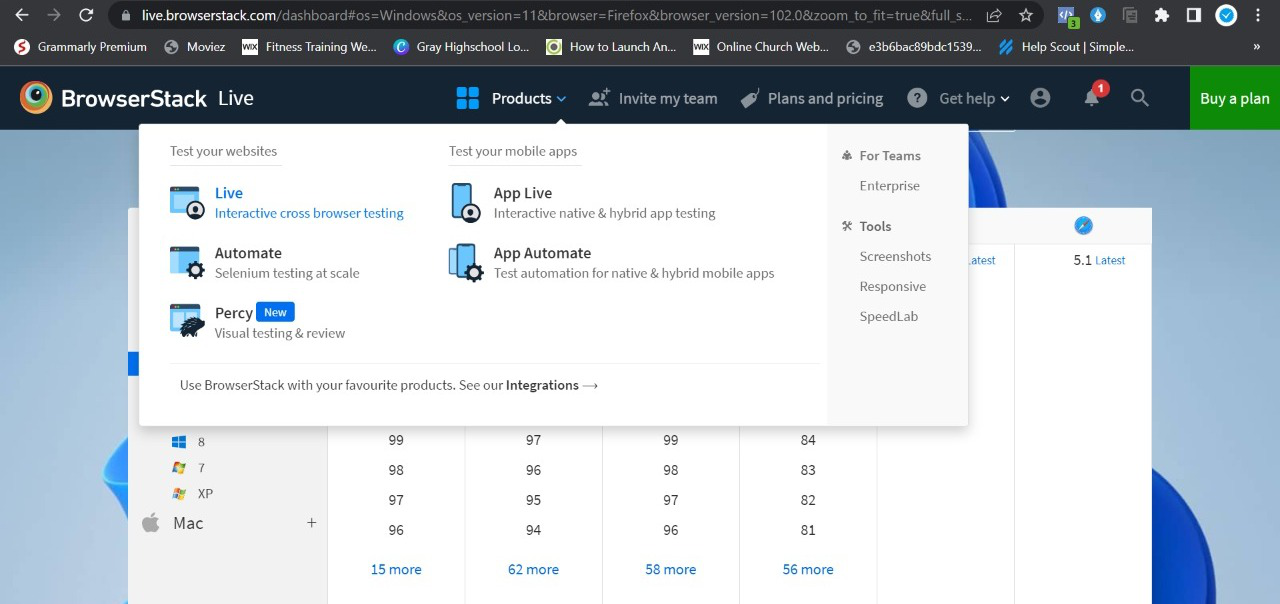
Step 1- Sign in to your BrowserStack account and go to Products – Live.
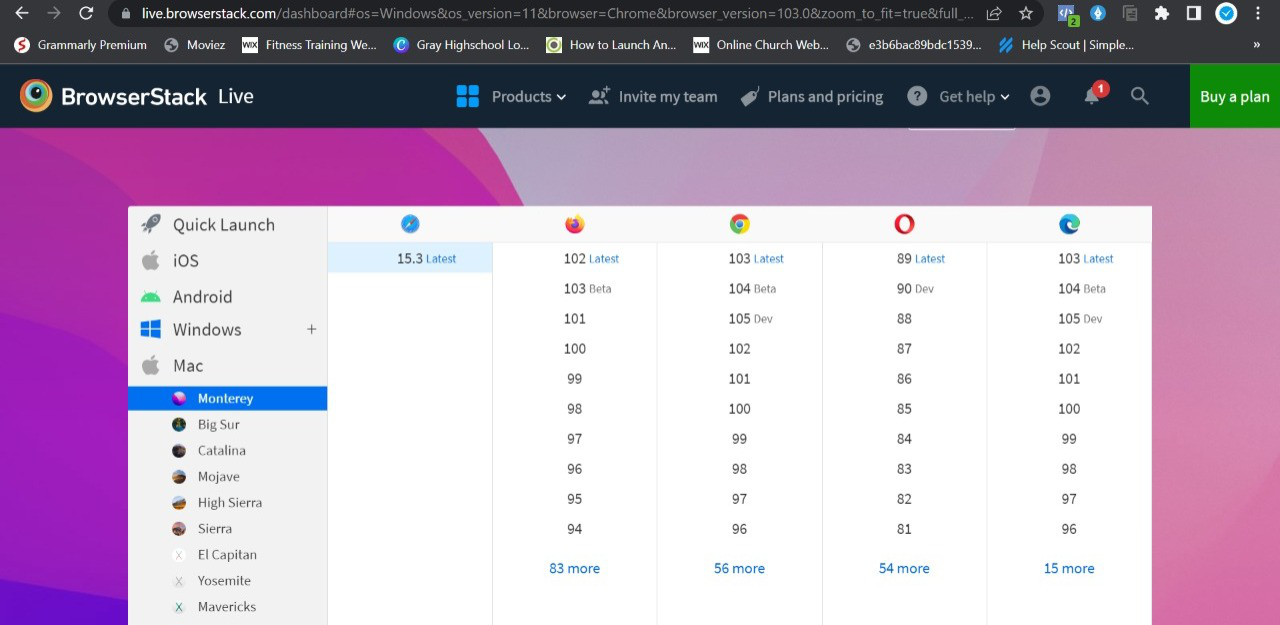
Step 2 – Select the OS & Browser from the list of available operating systems and browsers
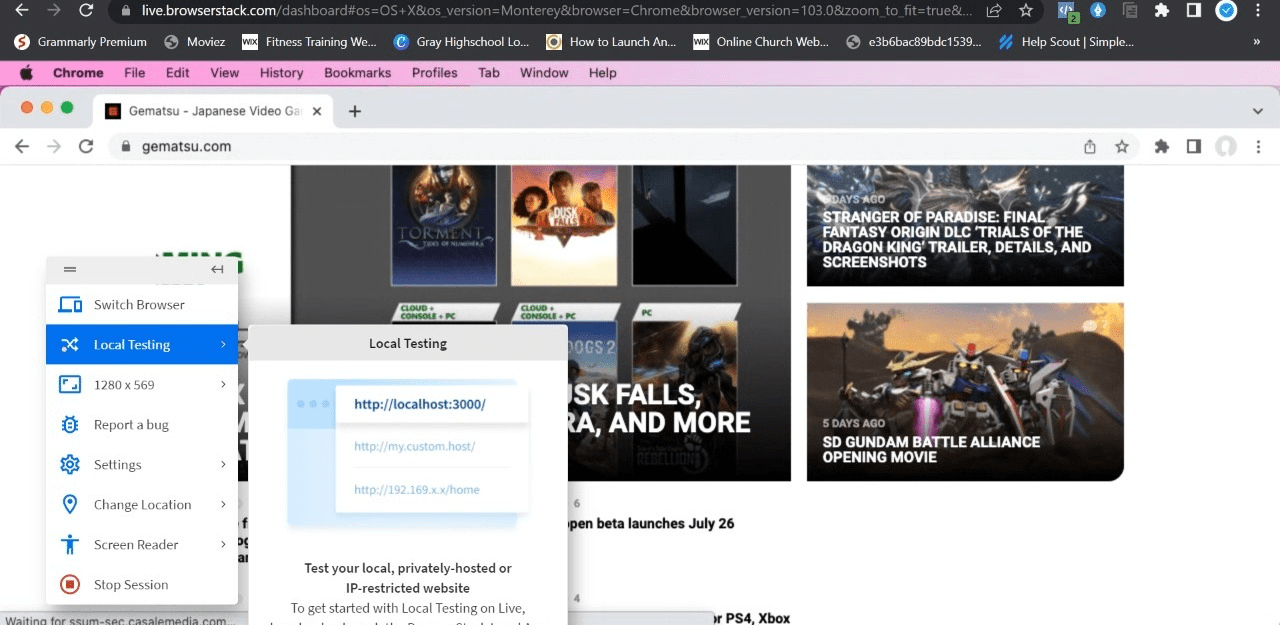
Step 3 – Insert your website URL and start testing its functions.
Step 4 – Get your detailed test report
By following these step-by-step processes, testers can easily identify – how to fix HTML errors on any website.
There are a lot more testing and debugging covered within the BrowserStack infrastructure, including
- Geolocation Testing: It’s mainly used to understand the website performance for different geographical locations as per your business requirements in different regions.
- Detailed bug reporting: While conducting cross-browser compatibility testing, get a detailed report of errors/bugs found on the website.
- Responsive testing: It’s used to identify the website screen resolution support on different devices.
- Local testing: Local testing is a type of testing where testers test the website as an end user’s environment.
- Network throttling: This type of testing identify the website performance on different network bandwidths
2. Using Browser Developer Tools
With Browser Developer tools, you can spot syntax errors, inspect the document structure, look for missing resources and even modify HTML in real time to get quick results. Here’s how you can debug HTML errors using browser developer tools in web development:
Step 1. Open Developer Tools
- You can press F12 in Chrome and Firefox.
- For Safari, Go to Preferences, then Advanced. After which, you can press Option + Command + I
Step 2. Check the Console
- Go to the Console tab
- Check for error messages like uncaught “Uncaught SyntaxError” or “Failed to load resource”.
- Click on the error and see where it is in the code
Step 3. Inspect Elements for Structural Issues
- Navigate the Elements tab.
- Choose Inspect after you right-click an element to highlight its HTML structure
- Check for missing or incorrectly nested tags
Step 4. Validate HTML in the Sources Tab
- Navigate to the Sources tab and review the HTML file
- See to it that the elements are dynamically modified or updated by Javascript
Step 5. Fix Broken Links
- Look for failed requests in the Network tab
- Take a look at file paths to see if CSS, Javascript, or image files are missing
3. Using HTML Validator
HTML validators help identify syntax errors, missing tags, and structural issues in the code. You can use these tools to analyze your HTML and obtain comprehensive reports on errors and warnings. Here’s how you can use an HTML Validator:
- Visit a HTML Validator Service
- Paste the HTML code, upload a file, or paste a webpage URL
- Start to analyze the code
- Assess the error report and resolve the issues highlighted
Best Practices to Debug HTML codes?
Here are some of the best practices you can follow while debugging HTML codes:
- Test in Multiple Browsers: Ensure that you test your codes on different browsers, as each of them could interpret HTML differently. You could use cross-browser testing tools like BrowserStack to test your codes on various browsers seamlessly.
- Check for Misnested tags: Make sure all tags are opened, closed and nested correctly.
- Format and Indent Code Properly: Make sure that the codes are well-structured to detect errors easily.
- Use a Code Editor with Syntax Highlighting: You can use code editors like VS Code, Sublime Text or CodePen to detect errors easily.
- Escape Characters: Ensure that special characters are correctly escaped to avoid conflicts.
Conclusion
To sum up, QA testers and developers are advised to debug their HTML to identify and fix HTML errors. However, do note that you can get faster results without compromising on the accuracy and solve any HTML errors before users do by testing software in real user conditions.
